Feeds:
Posts
Comments

Archive for the ‘States’ Category

Back in January, I shared a “Feel-Good” map from the American Legislative Exchange Council showing how school choice was spreading around the country.

Today, let’s review another feel-good map, in this case from EdChoice’s newest edition of The ABCs of School Choice.  As you can see, there are now school choice programs in 34 states, which is amazing progress.

Image

Indeed, there are actually 75 different school choice programs, with some being unfortunately limited.

But in a few states – notably Arizona, Arkansas, Florida, New Hampshire, and West Virginia – the programs are universal.

And I’ve written columns about the plans enacted by various states (West Virginia, Arizona, Iowa, Utah, Arkansas, Florida, Indiana, Oklahoma, North Carolina, Alabama, and Texas).

Here’s a chart showing the growth of school choice over the years.

Image

And here’s a chart showing the number of students directly benefiting (all students benefit to some degree since academic research shows that school choice leads to better performance by government schools).

Image

I expect next year’s version of this map and these charts will look even better.

Victory for students (and Milton Friedman) over teacher unions!

P.S. School choice is also an international phenomenon. I’ve written about programs in CanadaSwedenChile, the Netherlands, and Denmark.

Read Full Post »

I periodically share persuasive images, accompanied by “a picture says a thousand words.”

Today, let’s add to the collection with this image from the Committee to Unleash Prosperity that compares twenty states, all of which had no income tax back in 1960.

The red line shows the share of U.S. income earned in 11 states that imposed income taxes at some point after 1960. The blue line shows the share of U.S. income earned in the 9 states that have avoided that mistake.

The changes in relative prosperity are amazing (and confirm some research I shared in 2012).

Image

To be sure, there are many policies that determine long-run growth, so the above chart is not just about state income taxes.

But fiscal policy and income taxes are important when comparing states, as shown by Freedom the 50 States, Economic Freedom of North America, and the State Tax Competitiveness Index.

And, just as is the case with my Anti-Convergence Club, it’s very powerful when you use decades of data to show a trend.

P.S. I’ve warned for years about the risk of a state income tax in the state of Washington. Sadly (but predictably), the politicians are ignoring my advice.

P.P.S. Mississippi is trying to join the blue-line states. Let’s hop they do what is necessary to make that happen.

Read Full Post »

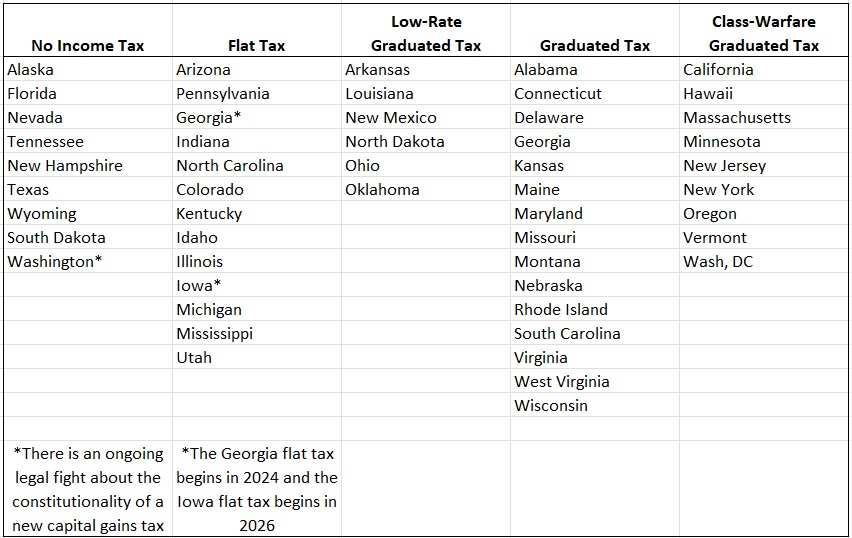
More than four years ago, I wrote about some very dubious leftist research that got lots of press attention.

It was, in my not-so-humble-opinion, a clear case of media bias and journalistic malpractice.

Let’s look at another example today.

Here’s a map from a report by Youyou Zhou in the Washington Post that supposedly shows the best places to raise children. You’ll notice that blue-leaning states such as Maine, New Jersey, Hawaii, Massachusetts, New York, Minnesota, and Virginia tend to have the highest scores (dark-colored counties are better, light-colored counties are worse).

Image

Meanwhile, red-leaning states such as Louisiana, Arizona, West Virginia, and Montana are at or near the bottom.

This got me slightly suspicious, so I checked the methodology and found that the results are largely because a report on where to raise children is heavily distorted by a variable on where to avoid children.

Here’s the methodology, which is based on some factors that are very appropriate (cost of living, education, and safety), but also includes abortion. Meanwhile, it leaves out some variables that presumably are very important.

I’ve added my commentary in red.

Image

Fortunately, the report is interactive, so you can choose which categories are most important.

And if you simply set the “personal liberties and parental support” variable to zero, the map suddenly looks much different.

Red-leaning states such as Mississippi, South Dakota, Idaho, and Texas suddenly look good and blue-leaning states such as New York, Vermont, California, and Washington score very poorly.

Image

Interestingly, Virginia does very well regardless of whether abortion is included, and North Carolina and Georgia also do well in both maps.

The report, to its credit, does include a graphic showing where people are actually having kids.

Lo and behold, fertility is highest in red-leaning states such as Utah, Texas, and Idaho.

Image

By contrast, Maine (which was supposedly one of the best states based on the report’s dodgy methodology) is the state with the lowest fertility.

Maybe, just maybe, Ms. Zhou should have considered whether the states with the highest fertility might actually be the ones with the best policies?

P.S.While I think the education methodology is reasonable, I wonder what would happen if the results were adjusted for demographics, as captured by this debunking of Paul Krugman.

White students in Texas perform better than white students in Wisconsin, black students in Texas perform better than black students in Wisconsin, Hispanic students in Texas perform better than Hispanic students in Wisconsin. In 18 separate ethnicity-controlled comparisons, the only one where Wisconsin students performed better than their peers in Texas was 4th grade science for Hispanic students (statistically insignificant), and this was reversed by 8th grade. Further, Texas students exceeded the national average for their ethnic cohort in all 18 comparisons; Wisconsinites were below the national average in 8, above average in 8.

Almost surely, red-leaning states would score even better.

P.P.S. Given the way red states economically out-perform blue states (see here, here, here, here, and here), including measures of prosperity other than affordability presumably also would generate different results.

Read Full Post »

I lied. Back in 2023, I wrote that Part V would be the last segment in my series on blue-to-red tax migration (with Parts I-IV available here, here, here, and here).

But I’ve decided to extend the series because here’s a must-share map showing how some states have lost – or gained – large amounts of taxable income as a result of people “voting with their feet” over a ten-year period.

Image

Notice that the worst states (darker red) are fiscal hellholes such as New York, Illinois, and California.

Meanwhile, the best states (darker green) are flat tax states or – even better – have no state income tax.

The map is part of an editorial in the N.Y. Post that bemoans the exodus of taxpayers – and taxable income – from New York and other high-tax states.

…the wonks at the free-market-advocacy group Unleash Prosperity are out with a study that exposes the true depths of flight from high-tax states. It’s not uncommon to look at the one-year losses and gains of income from internal migration such as taxpayers fleeing New York for Florida, but that fails to capture the long-lasting impact:Image The migrant’s income is lost (or gained) year after year for the rest of his or her life. This new report used Census and IRS data to calculate the cumulative impact; it finds that New York state has lost more than $500 billion in resident income over the past 10 years, while New Jersey has lost $170 billion. Nearly 2 million New Yorkers have moved away this past last decade; New Jersey has lost 500,000 residents to other states. New York has lost the most income of any state — and only California and Illinois have lost more money than New Jersey.

Much of the underlying research comes from the folks at the Committee to Unleash Prosperity.

Including this chart that shows the cumulative loss of adjusted gross income for the Empire State.

Image

What our friends on the left don’t understand (or pretend not to understand) is that a good chunk of that income would still be in New York – and still be taxed in New York – if politicians in Albany weren’t so greedy.

And let’s not forget that New York City politicians also are greedy, a problem that surely will get worse now that a crazy self-professed socialist has been elected as Mayor.

This won’t end well. Eventually some blue states will implode. When that happens, let’s keep our fingers crossed that the clowns in Washington don’t provide any bailouts.

Read Full Post »

Keeping with tradition, let’s look at the results from the Tax Foundation’s annual Tax Competitiveness Index (as I did in 2025, 2024, 2023, 2022, etc, etc).

Here’s a map showing how states are ranked. It’s good to be light green and it’s bad to be dark blue.

Image

It would have been nice if the Tax Foundation’s map identified and numbered the states to make it easy to identify the best and worst.

Though the report obviously has all that information.  Readers who are familiar with state tax issues won’t be overly surprised to see Top-5 and Bottom-5 jurisdictions.

Image

The report is based on several variables, such as business taxes, sales taxes, and property taxes.

A good rule of thumb, however, is that a state will score highly if it does not have an income tax (which is the case for the Top-5 jurisdictions).

Likewise, a class-warfare based tax system is a good way of ranking near the bottom.

In addition to knowing which states are the best and worst, I also think it’s important to know which states are improving and deteriorating over time.

So I dug into the Tax Foundation’s archives and identified the states that have enjoyed the biggest jumps as well as the ones that suffered the biggest declines since 2011.

As you can see, the state of Washington is a train wreck, as are Illinois and Oregon. Kudos to North Carolina for a huge jump, and special mention for Iowa and North Dakota.

Image

Keep in mind that some states have always been good (like Florida and South Dakota) and some have always been bad (such as New York and California), so they would not show up in a table measuring relative changes.

P.S. One final comment is that I don’t think Wyoming deserves to be highly ranked. It has a bloated state budget, but most of that spending is financed by energy severance taxes, which are not counted in the rankings. I think Alaska is over-ranked for the same reason.

Read Full Post »

Just like I’ve done in previous years (2024, 2023, 2022, etc, etc), it’s time share some highlights from the Tax Foundation’s annual report on state tax competitiveness.

The 2025 version has been released and this map shows states with better tax systems (light colored) and worse tax systems (darker is bad).

Wyoming, South Dakota, and Alaska win the gold, silver, and bronze medals. The booby prizes go to New York, New Jersey, and California.

Image

Unsurprisingly, states with no income taxes tend to score highly, followed by states that belong to the Flat Tax Club.

States with class-warfare systems, by contrast, are near the bottom.

What I find fascinating is the list of states that have risen of fallen in the rankings.

Here are states that enjoyed the biggest improvements between 2020 and 2025.

  • +27 Tennessee
  • +24 Iowa
  •  +9 Arkansas
  •  +6 Idaho
  •  +6 Kansas
  •  +5 Oklahoma

I’m a bit surprised by Tennessee’s big increase. Yes, it cemented its no-income-tax status by getting rid of levies on interest and dividends, but I would think more than that would be necessary for such a big improvement.

Iowa’s big jump, however, makes a lot of sense given that it replaced a high-rate discriminatory income tax with a simple and fair flat tax.

And here are states that suffered the biggest declines, with the Pacific Northwest clearly in a downward spiral.

  • -37 Washington
  • -21 Oregon
  • -10 Colorado
  •  -7 Massachusetts
  •  -7 New Mexico
  •  -5 Maryland
  •  -5 Virginia

I’m guessing that the state of Washington plummeted because it enacted a capital gains tax (contrary to the state’s constitution, but aided and abetted by a partisan judiciary).

Though that seems like a huge decline, as does Oregon’s big drop.

I’ll close with some nit-picking. The Tax Foundation’s Index is based on corporate income taxes, personal income taxes, sales taxes, property taxes,  and unemployment insurance taxes.

ImageIt does not include a variable for total tax collections. If it did, Wyoming and Alaska would be ranked much lower since both of those states finance bloated public sectors with taxes on their energy sectors.

Another minor quibble is that rankings only give relative scores (i.e., Florida is better than Illinois). It would be interesting if the Tax Foundation also gave grades using some sort of absolute metric, especially since there has been a big shift toward better tax policy in many states.

Which is why I personally think South Dakota has the nation’s best tax system.

One final comment is that the Tax Foundation is looking only at the tax side of the fiscal equation. For readers interested in the spending side of the fiscal ledger, I did some rankings back in 2020 that gave high marks to Idaho (not my first guess, but also not surprising) and Connecticut (so shocking I wonder if I made a mistake).

Read Full Post »

Why is the private sector efficient and the government inefficient?

I answered that question back in 2017, noting that there is feedback (both positive and negative) in the private sector. With government, by contrast, it seems that there are no consequences of any kind.

…people in the private sector make mistakes (most new business ventures ultimately fail, for instance), but I explain that’s part of a dynamic process in a market economy. Every success and every mistake leads to feedback, both via the price system and also via profits and losses.Image All of which leads to continuous changes as people – especially entrepreneurs – seek to better serve the needs and wants of consumers, since that’s how they can increase their income and wealth. In other words, Adam Smith was right when he said that self interest encourages people to focus on making others better off. By contrast, when politicians and bureaucrats allocate resources (either directly via spending programs, or indirectly via regulation or tax distortions), feedback mechanisms are very weak. Once politicians intervene, they never seem to care if they are generating positive results.

Today, let’s look at an example of this phenomenon.

It comes from New York, where the state government recently tossed $100 million in a toilet.

Here are some jaw-dropping details from a report by Greg Floyd of Albany’s CBS affiliate.

More than $100 million was spent on specialty lighting intended to illuminate New York State bridges, but the lights were never used and have been sitting in storage for two years. ImageThe New York Power Authority purchased the lighting equipment and design plans under former Governor Andrew Cuomo… However, the lights remained in cardboard boxes inside a warehouse, costing taxpayers an additional $2.1 million in storage fees over seven years. In late June, the state attempted to recoup some of the costs by auctioning off the lights. Despite the initial $100 million investment, the auction yielded only $383,000. Taxpayers are left to bear the financial burden of the unused lighting project.

This absurd bit of government inefficiency motivated a talk radio host to post a tweet summarizing what happened.

Image

Except he’s being too nice.

The government didn’t squander merely $99.6 million. You also need to add the $2.1 million in storage costs.

So the total loss is $101.7 million.

Returning to the point I raised at the start of today’s column, I can’t help but ask if anyone lost their job because of this horrific example of waste?

Andrew Cuomo was forced to resign, but because of sexual harassment rather than taxpayer harassment. So that doesn’t count.

But what about the political appointees and bureaucrats who were involved with this boondoggle? Did any of them suffer any adverse consequences?

Given the no-consequences track record of government, I’m doubtful.

P.S. I feel sorry for the voters of New York City. Their main choices for Mayor are the profligate Andrew Cuomo, the corrupt Eric Adams, and the lunatic Bolshevik Zohran Mamdani.

P.P.S. For other examples of inane policy at the state level, click here.

Read Full Post »

In 1972, Ohio politicians made the mistake of imposing a state income tax.

That first tax had a top rate of 3.5 percent, but politicians quickly became addicted to this new source of tax revenue. By 1984, the top rate had jumped to 9.5 percent.

ImageThat’s the bad news.

The good news is that Ohio has been moving in the right direction over the past two decades.

The top tax rate was over 7 percent in 2005. This year, it’s less than half that level.

But the even-better news is that Ohio is shifting to a low-rate flat tax.

Here are some excerpts from a report by Mike Gaunter for WFMJ.

Ohio Gov. Mike DeWine on Monday approved the state’s new two-year spending plan, which includes a major shift in how Ohioans pay state income taxes. This change, pushed by Republican lawmakers, aims to make the tax system simpler and reduce the amount of money people owe.Image The thrust of the tax plan is a move towards a 2.75% flat income tax rate… This flat rate is set to be fully in place by the 2026 tax year. Before the flat rate officially starts, the budget also lowers the highest income tax rate immediately. For the 2025 tax year, the top rate, which currently stands at 3.5%, will go down to 3.125%. A benefit for many Ohio residents is that if their income, after certain deductions and exemptions, is $26,050 or less, they will not pay any state income tax at all.

Kudos to Buckeye State lawmakers.

They have joined the tax cut/tax reform revolution that has led to better tax policy over the past few years.

As such, it’s time to update my table showing the type of income taxes that exist (or don’t exist!) in the 50 states.

Image

As you can see, this table is much better than the first one I created back in 2018.

What Ohio now needs is to copy Mississippi and begin the process of totally repealing the income tax. It’s very feasible if lawmakers follow one simple rule.

Read Full Post »

When I write about state economic policy, my go-to resources are Economic Freedom of North America and Freedom in the 50 States.

But I need to add Rich States, Poor States, which is published by the American Legislative Exchange Council.

Here’s a look at the rankings from ALEC’s most-recent report. Congratulations to Utah, which is in first place (and it’s been in first place ever since 2008), with Tennessee and Indiana rounding out the top 3.

Image

Since I’m a fiscal wonk, I can’t resist pointing out that Utah and Indiana have flat taxes and Tennessee has no state income tax.

More broadly, what’s interesting about the ALEC report is how the rankings differ compared to my go-to indices.

The worst states are very similar (basket cases such as Illinois, California, New York, and New Jersey), but the best states are not the same,

In Economic Freedom of North America and Freedom in the 50 States, Florida, New Hampshire, and South Dakota get top scores.

But Utah, Tennessee, and Indiana top the ALEC report.

Yet all three indices are methodologically sound. Here are the variables in the ALEC report.

Image

One final comment is that it’s disappointing that my state of Virginia is only #32.

P.S. All of the indices should start measuring the presence of school choice, which is now a major difference with some states being very good and others being awful (i.e., controlled by teacher unions).

Read Full Post »

One of the most unfortunate features of Trump’s Big Beautiful Bill is that it expands the deduction for state and local taxes, thus weakening one of the best provisions of the 2017 tax package.

This is bad news since it is foolish to have a loophole that makes it easier for states to impose higher taxes to fund more wasteful government.

For evidence, let’s consider a comparison of Florida and New York. And we’ll start with this chart, which shows that New York spends far more, on a per-capita basis, than Florida.

Image

The chart comes from a new report by David Ditch of the Economic Policy Innovation Center.

He explains why it is very foolish for taxpayers elsewhere in the country to subsidize New York profligacy.

The House-passed OBBB increases the SALT deduction from $10,000 to $40,000 per taxpayer at a cost of $377 billion over 10 years, leaving less room for pro-growth tax reforms. …A review of the governance of New York State shows the punishingly high state and local taxes paid by Empire State residents benefit wasteful and corrupt bureaucracies.Image Increasing the SALT deduction would further subsidize New York’s dysfunction. Spreading the costs across the country would encourage more graft… Contrasting New York’s budget with that of Florida is instructive. …In 2000, New York State spending per capita was already 30% higher than Florida. By 2024, New York spent 133% more per capita than Florida. …It is understandable that representatives of high-tax districts in New York want to assist their constituents. However, threatening to force massive tax hikes on all Americans for the sake of a bloated SALT deduction is the wrong solution.

The report also explains that New York is abusing the Medicaid program, which is yet another reason why that program desperately needs reform.

But here’s the part of David’s report that is even more astounding, albeit in a depressing way.

New York’s per-student spending is the highest in the nation, including an average of $35,000 per student this year. …Public school spending is driven by the demands of politically powerful teachers’ unions. …Yet, higher education spending has produced worse outcomes. In 2022, New York’s 4th graders ranked 36th in the nation in reading and 46th in the nation in math. Meanwhile, Florida spends about $13,000 per student and its 4th graders rank 3rd in the nation in reading and 4th in the nation in math.

More money leading to worse results is not a surprise. But this is the steroid-fueled version.

I’ll close by sharing a chart from the Committee to Unleash Prosperity.

Is anyone surprised to see that people are moving from New York to Florida and not the other way?

Image

P.S. For those who want additional comparisons of bad governance in New York and good governance in Florida, here are the previous editions in this series:

P.P.S. You can also read comparison between Texas and California by clicking here, here, here, here, here, here, here, here, and here.

Read Full Post »

Excessive government spending is America’s top fiscal problem.

To be more specific, poorly designed entitlement programs are leading to an ever-growing spending burden that ultimately will either lead to massive tax increases or a debt crisis.

To avoid either of those bad options, we need entitlement reform.

I’ve previously written about how to fix “social insurance” programs for older people, such as Social Security and Medicare.

Today, let’s look at the other category of entitlements, the “means tested” programs for low-income people, such as Medicaid and food stamps.

Let’s start by looking at two charts from the Economic Policy Innovation Center.

The first chart shows how fast spending on health programs is increasing, along with a line showing how fast spending increases if Republicans in Congress succeed with some reforms to the Medicaid program.

Image

The second chart shows how food stamp spending dramatically spiked during the pandemic and has since stayed very high because Biden expanded the program.

Image

Ideally, the way to deal with both programs is to copy Bill Clinton’s successful welfare reform by shifting the programs back to the states.

In the short run, this would mean giving states a “block grant” and giving them the flexibility to figure out the best ways of spending the money.

In the long run, the ideal policy would be to phase out the block grants so that states can decide both how to raise money and how to spend money.

Matt Weidinger of the American Enterprise Institute has a similar perspective. Here are some excerpts from a recent article.

The case for reform starts with the perverse incentives for excessive benefit collection embedded in current federal welfare policies. For example, under the Supplemental Nutrition Assistance Program (SNAP), commonly known as food stamps, federal taxpayers now cover 100 percent of benefit costs. That policy offers an open-ended stream of federal funding for bigger benefit caseloads than states might otherwise choose to maintain if they bore some of the benefit costs themselves.Image …In a similar fashion, Medicaid “expansion” policies—which cover nearly all adults with incomes up to 138 percent of the federal poverty line—presently provide states “with an enhanced federal matching rate (FMAP) of 90% for their expansion populations.” That enhanced FMAP significantly exceeds the federal reimbursement rate for other Medicaid recipients, including children, pregnant women, seniors, and disabled individuals, which varies by state from 50 to 83 percent. …To state the obvious, placing all, or nearly all, of the financial burden for benefit payments on federal taxpayers contributes to swollen caseloads, as it subsidizes state policy choices that promote greater benefit receipt. …in the long run federal policymakers will have no choice but to transition to greater state financial responsibility for programs like SNAP and Medicaid. …Such improvements are not without precedent. When welfare reforms in the 1990s placed increased financial responsibility on states, states responded by implementing changes that increased work and reduced caseloads, yielding significant savings for both state and federal taxpayers.

As far as I’m concerned there should not be “greater state financial responsibility.” These programs should be the complete responsibility of states.

That will lead to competition and innovation, which presumably will inform us what approaches are good for both taxpayers and poor people.

I’ll close by sharing two charts from Weidinger’s article, both of which show that the current approach is a windfall for blue states.

Notice how it is mostly blue states (plus fiscally profligate Alaska) that lure more people into Medicaid dependency.

Image

Similarly, it is blue states that produce the most food stamp dependency.

Image

As far as I’m concerned, blue states should have the freedom to adopt bad policy (which I’ll then be happy to write about, as you can see here, hereherehere, and here).

But if they want to create more welfare dependency, they should be willing to pay for it themselves.

Read Full Post »

As illustrated by the changes in my state tax rankings between 2018 and 2023, there’s been a lot of progress.

Several red states have shifted to flat taxes and lowered tax rates, putting the class-warfare blue states at an even bigger disadvantage (and some of those left-leaning states actually want to make their tax regimes even less competitive!).Image

While I cheer the shift to better tax policy, I’ve been disappointed that no state in recent years (or recent decades) has made the ultimate leap and joined the no-income-tax club.

That may be about to change.

State lawmakers in Mississippi have passed a law designed to phase out the income tax over 15 years.

Alex Rosado of Reason has some of the details.

Mississippi has joined a small club of nine other states in passing legislation eliminating the state income tax—an outcome that will benefit Mississippians and hopefully encourage other states to follow suit. …The new legislation will gradually lower Mississippi’s state income tax, currently sitting at 4.4 percent, to 3 percent by 2030. ImageFurther annual cuts depend on “growth triggers” linked to state revenue. …States with low-income taxes enjoy greater economic prosperity. Just compare Texas, which has no personal income tax, and Oklahoma, which has a top rate of 4.75 percent. Last month, the Tax Foundation found that Texas’ economy grew roughly 35 percent faster than Oklahoma’s over the last two decades, with Texas’ personal incomes and gross state product being notably higher too. A 2008 longitudinal study that analyzed economic growth in the States from 1964 to 2004 found that states with higher income taxes stifled economic growth, entrepreneurialism, and access to capital.

Douglas Carswell of the Mississippi Center for Public Policy played an important role in the reform.

In a column for the Foundation for Economic Education, he writes about this important development.

Mississippi has made history as the latest state (and the first since Alaska in 1980) to pass legislation banning a state income tax. …Beginning next year, Mississippi’s income tax rate will drop in 0.25% increments, sliding from 4% to 3% by 2030. After that, further reductions will hinge on the state’s budget surplus. ImageGiven Mississippi’s recent track record of substantial surpluses, the income tax could vanish entirely by the mid-2030s. …The push to eliminate the income tax has been a cornerstone of Governor Reeves’s agenda, with serious legislative efforts kicking off in 2022 under then-House Speaker Philip Gunn. Gunn’s genius was to simplify the state’s variable tax rates into a flat 4% on income above $10,000. While this didn’t eliminate the tax outright, it leveled the playing field for Mississippi households, setting the stage for broader support of full elimination. …this is great news for our state. Already there is evidence that in 2024, by some measures, Mississippi performed well economically, and may have been one of the fastest growing states in America that year. This tax reform will only add to this Mississippi momentum.

Let’s also look at some excerpts from an editorial in the Wall Street Journal.

Gov. Tate Reeves signed a bill last month that puts Mississippi on a path to zero income tax, albeit in about 14 years. Yet the messaging is right, as the state tries to lure business investment. Mississippi is sandwiched between two economic powerhouses, Texas and Florida, which don’t tax their residents’ incomes.Image Neither does Tennessee next door. …a law passed in 2022 is already set to cut that next year to 4%. But under the bill Mr. Reeves signed, the plan is to keep going to 3% by 2030. Reductions after that, until the tax is phased out, are conditioned on hitting revenue triggers. …The important point is that the path to zero is now enshrined in law, which is a big deal that workers and employers won’t fail to notice. The economic success of the eight states that don’t tax personal income has created a race in GOP-run states to join them, or at least to cut rates and get as close as politically possible.

Last but not least, Russ Latino’s column in National Review celebrates the abolition of the income tax and other good reforms.

Under the Build Up Mississippi Act, the Magnolia State will become the tenth state to operate without a tax on work. Only one other state, Alaska, has ever eliminated an income tax once in effect. The particulars aren’t all that sexy. The state’s flat income tax will phase down to 3 percent by 2030, marking an annual cut of some $647 million by conclusion of the phase-in.Image From there, revenue growth triggers will be used to pare the rate down to zero. …Since the passage of Bryant’s education reforms in 2013, Mississippi leads the nation in both math and reading gains on the National Assessment of Education Progress tests. Once last, Mississippi’s fourth graders now rank ninth in reading and 16th in math. …When you start behind, there’s a lot of room for improvement. That certainly remains true here. Getting off the bottom requires taking risks that require intestinal fortitude. But conservative ideas are working, and Mississippi has momentum.

By the way, all of the above articles note that the bill contains a typo that actually makes it easy to meet the aforementioned revenue triggers.

I’ll close, however, by focusing on an issue that is far more important.

I like that the Magnolia State has a goal of eliminating the income tax. Such a reform would be great for jobs and growth.

But what will really determine success is not a typo in the bill, but rather a commitment to long-run spending restraint.

Here is a look at the state’s performance in recent years. As you can see, the fiscal constraint last decade evaporated this decade.

Image

Looks like Mississippi needs a Colorado-style spending cap. Given TABOR’s strong track record, that would be the best way of making sure future politicians don’t mess things up.

P.S. Louisiana also is looking at how to abolish its income tax (once again, a TABOR-style spending cap is key).

Read Full Post »

I often cite the 20th Theorem of Government (France, Brazil, Colombia, Maryland) to emphasize the danger of spending profligacy.

Today, let’s add the state of Washington to that list.

We’ll start with a chart from Americans for Tax Reform showing that the burden of state spending has expanded faster than population plus inflation.

Image

As one might suspect, bad spending policy leads to bad tax policy.

I’ve already written, both in 2010 and 2015, about politicians in the state doing everything they can to impose an income tax.

Sadly, they have been able to get through a capital gains tax, thanks in part to Justices on the state’s supreme court deciding to put ideology above the Washington constitution.

Emboldened by that move, state politicians now want a form of wealth tax.

But the mere threat of such a discriminatory levy is already having a negative impact. In an article for Bloomberg, Anna Edgerton writes about how politicians in the state of Washington are driving away the geese who lay the golden eggs.

At a Christmas party last year in Las Vegas, nearly a dozen wealthy former residents of Washington state compared notes on their transition to the desert. …Las Vegas realtor Ryan Tsui has been watching the exodus unfold. The Evergreen State ex-pats he’s helped move to his city are almost exclusively wealthy, he said, with many looking for houses worth $8 million or more. …“Some of these high net worth people are liquidating a career of stock options from the nineties to now,” said Tsui. “That starts to add up.” Such portfolios are now a target in Washington. Senate Democrats included a 1% tax on the stocks, bonds, exchange-traded funds and mutual funds… Washington’s wealthy had already been watching their tax burdens rise.Image The state’s 7% tax on capital gains over $270,000, which survived legal challenges and a repeal effort, has only been collected since 2023. …Nevada, which has no capital-gains tax and no estate tax, isn’t the only place Washingtonians are looking. There is Arizona, where income and capital gains are taxed at 2.5% and there is no estate tax. Florida and Texas are also attractive… Investment magnate Ken Fisher blamed a state supreme court decision upholding Washington’s capital-gains tax for his move to Texas in 2023. Amazon founder Jeff Bezos didn’t cite taxes as factor in his move from Seattle to Miami in 2023, though he likely saved $288 million when he sold $4 billion in Amazon stock less than four months after he relocated. …The northwest corner of the US hasn’t seen the same population outflows as fellow blue states like California, New York and New Jersey. Washington, while politically liberal, has comparatively low taxes. Now the budget debate in Olympia, the state capital, is raising questions about the unintended consequences of vowing to soak the rich. …Washington’s loss is increasingly looking like Nevada’s gain. Jeff Saling, head of StartUpNV, said he was driving when someone told him about Washington’s then-new capital gains tax. …“As somebody who’s working on economic development, to see somebody shoot themselves in the foot like that, it makes me cry a little bit,” Saling said. “But at the same time, it’s a hell of an opportunity for us.”

Needless to say, I applaud when successful taxpayers escape greedy politicians.

Indeed, I hope so many entrepreneurs and investors leave the Evergreen State that Washington winds up with a fiscal crisis.

Maybe, just maybe, the politicians in Olympia would then learn that there are consequences to economic illiteracy. Though I confess politicians in Illinois and California haven’t learned, and they’ve caused even greater levels of damage.

P.S. If you want to know one of the reasons why the state is in trouble, Washington had one of the nation’s worst governors between 2013 and 2025. In some years, he was the worst governor.

Read Full Post »

In Part XIII of my series comparing Texas and California (previous seven editions can be found here, here, here, here, here, here, and here), I shared data showing that the burden of state spending was growing much faster in the not-so-Golden State.

Today’s column is going to compare job growth.

We’ll start with this chart, which shows a slam-dunk victory for the Lone Star State. Texas easily beats California in total job creation for 2024, as well as winning almost every category of employment in the private sector.

Image

California created more government jobs, which is a Pyrrhic victory. And California also wins in creating what I call quasi-government jobs (a category that includes health care and social assistance).

The above chart comes from an editorial in today’s Wall Street Journal.

Here are some excerpts from that column.

…the Labor Department’s latest state jobs report…shows that California lost jobs in nearly every industry in the year before Donald Trump took office. …California gained a net 22,400 from January 2024 to January 2025. All of its net new jobs were in government (58,300), and healthcare, social assistance and private (often higher) education (148,200), which rely to a large extent on government spending.Image …Private businesses shed jobs in the year…a result of small businesses closing because of high taxes and other costs. …Large companies are also relocating workers to lower-tax and -cost states. Texas added 187,700 jobs over the same period… One problem for Democrats in Sacramento is that their progressive tax regime (with an effective top marginal rate of 14.5% on wage income and 13.3% on investment income)… A growing problem for Mr. Newsom’s national ambitions and his party is that California epitomizes the leftist policies that harm workers and employers. That’s why so many are leaving for Texas.

These are sobering numbers, especially since California has lots of natural advantages, such as weather. It also started out as a richer state.

But bad policy is like a cancer, eating away at state competitiveness.

The bottom line is that California’s class-warfare tax system and other policy mistakes are causing it to lose ground when compared to states such as Texas.

That continued last year and almost surely that trend will continue so long as Texas is smart enough to avoid an income tax (almost certainly) and smart enough to join the school choice club (supposedly imminent).

P.S. This joke about Texas and California is the 6th-most viewed column of all time. Very fitting.

Read Full Post »

California’s top fiscal problem is an ever-growing burden of government spending. In case anyone thinks that is just empty rhetoric, the state budget over the past three decades has risen at twice the rate of inflation.

One consequences of ever-expanding government is that California arguably has terrible tax policy.

A main reason for the low scores is that spiteful state lawmakers have turned the income tax into a vehicle for class warfare.

Here’s a chart shared by Grover Norquist showing that not only does California have the highest tax rate among the states, but it actually has the nation’s three-highest tax rates.

Image

To make a bad situation worse, the not-so-Golden State also has the country’s 6th-highest corporate tax rate, so both individuals and businesses in California are mistreated.

But just like a mistreated dog might run away from home, the same is true for taxpayers. Notwithstanding the state’s major advantages (climate, recreation, topography, etc), it is losing residents at a startling rate.

Including some major taxpayers (and some of the ones that stay have figured out how to dramatically slash their tax bills).

And it’s also losing businesses. Here are some excerpts from a 2022 editorial in the Wall Street Journal.

The report by Hoover senior fellow Lee Ohanian and Spectrum Location Solutions President Joseph Vranich finds that 352 companies moved their headquarters from California between 2018 and 2021. ImageTwice as many businesses left last year (153) than in 2020 and 2019 and three times as many as in 2018. The top destinations: Texas (132), Tennessee (31), Nevada (25), Florida (24) and Arizona (21). What do they have in common? Low taxes… California’s high top marginal income-tax rate (13.3%) punishes small pass-through businesses that pay income taxes at the individual rate as well as managers in C-suites.

The following year, Eric Boehm of Reason added even more evidence.

For decades, California has been a desirable destination for Americans… That dream is over for an estimated 343,000 Californians who fled the state between July 2021 and July 2022… Those heading out of state tend to be wealthier residents,Image and their exit threatens to blow a hole in the state’s finances. California lost about $343 million in tax revenue during 2021 due to out-migration… Combine that with the fact that more jobs can be done from anywhere, and Americans on average are wealthier than ever. As a result, more people have the means and incentive to actively choose where to live, work, and pay taxes.
States must adjust to this new reality. Otherwise, they will discover, as California is, that punishing prosperity comes at a cost.

This trend continued in 2024 and I’m sure it will continue in 2025. And Beyond.

Which raises the interesting question: When will there so many people riding in the wagon that there no longer will be enough people to pull the wagon?

P.S. California’s policies are so terrible that it’s the only state to have generated multiple humor columns (see here, here, here, here, here, and here).

Read Full Post »

I’ve written countless times about how taxpayers “vote with their feet” against high taxes and big government.

Most recently, I wrote about rich people escaping Norway because that country’s left-wing government dramatically boosted its wealth tax.

But rich people are not the only ones who move.

Here’s a map based on data from U-Haul. It highlights the states that people are escaping (in red) and the states where people are seeking refuge (in green).

Image

Unsurprisingly, most of the states gaining population are no income tax and flat taxes.

Meanwhile, the states losing population include some of the country’s worst tax-and-spend jurisdictions.

Taxes obviously are not the only reason why people move from one state to another, but there’s a long-standing pattern of people moving to places that have lower fiscal burdens.

And, thanks to tax competition, this process will probably get even stronger. Here are some excerpts from an editorial in yesterday’s Wall Street Journal.

Tax changes that took effect on Jan. 1 are widening the tax divide… Start with New Hampshire, which eliminated its 5% tax on dividends and interest income, thanks to Gov. Chris Sununu and the GOP Legislature. The Live Free or Die State already had no income tax on wages. ImageThe lack of a levy on investment income will make the state even more of tax refuge in the Northeast. Look for more migration from Massachusetts, which abandoned its flat tax in 2022 to enact a 9% top income-tax rate and is Taxachusetts again. …Iowa enacted a 3.8% income-tax rate for all—the culmination of Gov. Kim Reynolds’s six-year campaign to cut the top rate from 8.98%. First-term Louisiana Gov. Jeff Landry signed a flat tax last month, dropping that state’s income-tax rate to 3% from 4.25%. …Mississippi…dropped its rate to 4.4% from 4.7%, and North Carolina, which cut to 4.25% from 4.5%. The Tar Heel State, which has boomed since cutting taxes in 2014, will further reduce the income rate to 3.99% in 2026.

Needless to say, all of these changes create an ever-larger incentive for people to escape high-tax states such as California (top rate of 13.3 percent) and New York (top rate of 10.9 percent…and over 14 percent in New York City!).

P.S. I have a four-part series on people escaping from blue states to red states.

  • In Part I of this series, we looked at how people – and taxable income – are moving from high-tax states to low-tax states.
  • In Part II of this series, we reviewed how tax-motivated migration will create further fiscal nightmares for high-tax states.
  • In Part III of this series, I shared excerpts from a column I wrote for Bloomberg about why state tax competition is desirable.
  • In Part IV of the series, I examined at the 10-biggest state-to-state moves in 2022, with California looking very bad.

P.P.S. The most astounding example of out-migration surely must be Venezuela. More than 7 million people have fled that nation’s socialist disaster.

Read Full Post »

Part I of this series looked at unfunded pension debt of states and Part II examined the unfunded pension debt of cities.

In Part III, let’s look at the degree to which state taxpayers are exposed to big unfunded liabilities for “Other Post-Employment Benefits” such as health care and life insurance.

The American Legislative Exchange Council issued a report earlier this year that calculated the state-by-state burdens. Hawaii is the worst of the worst, followed by New Jersey and Alaska. South Dakota and Nebraska do the best job of protecting taxpayers, followed by Kansas.

Image

But what does is mean to be the “worst of the worst”?

The ALEC report calculated that the burden for taxpayers in Hawaii, New Jersey, and Alaska is nearly $20,000 for every man, woman, and child in those states.

That compares to zero burden in Nebraska and South Dakota and almost zero in Kansas.

Image

The nationwide burden of OPEB is now over $1 trillion according to the report.

Here are some highlights (lowlights would be a better term) from ALEC.

Other post-employment benefits (OPEB), also known as the “trillion-dollar acronym,” covers all the benefits a retired public employee is eligible to receive in retirement that are not a pension. These benefits include health insurance, life insurance, Medicare Supplement Insurance, and other benefits.Image …unfunded OPEB liabilities, now totaling over $1.14 trillion, just under $3,500 for every man, woman, and child in the United States. …State OPEB plans face many of the same problems as public sector pension plans. Without real reforms, defined benefit OPEB plans will place a severe burden on taxpayers. By offering a range of defined contribution options as well as implicit subsidies by pooling retirees together with active employees, states can keep the promises made to both public employees and taxpayers.

The solution (both for pensions and OPEB) is for states to shift to systems based on “defined contribution” rather than “defined benefit.”

By definition, DC systems don’t have unfunded liabilities. Here’s a summary of the difference between the two approaches put together by the South Carolina-based Palmetto Promise.

Image

The ALEC report notes that the two states with no unfunded liabilities use the DC approach.

Nebraska and South Dakota are the ideal models for state retiree health plans. Plan structures in both states now require current employees and retirees to purchase an HSA, where employees and retirees make tax-free contributions and the states match contributions up to a certain amount as well.

The report also praises Iowa, Indiana, and North Carolina for reforms moving in the right direction.

I’ll conclude by warning that columns about state and local unfunded liabilities may not be overly exciting, but there are big implications. At some point, reckless states such as Illinois and New Jersey are going to suffer a fiscal crisis and some politicians in Washington are going to want to provide bailouts.

That would be horrible policy, rewarding irresponsibility by profligate states.

Read Full Post »

The ideal pension system for workers is defined-contribution accounts – such as IRAs or 401(k)s – which is why it is so encouraging that many nations have moved in that direction.

One advantage of that approach is that, by definition, there are no unfunded liabilities with “DC” accounts. Your retirement income is based on how much money you save and how wisely the money is invested.

Many state and local bureaucrats, however, have defined-benefit pension systems. These “DB” systems are prone to systemic risk because politicians can promise lots of future benefits without setting aside the money to finance those goodies.

And that is a common problem, as shown by this map from the Tax Foundation based on 2019 data. No state at that time had a fully-funded system (based on how much money is set aside compared to have much pension benefits that have been promised).

Dark blue states are at least close to being fully funded. The worst states are red, followed by pink and purple.

Image

It’s no surprise to see that Illinois and New Jersey are the worst of the worst for unfunded liabilities.

Some readers may be surprised, though, to see that Kentucky and Indiana have a significant problem.

One thing this map does not do, however, is to measure the overall fiscal burden of unfunded liabilities. And that matters since it might be better for taxpayers to be in a state with a larger share of unfunded liabilities but a less extravagant pension system (I’d rather owe someone 50% of $10 instead of 10% of $100).

So here’s a visual from the folks at Reason showing per-capita net pension liabilities as of 2022. On this basis, Illinois is the worst of the worst, followed by Connecticut and New Jersey.

Kentucky also is very bad, though Indiana doesn’t look nearly as bad when using this measure.

It’s also important to consider a state’s ability to finance it’s unfunded liabilities. For instance, per-capita income in New Jersey is higher than it is in Kentucky, so the relative fiscal burden in Kentucky may be higher.

Image

The good news is that the vast majority of states have relatively low unfunded liabilities – less than $2,000 per resident. It’s also good news that some states now have fully funded pensions, meaning more money is now set aside than is owed (largely because the stock market has increased in value since the Tax Foundation put together a map based on 2019 data).

That good news can quickly become bad news, though, if there is a recession and the stock market declines. Which is why DC systems are better than DB systems from the perspective of taxpayers.

P.S. Back in 2018, I conducted a poll asking readers which state would be the first to go bankrupt. Based on the data in today’s column, readers may have been wrong to vote California as the second-most likely state to go belly up. Though pension liabilities are not the only reason a state might go bankrupt. Perhaps readers think the exodus of businesses and taxpayers is going to saddle California with too many takers and not enough makers.

Read Full Post »

During Trump’s first term, he was a big spender. He even wound up increasing domestic spending at a faster rate than Barack Obama.

What can we expect in a second term?

A week after the election, as part of my “Second Edition of Trump” series, I speculated whether he might do a better job and was not overly optimistic.

Well, he’s not even president yet and we already have a very worrisome sign.

But before telling you what is worrisome, let me share two pieces of background information.

First, state and local government bureaucrats enjoy much higher levels of compensation than workers in the productive sector of the economy.

I’ve documented the difference in the past, but here’s a chart based on the latest numbers. And notice that the biggest advantage for state and local bureaucrats is their benefits.

Image

Regarding their benefits, some state and local bureaucrats are exempt from participating in Social Security because they get very generous pensions from their government jobs.

That’s the first bit of background info. The second bit of background info is that America’s Social Security system faces a giant long-run shortfall.

Failure to address the problem will mean either massive tax increases, big benefits cuts, or ever-larger levels of red ink.

Now let’s connect the dots regarding Trump and these two bits of background information.

Both the House and the Senate are pushing to expand an already-bankrupt Social Security program by giving extra money to retired state and local bureaucrats.

I’m not joking. Here are some excerpts from a column by Andrew Biggs of the American Enterprise Institute.

The United States Senate is approaching a vote on the so-called “Social Security Fairness Act,” legislation that would eliminate adjustments to Social Security benefits for a select of public sector employees who are not covered by Social Security but instead participate in alternate government pension systems… The Social Security Fairness Act overwhelmingly passed the House in early December and on December 18 cleared a key Senate procedural vote by 73 to 27. …half a century ago, Congress realized that Social Security benefit windfalls for public sector employees were costly, unnecessary and unmerited.Image And so in 1983 Congress established a Social Security benefit rule called the Government Pension Offset (GPO). The GPO reduces the Social Security spousal supplement paid to a retiree with a non-covered pension by two thirds of the pension’s amount. …the Social Security Fairness Act would repeal the Government Pension Offset and restore the full quarter-million dollar lifetime windfall… It is one thing for Congressional Democrats to vote to repeal the Government Pension Offset. Public sector employees are core supporters of the Democratic Party and such transactional politics, while wrong, aren’t exactly unexpected. But for Republicans to restore potentially massive Social Security windfalls to retired public employees who may not have paid a penny into Social Security and who already have high-quality government pension plans, at the cost of nearly $200 billion over 10 years…, fund is a travesty of both fairness and fiscal conservatism.

Eric Boehm of Reason has a similarly hostile assessment. Here are some excerpts from his article.

The Senate is reportedly set to vote on a bill boosting Social Security payouts to public sector workers who receive pensions and did not pay taxes to support Social Security while working in the public sector… If it passes, the proposal will cost nearly $200 billion…Image That’s because this change will obligate the payment of more Social Security benefits to people who are not paying into the system. …Maya MacGuineas, president of the Committee for a Responsible Federal Budget, said in a press release. “…it just restores windfalls for folks who have other government pensions. What an incredulous set of events.” …In short: By allowing public workers to double-dip into retirement benefits they did not contribute towards, this bill will make everyone who did pay for Social Security worse off.

Last but not least, here are some passages from the Wall Street Journal‘s editorial on the topic.

Republicans claim to want to reduce the budget deficit, but then why are they joining Democrats in raiding Social Security for nearly $200 billion in extra benefits for government workers? The House last month passed the misnamed Social Security Fairness Act, 327-75. ImageSenate Majority Leader Chuck Schumer vowed at a rally with union leaders last week to hold a vote on the bill this week. …What’s unfair is rewarding high-paid government workers with larger Social Security benefits than they earned. That’s essentially what the bill would do. …Many state and local government employees who receive pensions don’t pay into Social Security. Instead they earn pensions that are far more generous than the average Social Security benefit. …We know Republicans are phonies on spending restraint, but handing a huge victory to unions like the teachers and Afscme that back Democrats takes a special kind of political masochism. Please spare us any future whining about debt and deficits.

At this point, you’re hopefully thinking this is very bad policy. But you may also be wondering what this has to do with Trump.

The connection with Trump is that he has – or at least had – the power to stop this massive giveaway. All he had to do is say this is a ridiculous waste of money that enriches an already over-compensated group of bureaucrats and Republicans in the Senate almost surely would have voted no.

Instead, Trump said nothing and these 24 Republicans – including the soon-to-be Vice President! – voted to make America more like Europe.

Image

By the way, House Republicans also behaved recklessly, with an even-greater percentage of them voting for this giveaway.

Image

Trump also could have told them to vote no and they presumably would have obeyed.

The bottom line is that America’s grim fiscal outlook got worse during Trump’s first term and this latest episode of fiscal profligacy suggests it will also get worse during his second term.

Wouldn’t it be nice if we could trade presidents with Argentina? And it also would be nice to trade the current crop of Republicans on Capitol Hill for the Tea Party Republicans who actually cared about the country’s future?

Read Full Post »

While there are plenty of reasons to be depressed about public policy (particularly the growing burden of government spending), there are a few reasons to feel optimistic.

  1. Argentina’s libertarian revolution.
  2. School choice revolution in the states.
  3. Tax cutting revolution in the states.

Today, let’s focus on the third item.

Back in 2018, I created a ranking of states based on tax policy, Imagewith the best having no income taxes and the worst having high-rate, class-warfare tax regimes.

Back then (just six years ago), about 60 percent of states were in the worst two categories.

Now it’s less than 50 percent.

And, thanks to Louisiana, there’s even more progress. The Pelican State has joined the flat tax club. Here are some excerpts from a report in the Louisiana Illuminator by Julie O’Donoghue and Wesley Muller. 

Gov. Jeff Landry scored one of the biggest victories of his political career Friday when he managed to push major corporate and personal income tax cuts through the Louisiana Legislature… A flat rate of 3% will replace all three personal income tax brackets that top out at a high rate of 4.25%. ImageThe current sales tax rate of 4.45% will move to 5% for five years, and then lower to 4.75% in 2030. A state corporate franchise tax has been eliminated, and the corporate income tax rate – which now tops out at 7.5% – has been moved to a flat rate of 5.5%. …“We’re more competitive now. We’ve lowered our rates to stay in line with our Southeastern neighboring states, and we’re just excited with hopefully bringing our people home and bringing more business to this state,” Rep. Julie Emerson, R-Carencro, who carried the bulk of the bills for Landry’s tax package.

To see the improvements, here’s an updated version of state tax rankings.

The big change is the number of flat tax jurisdictions. There are now a dozen flat tax states, a big jump from 2018 (and since the flat taxes in Kentucky, North Carolina, and Utah were enacted relatively recently, the 20-year shift is even more impressive).

Image

P.S. In the long run, it’s impossible to have good tax policy without spending restraint. Colorado, Iowa, and North Carolina are role models in this regard. Sadly, Louisiana did not impose a spending cap to accompany tax reform.

P.P.S. While there has been progress in many states, Massachusetts voters made a terrible choice in 2022 and moved their state from the flat tax column to the class-warfare column.

Read Full Post »

Donald Trump was a big spender during his first term in office. Even if you don’t count the orgy of pandemic-related spending, he spent more and spent faster than Barack Obama.

He even increased domestic spending faster than Obama!

But maybe his second term will be different. One positive sign is that Elon Musk and Vivek Ramaswamy are spearheading a Department of Government Efficiency (DOGE), which is a private effort to identify ways of saving money and streamlining government. Image

In a triumph of hope over experience, let’s make some suggestions for DOGE.

We’ll start with fiscal federalism.

Under current law, politicians in Washington send hundreds of billions of dollars every year to state and local governments. Every single penny of this spending is in areas where the federal government should have no involvement.

As part of a federalism agenda, it is time to eliminate all these transfers.

The savings for taxpayers could be enormous. Here’s a list of federal handouts compiled by my former colleague, Chris Edwards.

Nearly $1.3 trillion last year!

Image

Most of these grants can and should be immediately eliminated.

In a few cases (such as Medicaid reform), the changes would take several years.

In all cases, however, the ultimate goal should be to get Washington out of the business of subsidizing activities that should be solely the responsibility of state and local government (or, in most cases, activities that should be left entirely to the private sector).

For further background on this topic, here are some excerpts from a column in the Wall Street Journal by John Cogan of Stanford University’s Hoover Institution.

Excessive spending has been a way of life for lawmakers in Washington for more than half a century. …Elon Musk and Vivek Ramaswamy’s Department of Government Efficiency will attempt to put an end to this fiscal profligacy. Both men will soon discover that the root cause of this problem lies with the federal government’s abandonment of federalism in fiscal matters. …It is difficult to think of a single activity that state and local governments spend money on that isn’t also financed by Washington’s check-writing machine.Image The feds spend on local roads, social services, police and fire protection and education. Washington also appropriates funds for building and maintaining municipal parks and playgrounds, bike paths and hiking trails, city sidewalks, bus stops, railroad crossings, traffic signs and stop lights, and beautification projects. …The Founders believed that, among its benefits, federalism would serve as an effective constraint on federal spending… Fiscal federalism started to erode more seriously around World War I. …Policymakers finally abandoned fiscal federalism during the Great Depression. …Following World War II, and especially during the peak years of the Great Society (1965-74), the federal government greatly expanded its spending on activities that were traditionally regarded as state and local affairs. …The federal government needs to…return…state and local affairs to their proper place. Sorting out which programs should go first could be a natural starting point for Messrs. Musk and Ramaswamy.

Very good suggestions (just like Cogan has provided good analysis and good advice on entitlement programs).

P.S. As a general rule, DOGE should be bold. Here’s some of what I wrote when giving Trump’s people advice on inauguration day in 2017.

…don’t cut programs by 10 percent, 20 percent, or even 50 percent. If you do that, it’s like cutting off a weed at ground level. If the root system is still there, it’s just a matter of time before it regrows and begins to suffocate the good plants (i.e., the private sector). Instead, shut them down. Eliminate them. Raze the buildings. And pour a foot of salt on the ground so nothing can regrow. Simply stated, it’s very easy to restore a budget cut at some point in the future. But if a part of government is totally wiped out, then special interests have to go through all the effort of recreating that function. And that’s not overly easy given the separation-of-powers system that the Founding Fathers wisely created.

To elaborate, special interests are going to squawk and complain even if Trump merely proposes to freeze spending. So why not actually go bold and actually solve some problems?

P.P.S. Every suggestion I make to DOGE over the next few weeks will be accompanied by a recommendation to enact a spending cap, much like the very successfuldebt brake” in Switzerland.

Read Full Post »

I’m a big fan of tax competition. I cheer when jobs, investment, and people (or even booze) move from high-tax jurisdictions to low-tax jurisdictions.

This increases the rewards for good policy and also increases the punishment for bad policy.

Given my interest in the topic, I obviously can’t resist sharing this chart, which shows the states benefiting from an influx of successful young people.

Image

I want to emphasize two things about this data.

First, you’ll notice that eight of these states either have no income tax (Florida, Texas, Washington, Tennessee, and Nevada) or a flat tax (Colorado, North Carolina, and Arizona).

Second, it goes without saying (but I’ll say it anyhow) that states should be anxious to attract successful young people. These are households that are unlikely to be mooching off the government. Instead, they’ll be the geese laying the golden eggs.

So it makes no sense to impose policies that cause them to fly away.

Speaking of which, the above chart comes from a report by smartasset.com. Here’s an excerpt summarizing some highlights and also identifying the states that are driving away successful young people.

Many affluent young people often relocate for better jobs, lifestyle upgrades and tax advantages… With this in mind, SmartAsset used IRS data to rank states by the net inflow of young and rich households – those earning at least $200,000 per year and aged 26 to 35.Image …Florida and Texas attract more than double the young and rich households as any other state. …Half of states attracting the most young and rich households don’t charge state income tax. …California lost over 3,000 young and rich households. …Illinois lost second-most studywide with an emigration of 1,323 households. The outflow was worth approximately $5.1 billion in taxes. Massachusetts lost a net of 1,102, and New York ranked fourth-lowest with a net loss of 345 households.

For what it’s worth, it might also make sense to show the data after adjusting for state population. That presumably would boost the ranking of states such as Colorado and Nevada and hurt the ranking of places such as Massachusetts (a state that almost surely will suffer more out-migration).

But however you slice the date, the results will always be the same. As noted in my five-part series (here, hereherehere, and here), people of all ages are escaping blue states.

P.S. I’m assuming that New Jersey is a top-10 state merely because of young people escaping New York (unless, of course, some of them got lost trying to find the good Jersey).

P.P.S. The state of Washington arguably is in danger of getting kicked out of the no-income-tax club since politicians have imposed a capital gains tax notwithstanding disapproval by voters.

Read Full Post »

Massachusetts used to have a flat tax, but I warned back in 2019 that it was in danger. Sadly, my fears were warranted.

In 2022, the state’s misguided voters approved a referendum to replace the flat tax with a system based on class warfare (a choice that made my list for the “worst news of 2022“).

But if those voters are fans of the New England Patriots, they cut off their noses to spite their faces.

Is this just idle speculation by a couple of guys who don’t know what they’re talking about?

ImageHardly. According to academic research, football teams in high-tax states are at a disadvantage. On average, they lose two more games per season that teams in low-tax states.

And we see similar evidence that taxes have an impact when looking at other sports such as baseball, track, golf, boxing, auto racing, soccer, and basketball.

Sticking to football, the Wall Street Journal opined on the issue last week. Here are some excerpts.

For the latest evidence that state tax policy influences taxpayer decisions, take a look at the National Football League. …states with millionaire surtaxes like Massachusetts are at a disadvantage in attracting the best free-agent players. …It’s “just another thing you’ve got to contend with in negotiations up there,” Mr. Belichick added. Image“It’s not like Tennessee or Florida or Nevada or some of these teams that have no state income tax.” …Massachusetts used to have a 5% flat tax on all incomes above $8,000. But in 2022 the state imposed a four percentage point surtax on incomes over $1 million. …A player making $50 million would pay $4,968,457 playing for Minnesota Gov. Tim Walz’s home-state Vikings compared to $586,902 on that same contract at the Dallas Cowboys. …Those are eye-watering numbers, but the same tax calculations exist for all taxpayers. High-income earners have more flexibility than most to relocate. Democrats who think surtaxes on the affluent make good policy might reconsider that line of scrimmage.

Since I’m a fan of the New York Yankees, I’m not happy.

New York has a terrible state tax system, so that makes it harder for my Yankees to reclaim their rightful spot as world champions.

But this isn’t about my personal preferences. It’s simply more evidence that high tax rates are bad news. Bad news for pro athletes. But also bad news for entrepreneurs, investors, and small business owners.

The good news is that many of those people have the ability to escape. The bad news is that the rest of us don’t have the same flexibility to move across borders.

Always remember that ordinary people suffer when politicians target the rich.

Read Full Post »

In 2022, I wrote a two-part series (here and here) about fiscal decay in Illinois.

I’m motivated to add Part III today because of this chart from Chris Edwards, which shows how many upper-income taxpayers are moving into a state compared to how many are escaping.

As you can see, the worst-ranked state is Illinois.

Image

This data matters because these are the kinds of taxpayers that are the big net payers.

They also are very mobile. If they feel they are mistreated by their state governments, they have the ability to migrate. And it’s no surprise to see that high-tax jurisdictions are suffering the biggest outflows.

At the risk of understatement, it is a very bad indicator to be near the bottom. And the state at the bottom must be a basket case.

If you want to understand why Illinois is in last place, check out these excerpts from George Will’s latest column in the Washington Post.

Formerly the Land of Lincoln, now the Land of Blue State Governance Blues, Illinois…population has declined for 10 consecutive years. …Since 2000, more than 1.5 million have fled, costing an estimated $3.6 billion in income tax revenue in 2022 alone, a year the net loss of 87,000 residents subtracted $9.8 billion in adjusted gross income.Image In the past six years, $47.5 billion AGI has left. …Fewer Illinoisans are employed than when Democrat J.B. Pritzker became governor in 2019. The state’s 5 percent unemployment rate is the nation’s third-worst; its Black unemployment rate is second-worst. …Last year, more than 140,000 government workers and retirees in Illinois received more than $100,000 in salaries or pensions. …its unfunded state pensions liability has, according to the state, grown under Pritzker from $137 billion to $142 billion. …according to Moody’s, state pension debt is nearly $300 billion, and state and local shortfalls reached $530 billion four years ago.

By the way, it’s not just horrible fiscal policy.

You can make a strong argument that Illinois is even worse when it comes to education policy.

Under billionaire Pritzker, who sends his children to private schools…, Illinois this year became the first state ever to retreat from school choice (18 have created or expanded choice programs since 2023), killing, to please teachers unions, a small tax-credit scholarship program that served mostly poor and minority pupils. …although Illinois spends almost $24,000 per pupil (up 97 percent since 2007), only 35 percent of pupils read at grade level (1.2 million do not) and only 27 percent are proficient in math (1.4 million are not). In Decatur, 7 percent can read at grade level; in Peoria, 15 percent. In 67 schools, no child recently tested proficient in math; in 37, none were proficient in reading. Yet officials celebrate the state’s high (87.6 percent) graduation rate. …school administrators (18 superintendents made more than $300,000 in 2022) have increased 70 percent since 1998 while enrollments have declined about 100,000.

You may be wondering why Illinois lawmakers tolerate such results. Well, it all makes sense when you consider the 1st Theorem of Government.

P.S. No wonder Illinois has a big lead in the poll asking people to predict the state that will be the first to go bankrupt (and when that happens, it will be critical to stop politicians in DC from providing a bailout).

Read Full Post »

When I write about regulation, it’s usually to highlight how red tape is causing bad outcomes in specific sectors (banking, child care, dentistry, credit cards, the Internet, etc).

But I’m a big fan of jurisdictional competition as a way of limiting bad policy, so I also like when states or countries are ranked on the quality of their policies.

With this in mind, I was very interested to see that Patrick McLaughlin and Dustin Chambers have a new report from the Mercatus Center that assesses states based on the the number of regulatory restrictions.

Here’s a map showing the states with the most red tape (dark green) and least red tape (light green).

Image

Here’s how the authors categorize their research.

Mercatus research indicates that regulatory accumulation worsens economic conditions, inadvertently increasing poverty rates, destroying jobs, and raising prices.Image The path to reversing these trends is clear: Improve regulations by reducing their number. Our State RegData project has produced “snapshots” of state regulations that can help policymakers engage in that process. …Our analysis makes it abundantly clear that the states that have proactively tried to cut red tape have begun to see positive results. Interestingly, those same states that have been able to cut red tape have also enjoyed higher average annual economic growth rates.

Many of the results are not a surprise. For instance, California is the nation’s worst state for red tape, followed by New York and New Jersey. And I’m not surprised to see that Idaho and the Dakotas are the most laissez-faire states.

But who would have guessed that Texas is the 5th-worst state in the nation?

Image

By the way, traditionally red Ohio is the 6th-worst state and deep-blue Vermont is the 11th-best state, so there are a few other surprises.

P.S. If you want to see how states rank for overall economic policy, I recommend Economic Freedom of North America and Freedom in the 50 States.

Read Full Post »

Writing about Mitt Romney’s selection of Paul Ryan in 2012, I opined that, “…it probably means nothing. I don’t think there’s been an election in my lifetime that was impacted by the second person on a presidential ticket.”

I feel the same way about Tim Walz, who is Kamala Harris’ pick for Vice President.

But since several readers have asked me my opinion on the Minnesota governor,Image I’ll give my two cents.

The first thing to understand is that Minnesota has bad tax policy. It is one of only nine states receiving the lowest-possible grade in my tax ranking.

And if there was a an even-worse category, Minnesota might be eligible, particularly since Gov. Walz pushed through more class-warfare tax policy last year.

No wonder he received a failing grade from Chris Edwards’ Fiscal Policy Report Card on America’s Governors (one of only eight governors to “earn” an F).

Other experts also have not been impressed. Jared Walczak of the Tax Foundation has an assessment of Governor Walz’s tax policy. Here are some highlights, though lowlights may be a better description.

Most states have cut taxes at least once since 2021… Twenty-eight states have cut individual income tax rates, fifteen states have cut corporate income tax rates… Under Gov. Tim Walz (DFL), Minnesota has been an outlier, one of the few states to raise taxes in recent years… ImageUnder Walz, Minnesota became the only state to impose a surtax on the long-term capital gain income and other net investment income of high earners (all other states tax long-term capital gains at ordinary income tax rates or even preferential rates). Walz also signed legislation partially phasing out the benefit of standard and itemized deductions for high earners… Minnesota has doubled down on its status as a high-tax state even as most states have moved in a different direction. That may go some way toward explaining the state’s lackluster economic performance of late: in the past year, employment only grew by 0.7 percent in Minnesota, ranking 42nd nationwide. Net outmigration to other states is 6th highest for households with $200,000 or more in income, and 8th highest in terms of net outflow of income from all households.

Meanwhile, the Wall Street Journal has a disapproving editorial on Walz’s tax policies.

Private industries have lost jobs, including finance, information, professional and business services, retail, manufacturing and leisure and hospitality. …Manufacturing employment has declined by 7,500 over the past 12 months, while professional and business services have shed 22,700 jobs. ImageThis is especially notable since Mr. Walz last spring signed a giant tax increase, including a 1% surcharge on investment income over $1 million. …Minnesota’s top rate is 9.85% not counting his one-percentage point surcharge—which sends the rich or retired out of state. Households with roughly $5 billion in adjusted gross income left Minnesota between 2019 and 2022, according to the most recent IRS data. Minnesota in 2022 ranked eighth in income loss among states as a share of overall AGI… Top destinations for Minnesota refugees include zero-income tax Florida, Texas and South Dakota. South Dakota’s rate of job growth has been more than four times higher than Minnesota’s since Mr. Walz took the helm.

All of this analysis is confirmed by data on migration and changes in taxable income.

Simply stated, Walz is driving productive people (and their money!) out of the state.

Which brings me to the second thing that readers should understand.

Walz is a big spender. Here’s some data from the National Association of State Budget Officers’ most-recent State Expenditure Report.

The burden of government spending has been expanding by average of nearly 12 percent annually in Minnesota. I also included Colorado, which has a liberal governor. But it also has a spending cap, so the budgetary burden has only climbed by an average of about 1.2 percent annually.

Image

The bottom line is that Walz has a terrible track record, but so does Harris, so they are a good match.

Read Full Post »

The fundamental insight of supply-side economics is that people respond to incentives. So if the government imposes a high tax rate on income, people will try to avoid or evade the money grab.

Especially if they have any ability to control the timing, level, and composition of their income.

Star athletes are definitely in this group.

We can add Grant Williams to that list, as reported last year from Boston.

Testing the market worked out for Williams, who will now make more money while living in Texas, which does not have state income tax. Williams reportedly turned down a four-year, $48 million over offer from the Celtics last season.Image Williams mentioned Massachusetts’ Millionaire’s Tax as one of the factors he was mindful of when considering the Celtics’ offers. The Millionaire’s Tax is a four percent tax on top of Massachusetts’ five percent income tax, which raises the tax rate to nine percent for millionaires.“I was thankful just because I feel like the way my agent and everybody talked about it was that this was our floor,” Williams said. “In Boston, it’s really like $48 million with the millionaire’s tax, so $54 million in Dallas is really like $58 million in Boston and $63 million in L.A. “It was a little strategic on that end,” Williams continued.

This is hardly an unusual step.

In a column for Forbes, Patrick Gleason tells the story of a player who decided to leave a New York team for a Florida team.

Buffalo Bills’ Jordan Poyer…spent six years with the Bills, said state income tax rates were factoring into his thinking as a free agent at the beginning of 2023. “A lot of people ask me, ‘if it wasn’t Buffalo, then where would you go?’” Poyer said on a February episode of his podcast. “I kind of ponder the question every once in a while,” Poyer went on to say, Imageadding that he “would love to go to a state that doesn’t take half my money.” The median top marginal state income tax rate among all 50 states is 5.0%, down from 6.0% in 2010. While income tax rates have come down in many states over the past decade, they’ve risen in New York. New York state now assesses a top income tax rate of 10.9%, the second highest top marginal income tax rate in the nation. The overall average state and local tax burden in New York is 15.9%, the highest in the nation. …Poyer went on to lament how in some states tax collectors “take half of your check away,” which leaves him and others wondering “what are they doing with that money?”

Since he now plays for the Miami Dolphins, at least he can enjoy being in a state with no income tax.

If star athletes don’t like playing for teams in high-tax states, this raises the question of whether some franchises have a harder time winning.

According to some research on the National Hockey League, the answer is yes.

Here are some excerpts from an AP story by Stephen Whyno.

When the Tampa Bay Lightning made moves at the NHL draft to clear salary cap space, general manager Julien BriseBois…pointed out…the “favorable taxation situation.” It has become difficult to deny the impact of favorable tax situations around the league in recent years. Four of the past five Stanley Cup champions are based in places with no state income tax,Image and that benefit continues to draw free agents who know they will take home more money there than elsewhere around North America. …The $69 million contract Sam Reinhart got to re-sign with the reigning champion Florida Panthers is worth more there than it would have been had he signed for the same terms in many other markets. …He would pay $1.1 million more in California, $1.5 million more in New York and $1.4 million more in Toronto, according to a calculator provided publicly by Cardinal Point Athlete Advisors. Over the length of the contract that could save him up to $12 million. …the New York Rangers or Islanders would need to offer a contract exceeding $88 million to net the same amount as Reinhart’s $69 million contract with the Panthers.

The bottom line is that taxes matter for teams and team performance (even in France).

And taxes matter for players (just like they matter for entrepreneursinventors, and scientists).

P.S. On the topic of athletes and taxes, Evan Mathis deserves honorary mention.

P.P.S. And Cam Newton deserves heartfelt sympathy.

P.P.P.S. I’m very supportive of athletes trying to keep the money they earn, but I’m very hostile when sports franchises want government handouts.

Read Full Post »

Most people don’t appreciate the importance of trend lines in public policy.

The same principle is true in migration. If a state attracts more people than its neighbors, it’s population (and political influence) will expand.

And if a state happens to attract high-income people, the economic benefits will be disproportionately large.

And this is what’s been happening in the United States. Over time, successful people are escaping high-tax states and moving to low-tax states.

When these people move, their income moves with them. And this chart shows that the cumulative impact can be very large.

Image

Notice, by the way, that most of the states gaining taxable income (all but South Carolina) don’t have state income taxes.

By contrast, the states losing taxable income consistently rank very low when measuring fiscal policy.

The chart comes from the Wall Street Journal, which opined about this trend based on some new IRS data.

The pandemic lockdowns accelerated flight from Democratic-run states with onerous taxes and a high cost of living. The latest data from the Internal Revenue Service shows that the exodus has continued after life got back to quasi-normal.Image …California ranked, again, as the biggest income loser ($23.8 billion) in 2022, followed by New York ($14.2 billion), Illinois ($9.8 billion), New Jersey ($5.3 billion) and Massachusetts ($3.9 billion). The top gainers were Florida ($36 billion), Texas ($10.1 billion), South Carolina ($4.8 billion), Tennessee ($4.7 billion) and North Carolina ($4.6 billion). …the flight from progressive states far surpassed pre-pandemic levels. California lost nearly three times as much income in 2022 to other states as it did in 2019. New Jersey’s net income loss hit a record in 2022… If Americans living in incorrigibly progressive states want change, they will have to vote with their feet and wallets.

What’s the moral of the story?

The geese with the golden eggs can fly away when they’re mistreated.

And that’s very bad news for certain states. It may even be a recipe for eventual bankruptcy.

Read Full Post »

Colorado has the best fiscal rule in the United States. The Taxpayer Bill of  Rights (TABOR) limits state government spending so that it cannot grow faster than inflation plus population.

ImageDoes Colorado’s spending cap work perfectly? Of course not.

Politicians in the Centennial State have spent decades coming up with ways evade and avoid TABOR’s restrictions.

But let’s not make the perfect the enemy of the good.

A study published last year shows that TABOR has saved taxpayers $8.2 billion.

And taxpayers in Colorado may soon keep even more of their money according to an article by Brian Eason in the Colorado Sun. Here are the relevant excerpts.

…the budget will be squeezed primarily by two seemingly minor factors. One, U.S. Census estimates now say the state’s population grew by less than the state’s demographer had anticipated. That means the state revenue cap under the Taxpayer’s Bill of Rights, which tracks inflation and population growth, Imagecan only increase by 5.8% this budget year rather than the 6.1% legislative forecasters were expecting. Two, the state is now expected to collect $185 million more in road usage fees and retail delivery charges this year than last, under the legislative staff estimates. Taken together, the two forecast changes mean state lawmakers could have to issue larger than expected TABOR refunds to Coloradans next year, leaving the state with fewer General Fund tax dollars to spend… That would translate to a nearly $400 refund for the average single-filer in 2025 under the current refund formula, which is tiered based on income.

I’m tempted to call this the feel-good story of 2024. Politicians get less money to waste and taxpayers get more of their money returned.

No wonder TABOR is the gold standard for good fiscal policy at the state level. And Switzerland shows that spending caps also are very effective at the national level.

By contrast, there is very little evidence that balanced-budget rules produce good results.

P.S. Perhaps the best evidence for TABOR is that the pro-spending lobbies in Colorado are always trying to trick voters into approving ballot initiatives that would allow more spending. But as we saw in 2013, 2019, and 2023, the voters of left-leaning Colorado keep voting to to maintain their spending cap.

Read Full Post »

The 2020s, at least so far, should be known as the school choice decade. Here are some examples of progress, starting in early 2021.

But if this map from the Education Freedom Alliance is any indication. I’ll be addressing the issue many more times over the next two years.

Image

By the way, this map changed very recently.

That’s because Alabama became the most recent state to adopt choice. Here are some details from a local news outlet.

HB129, called the CHOOSE Act, would create education savings accounts, or ESAs, for families of students to use toward eligible education expenses. The Senate Education Budget committee approved the House version in a hastily rescheduled meeting Tuesday afternoon. The final vote Wednesday was 23-9 and fell along party lines, with Republicans voting yes and Democrats voting no.Image …“It was an honor to work with Governor Ivey and her team to swiftly pass a school choice bill that she declared her number one priority this Session,” Sen. Arthur Orr, R-Decatur, said in a statement after the vote. …“Children are our future, and there is no greater responsibility for lawmakers than ensuring our kids have every resource needed for academic success regardless of their zip code,” Senate President Pro Tempore Greg Reed said. …The first ESAs will be available in the 2025-26 school year and will be limited to eligible students. All students will be eligible for ESAs at the start of the 2027-28 school year. …The parent of a student receiving an ESA must agree to pay the remaining amount of tuition or expenses beyond the $7,000 cap.

Congratulations to Alabama families.

I’ll close with the observation that the great school choice news in recent years has only been possible because the American system still has a decent amount of federalism.

Not as much as we used to have, unfortunately, but still enough that sensible states have the liberty to do good things (bad states, by contrast, will continue to neglect children and instead use their education systems as a way of transferring money to teacher unions).

P.S. One takeaway is that the Department of Education in Washington should be abolished.

Read Full Post »

Older Posts »