Once again, we see New York and California losing while Texas and Florida are winning.
But it’s not just people. Businesses also move, as illustrated by this chart. California and New York have the biggest dark-blue bars, representing out-migration. Florida and Texas, by contrast, are reaping the biggest rewards, as measured by the light-blue bars.
This data should not be a surprise.
But what is remarkable, however, is the source. The chart comes from a report by Tej Parikh for the U.K.-based Financial Times, a publication that normally leans to the left.
Here are some excerpts from his column.
New York and California have long propelled the American economy. But momentum in both coastal powerhouses is fading. …In the past decade, the states have faced an exodus of businesses. California and New York have, by far, the highest net outflow of domestic companies across the US since the start of 2015… New York and California hold the top spots for the number of regulatory restrictions across the US, based on data collated by George Mason University’s Mercatus Center. First-ranked California has more than three times the US average. New York and California boardrooms often complain about onerous permitting rules, licence requirements and reporting standards that raise costs, crimp innovation and slow expansion. Both states have among the highest minimum wage rates, too. A complex web of high taxes makes matters worse. …The loss of businesses and workers puts strain on California and New York’s economic model. …Both states are struggling to balance the books. New York faces an estimated cumulative three-year budget deficit of $34.3bn. California has a projected $18bn shortfall for the new fiscal year. …the continued loss of cornerstone taxpayers isn’t sustainable. In the decade between 2011 and 2021, New York lost $111bn in net adjusted gross income due to interstate migration, and California lost $102bn… As California and New York demonstrate, taxpayers can and do vote with their feet.
Wow. Not only is the FT acknowledging problems for big-government states, it’s also correctly identifying why those states are in trouble.
For instance, the article includes this graph showing that California and New York have the most red tape and rank at the bottom for tax policy.
Even more surprising, the article also includes this chart showing New York and California are among the most profligate states for social welfare spending.
The bottom line is that California and New York are on a downward trajectory.
And while it’s noteworthy that a left-leaning outlet like the Financial Times has the right diagnosis, I’m very doubtful that the politicians in either Sacramento or Albany (the respective state capitals) have the desire or ability to change direction.
So I fear the decline can’t and won’t be reversed.
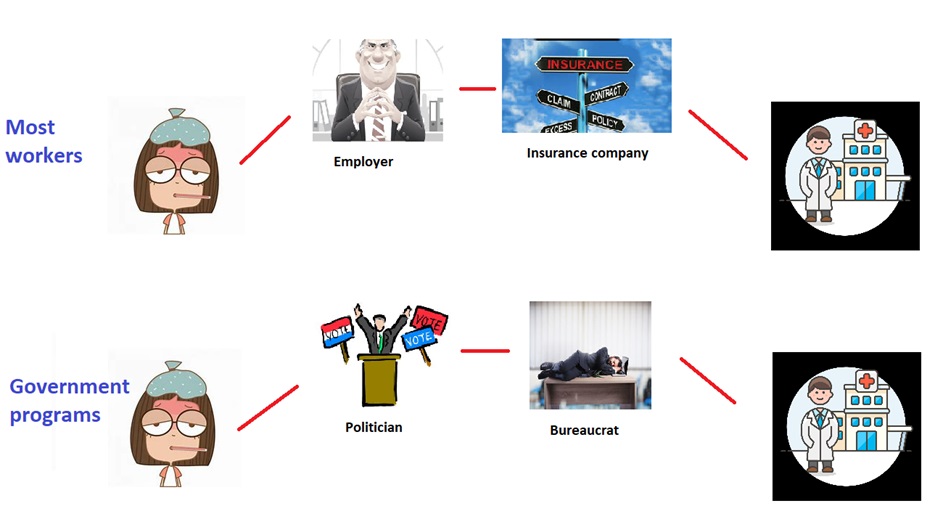
Way back in 2009, I cited a very good article in The American Spectator in hopes of getting people to understand that the United States does not have a capitalist health care system (and I’ve since tried to reinforce that argument, over and over and over again).
Instead of a free market system, we have an inefficient and expensive system that it almost entirely the result of bad government policies.
Medicare, the government health program for old people
Medicaid, the government health program for low-income people
These programs and policies cause “third-party payer,” which is what happens (as explained in this video) when consumers pay for something with other people’s money.
For this sequel column, here’s a visual that further cements the argument. It shows prices rising as the third-party payer problem worsens.
The chart comes from an article in National Affairs by Michael Cannon.
Here’s some of what he wrote.
Many critiques of U.S. health care begin with the assumption that, as The Economist put it, the United States is “one of the only developed countries where health care is mostly left to the free market.” …That assumption gets the situation backward: In truth, among wealthy nations, the United States may have one of the least-free health-care markets. In a free market, government would control 0% of health spending. Yet the Organization for Economic Cooperation and Development (OECD) reports that in the United States, government controls 84% of health spending. In fact, government controls a larger share of health spending in the United States than in 27 out of 38 OECD-member nations, including the United Kingdom (83%) and Canada (73%), each of which has an explicitly socialized health-care system. When it comes to government control of health spending, the United States is closer to communist Cuba (89%) than the average OECD nation (75%). …Direct government price-setting, price floors, and price ceilings determine prices for more than half of U.S. health spending, including virtually all health-insurance premiums. …U.S. health-care prices are excessive because government controls them.
By the way, this is just a small excerpt from an article that is almost 3,800 words. As they say, read the whole thing.
But I will share Michael’s proposed solution. Simply stated, get government out of the way.
Making health care more universal will require policymakers to eliminate regulatory and tax distortions of health-care prices, and to remove government from the business of purchasing health insurance and medical care. The most important step would be to adopt tax and entitlement reforms that let consumers control all $5.6 trillion in U.S. health spending. When 340 million consumers find that they — rather than employers, insurers, or the government — get to keep the savings from price-conscious purchasing, they will spark price competition that will cause prices to plummet and thereby make health care continuously more universal. Insurers and providers will offer consumers what they want — better, more affordable, more secure health care — or go out of business. The government could still redistribute to the elderly, the poor, and the sick. But it would do so as Social Security does: with cash. No more centralized economic planning to drive up health-care prices and reduce health-care quality. The next step would be to eliminate the reams of regulations that block access to lower-cost, higher-quality health insurance and medical care.
Basically, we should want the market for health care to work the way it does for strawberries or laptops.
Like shown by this comparison of free-market simplicity and Obamacare complexity.
As you might expect, I’m partial to this visual I created, which shows how government creates layers between consumer and providers.
It’s another way of depicting the spread between free markets and statism in health policy.
Last but not least, I can’t claim any credit for this meme, but it accurately depicts the way government is responsible for messing up the market for health care.
My lack of specificity isn’t merely because economists are lousy forecasters. I tell people it’s all about investor sentiment, and it’s hard to know when the people and institutions who buy government bonds will suddenly decide that they no longer trust Washington.
The chart comes from a column in the Washington Post by Dominic Pino. He starts by asking why Japan has not suffered a fiscal crisis.
Japan has an aging population, and the government has enormous transfer programs that benefit seniors, increasing strains on the government’s already bloated budget. Sounds familiar. Except, Japan is much further along in that demographic transition than the United States. …Because of that larger senior population, Japan has much higher public debt than the United States, as a share of the economy. The U.S. national debt is around 120 percent of gross domestic product. Japan’s is around 250 percent of GDP, higher than any other developed country. …And yet, Japan’s staggering debt load has not caused a major crisis.
So why hasn’t the you-know-what hit the fan in Japan?
A new paper in the Journal of Economic Perspectives by Yili Chien, Wenxin Du and Hanno Lustig tries to figure out how Japan has managed its massive debt. They find that the Japanese public sector (broadly defined to include national and local governments, the central bank and pension funds) borrows at low interest rates domestically to invest in long positions in risky assets. It’s a jury-rigged sovereign wealth fund. Japan can afford to do this because the Bank of Japan keeps interest rates extremely low, for many years below zero. It can do so in part because there aren’t really price signals in the Japanese public debt market. The Bank of Japan holds over half of Japan’s government bonds. The majority of the remainder is held by Japanese commercial banks and corporations, which are required by law to hold government bonds. …The Japanese strategy is working, if all you mean by “working” is not having a major debt crisis.
But avoiding (or, more accurately, postponing) a debt crisis has been very costly for Japan.
The column explains that the country is now in a very risky position. Any major changes in interest rates of exchange rates could cause a crisis.
But since most people focus on the present, let’s look at some data about relative living standards.
Giving up decades of economic growth in exchange for enormous public-sector asset ownership to prop up an unsustainable entitlement system, as Japan has done, is not an example for America to follow. …Three decades of evidence backs that up. Japan’s real GDP is roughly the same today as it was in 1992. U.S. real GDP has increased by 130 percent in that time. And despite Japan’s declining population, real GDP per capita has risen very slowly compared with the U.S. The U.S. led Japan by about $8,000 in that metric in 1992. Today, the U.S. is roughly $30,000 ahead. …To avoid falling into Japan-style arrangements, the U.S. is going to need to reform its entitlement programs and continue to grow its economy. Japan isn’t a model for how to deal with a debt problem.
Sadly, that won’t happen with Trump in the White house.
I’ll close with a couple of charts to underscore some of the analysis in the column. Here’s a look at per-capita GDP in the U.S. and Japan according to the Maddison database.
You can see rapid convergence for almost 30 years after World War II, followed by slow convergence for the next two decade. But starting about 25 years ago, there’s been a remarkable divergence.
In other words, Dominic is right about Japan falling behind. Indeed, it qualifies for my Anti-Convergence Club.
Last but not least, here’s another very depressing chart about Japan (which makes sense, considering another depressing chart I shared in 2017).
The IMF data show that the burden of government spending is getting worse over time.
And with the country’s grim demographics, we can expect the numbers to get even worse over the next couple of decades.
The bottom line is that Dominic’s headline is correct. Japan is not a role model for America.
Almost exactly two months ago, I cited Bulgaria as an example of a nation that was in trouble because of profligate politicians. And I used IMF data to show how the burden of government spending had dramatically increased over the past few years.
So what do the bureaucrats at the IMF think about Bulgaria’s fiscal situation?
Well, they just released the bureaucracy’s Article IV Consultation, which is basically a periodic assessment of a country’s economic policy.
You probably won’t be surprised to learn that the IMF thinks that higher taxes are the most appropriate answer to an over-spending problem.
Addressing spending pressures from aging, defense, infrastructure, and the energy transition will require fiscal space. Furthermore, as expectations for quality public services grow with income convergence, more revenues are needed to meet rising demands. …Addressing these pressures requires…a sustained increase in revenues—closer to peer levels and commensurate with expected scope and quality of public services. …the revenue-generating capacity of the flat-tax regime appears insufficient to meet increasing demands for quality services. In the medium term, more revenues could be raised by increasing tax rates for both personal and corporate income and moving to progressive income taxation… Pension system…sustainability needs to be strengthened by increasing contribution revenues, with a key measure being removing the cap on insurable income.
The basic message (and the one the IMF also shared in 2022) is that politicians who spent too much should be rewarded with more tax revenue.
Even if it means getting rid of the flat tax. Even if it means busting the cap on payroll taxes (leftists in the U.S. have the same agenda).
The report even included these two charts, which have an implicit premise that Bulgaria should copy the fiscal policies of stagnant, high-tax welfare states elsewhere in Europe.
As your digesting this information, keep in mind that IMF bureaucrats get tax-free salaries.
Maybe, just maybe, they wouldn’t be so quick to recommend awful policies if they actually knew what it was like to pay taxes rather than consume taxes.
But I’m digressing. The good news is that Bulgarian officials don’t want to commit suicide, as noted in the report.
The authorities agreed with many of staff’s recommendations but do not support moving to a progressive tax regime or removing the cap on maximum insurable income.
But the bad news is that these presumably are the same Bulgarians who were in – or involved with – government over the past eight years when the spending burden increased so dramatically.
So while I don’t like the IMF’s knee-jerk support for higher taxes, I’m also not supportive of the current Bulgarian government.
Though I should not that the country got a new Prime Minister back in January, so maybe there will be a conversion to Milei-ism (an approach that is needed in almost every country). I’m not expecting that, but it’s good to hold out some hope.
But even with those strict standards, I think Mr. Dall’Oglio from Italy qualifies for membership.
What has he done that makes him worthy?
In a report for the U.K.-based Telegraph, Nick Squires shares the details about the newest member of the Moocher Hall of Fame.
An unemployed Italian man has been accused of dressing up as his dead mother, complete with lipstick and pearl necklace, to fraudulently claim her pension… The 56-year-old man…managed to pocket thousands of euros before his ruse was exposed… Making the case all the more macabre is the fact that he allegedly concealed his mother’s body at home and kept it for so long that it eventually became mummified. …Not only did her son not officially report her death, he wrapped her body in a bed sheet, stuffed it into a sleeping bag and hid it in his house. He then set out to masquerade as her when it came to renewing her identity card in a government office in the suburb of Borgo Virgilio on the outskirts of Mantua… But his deception eventually raised the suspicions of an employee, who thought there was something a little off – not least his low voice and thick neck. The member of staff alerted the police and the local mayor. …The son had an annual income of €53,000, thanks to his mother’s pension… The man is being investigated for illegally concealing a body and benefit fraud.
This story is somewhat reminiscent of Yvonne Calment, who impersonated her mother in France.
But the big difference is that Mr. Dall’Oglio wanted to get other people’s money while Ms. Calment was merely trying to keep her own money.
P.S. There are also the fictional moochers created by Obama and Biden, but only real people deserve membership.
Two months ago, I wrote a column about Italy’s fiscal deterioration and included a chart showing the country moving in the wrong direction, both in the past few years as well as since the turn of the century.
Let’s now do the same thing, based on IMF data, for Belgium.
We see the same pattern. The burden of government spending is expanding faster than inflation.
Even more troubling, I also show that the government budget is consuming ever-larger shares of the Belgian economy.
The spending increases are not dramatic, but they show how the squeeze on the private sector is continuously worsening. Sort of like an unhealthy person having a pack-a-day smoking habit. That’s better than smoking two or three packs a day, but nonetheless not good news.
It’s also worth noting that government debt is more than 100 percent of GDP.
The good news is that the current Belgian government seems to understand that they have to change direction. After all, the current path sooner or later will lead to a fiscal crisis.
The bad news is that Belgian voters are so addicted to government dependency that there are now nationwide protests.
Here are some excerpts from a report by Hannah Kriwak in the EU Observer.
Belgian unions launched a three-day general strike on Monday (24 November), bringing the country to a near standstill as workers protested against the government’s austerity plan targeting pensions, unemployment benefits, and labor protections. …It was the 13th major strike action since prime minister Bart de Wever’s coalition government took office in February 2025. …The unions are protesting the austerity policies of de Wever, a Flemish nationalist who leads a five-party coalition. Belgium is one of the EU’s most heavily-indebted countries, and the government has proposed welfare cuts to reduce the deficit. …The government argues that people are living longer and should therefore work longer. …Despite three strike days and previous strikes throughout the year, the government has yet to respond to the unions’ demands.
Unfortunately, the article does not provide a lot of details.
The government seemingly wants to move policy in the right direction, but it’s unclear whether the reforms are big, Milei-style changes or just a bit of tinkering.
I did find an article indicating that the government wants to introduce a funded pension system, so that would be progress.
Let’s start Part II with a look at a map showing how much money they are taking with them when they cross national borders.
Needless to say, it is good to be a country that attracts successful people and their money.
And it’s bad to be on the losing end of the equation.
Historically, nations such as China and Russia lose the most rich people, presumably because property rights are not very secure in nations where dictators and their henchmen can arbitrarily seize your wealth.
What’s stunning about the current map, however, is that the United Kingdom is suffering the largest exodus.
Today, let’s dig deeper into why upper-income taxpayers want to escape some democratic nations.
We’ll start with some passages from Matthew Lynn’s column in the Washington Post.
…almost a fifth of last year’s graduates of the École Polytechnique have left France. Likewise, British entrepreneurs are fleeing the country’s rising tax burden by heading for the Gulf, while well-educated Germans are swapping stagnant Munich and Stuttgart for Switzerland. High-tax, big-state Europe is starting to suffer an accelerating brain drain. …With its government in permanent crisis and with one of thehighest tax burdens in the world, it is hardly surprising that many of France’s most talented young people are deciding to make their careers elsewhere. …not exactly a vote of confidence in the country. Wherever they go, these French graduates are likely to have plenty of British for company. As many as 250,000 of them are estimated to be living in Dubai, in the United Arab Emirates, including Alasdair Haynes, founder of Britain’s Aquis stock exchange. More than 1.1 million others have moved to Australia. At a granular level, almost 2,000 U.K.-trained doctors relocated to Australia in 2023, a 67 percent increase on a year earlier. And about a quarter-million Germans are reported to be moving out of the country every year, the largest number of them to Switzerland. …there is a huge opportunity in offering a haven for Europe’s overtaxed, underpaid professional and entrepreneurial classes.
Now let’s take a closer look at people escaping the United Kingdom.
Here are some excerpts from an article by Louis Goss in the U.K.-based Telegraph.
One of Britain’s richest men has quit the UK after three decades as Rachel Reeves prepares a fresh tax raid at her Budget this week. Lakshmi Mittal, the billionaire steel magnate who is worth more than £15bn according to the Sunday Times Rich List, is said to have moved his tax residence from the UK to Switzerland and will spend most of his time in Dubai. The Indian-born tycoon is the latest high-profile entrepreneur to abandon Britain in response to Labour’s tax treatment of the super-rich. …Mr Mittal is also a former Labour donor, having given the party more than £5m when it was under the leadership of Tony Blair and Gordon Brown. He also owns a stake in London football club Queen’s Park Rangers, and his family has donated millions of pounds to good causes. …His departure will be embarrassing for the Government on the eve of the Chancellor’s Budget. …Mr Mittal’s exit is the latest in a string of high-profile departures that have included Nik Storonsky, the founder of Revolut, and Herman Narula, the £2.5bn tech chief executive.
Here’s a visual from the article.
You can see that the outflow started under the big-government Tories and has recently become a torrent.
Needless to say, these escapees will not be paying the tax increases that have been imposed (and will be imposed) by U.K. politicians.
Let’s call that another victory for the Laffer Curve. Though that may not matter since I fear those politicians are not primarily motivated by a desire for more revenue.
Earlier this year, in Part I of this series, I reviewed some research showing that Cuba’s economic misery is almost entirely the result of socialist policies.
The U.S. embargo, by contrast, has had comparatively little effect.
The above chart comes for a new report in the U.K.-based Economist.
Here are some excerpts.
It is hard to fathom how ordinary Cubans nowadays manage to survive. The barest necessities of life cost far more than the official average monthly wage of 6,506 pesos (equivalent to $14.46 at the informal rate, which everyone goes by). Most professionals, such as doctors and teachers, exist on that meagre amount. Lower down the scale, cleaners and museum attendants get 2,500 pesos, worth barely $5. …The UN’s World Food Programme, more accustomed to fending off starvation in Africa, now helps keep Cuban children alive. …According to the Social Rights Observatory, a Spanish-backed think-tank, 89% of Cuban families “live in extreme poverty”; 70% forgo at least one meal a day…only 3% of Cubans can get the medicine they need at pharmacies. …By some calculations, around a quarter of Cuba’s 11.2m people, the last census’s total still cited by officials, have cleared off in the past five years… Much of the professional class has left. Last year the number of family doctors fell by more than half. …The economy is flat on its back. Almost nothing works efficiently. Cuba was once one of the world’s leading sugar exporters; the latest figures show output is now the lowest in over a century, so the country must import it.
Regarding migration, here’s a chart that accompanied the article.
Though it is doesn’t begin to capture the magnitude of the exodus.
As far as I’m concerned, this may be the most damning sentence about socialism: “…around a quarter of Cuba’s 11.2 people…have cleared off in the past five years.”
I’ll close with a comment that applies to both Cuba and Venezuela, which is that our fingers should be crossed that these evil governments get deposed.
If and when that happens, I’m guessing western governments like the United States will want to help with foreign aid.
Next we have a reminder of the incredible progress against inflation.
Last but not least, here’s a look at what’s happened to jobs in Argentina.
I wrote Part II in this series in late July and Part I in early July.
P.S. There’s still no apology or retraction from Thomas Piketty, Gabriel Zucman, and the other left-wing economists who warned that electing Milei would “very harmful for the Argentine economy and the Argentine people.”
Honest leftists (the “Okunites“) generally acknowledge that laissez-faire policies deliver more growth, but they nonetheless favor high taxes and redistribution because they argue that social equality matters a lot.
However, according to this chart, there’s a negative relationship between bigger government and social welfare indicators such as health, education, unemployment, and exclusion.
Looking specifically at labor markets, you see a negative relationship between bigger government and good results.
This holds true even for workers with only a basic level of education.
The two charts come from a new book (available online for free from the London-based Institute of Economic Affairs) by Nina Sanaddaji and Stefan Stefan Fölster.
Here’s how the authors summarize their findings.
A group of low-tax countries has moved to the top in terms of most measures of welfare quality, surpassing high-tax countries such as the Nordics. is is relevant, not least since for a long time the Nordic high-tax models were considered internationally as the best model for welfare delivery. Yet even the Nordic social and economic success was built during periods of low taxes, and stagnated in relative terms after shifting to high taxes. …At the core of this book is a systematic analysis of the available statistical measures that capture the quality of welfare in higher-income countries. …In the overall ranking, Switzerland, Japan and South Korea occupy the top spots. All of these are low-tax coun tries, with a tax burden between 26 and 32 per cent of GDP. By comparison, a high-tax country like Sweden now ranks 12th in terms of overall welfare, …Low taxes are not sufficient on their own to ensure good welfare outcomes.
Given my interests, I especially liked Chapter 7, which investigated the relationship between economic performance and the size of government.
The authors did something I haven’t seen before, which is to measure that relationship by decade.
For what it’s worth, the strongest link was during the 1980s, which may have been caused by both convergence among Asian nations and the pro-growth policies of Thatcher and Reagan.
The relationship was still there, albeit not as strong, in the first decade of this century.
At this point, we’re probably looking at a few examples of anti-convergence.
That’s the good news. The bad news is that average growth rates for everyone are lower, which is almost surely due to the fact that public policy has moved in the wrong direction this century.
As our final tweet shows, Trump does not realize that a majority of goods imported to America are intermediate products used by American manufacturers.
The bottom line is that we shouldn’t be surprised that Trump’s policy has failed. Protectionism didn’t work for Herbert Hoover. It hasn’t worked by any nation.
Let’s start today’s column with this reminder from John Stossel that federal involvement in education has produced bad outcomes and that the Department of Education should be abolished.
The good news is that President Trump does not like that bureaucracy.
After all, we’ve learned over the years that pouring more money into bad K-12 schools doesn’t work. And we’ve also learned that subsidies for higher education simply result in colleges charging higher tuition to finance bureaucratic bloat.
Here’s some more good news. President Trump’s Secretary of Education, Linda McMahon, wants to help shut down her department.
Here are some excerpts from a column of hers in USA Today.
The 43-day shutdown, which came smack in the middle of the fall semester, showed every family how unnecessary the federal education bureaucracy is to their children’s education. Students kept going to class. Teachers continued to get paid. There were no disruptions in sports seasons or bus routes. The shutdown proved an argument that conservatives have been making for 45 years: The U.S. Department of Education is mostly a pass-through for funds that are best managed by the states. …education is best managed by the educators and leaders closest to families, because I have witnessed innovative schools and outstanding educators delivering for students across the country. …Conservatives have wanted to rein in the Department of Education since the day it was created by President Jimmy Carter in 1979 and began operating in 1980. They rightfully feared the federal encroachment on a distinctly states’ rights issue. Fast-forward 45 years, and our students are still paying for this failed experiment – students can’t read proficiently, America’s test scores are behind the world in math and science, and college graduates are drowning in debt.
This sounds great.
But then you read the fine print and discover that the Trump Administration is basically proposing to keep all the spending but shift it to other bureaucracies.
Here are some passages from a report for the Washington Post by Laura Meckler and Danielle Douglas-Gabriel.
The Education Department said Tuesday that it will move several of its offices to other federal departments, a unilateral effortaimed at dismantlingan agency…long derided by conservatives as ineffective. The department has signed interagency agreements to outsource six programs to other agencies, including offices that administer $28 billion in grants to K-12 schools and $3.1 billion for programs that help students finish college. …President Donald Trump campaigned on a promise to shut down the agency, created in 1979, and in March, he signed an executive order seeking its elimination. …Shifting offices to other parts of the government will not by itself remove red tape or alterthe power that Washington exerts over states and school districts. …officials are hoping that the transfers will lay the groundwork for ultimately closing the agency altogether. …The agency has taken other steps to shrink itself, including reducing its staff, which stood at 4,133 at the start of Trump’s term. That number was cut by about half this year through layoffs and incentives to resign or retire.
At the risk of being a contrarian, I don’t think it is progress to move programs from one bureaucracy to another.
That being said, there has been some progress under Trump. While the “interagency agreements to outsource six programs” is merely redrawing the federal flowchart, the part of the Post report that excited me was that the Department of Education bureaucracy “was cut by about half this year.”
And it’s good that Ms. McMahon is undermining her own department, as illustrated by this tweet.
The bottom line is that this is an area where Trump is trying to move policy in the right direction. He’s not doing exactly what I want, but at least the bureaucrats and the teacher unions are on the defensive.
Here’s a map from a report by Youyou Zhou in the Washington Post that supposedly shows the best places to raise children. You’ll notice that blue-leaning states such as Maine, New Jersey, Hawaii, Massachusetts, New York, Minnesota, and Virginia tend to have the highest scores (dark-colored counties are better, light-colored counties are worse).
Meanwhile, red-leaning states such as Louisiana, Arizona, West Virginia, and Montana are at or near the bottom.
This got me slightly suspicious, so I checked the methodology and found that the results are largely because a report on where to raise children is heavily distorted by a variable on where to avoid children.
Here’s the methodology, which is based on some factors that are very appropriate (cost of living, education, and safety), but also includes abortion. Meanwhile, it leaves out some variables that presumably are very important.
I’ve added my commentary in red.
Fortunately, the report is interactive, so you can choose which categories are most important.
And if you simply set the “personal liberties and parental support” variable to zero, the map suddenly looks much different.
Red-leaning states such as Mississippi, South Dakota, Idaho, and Texas suddenly look good and blue-leaning states such as New York, Vermont, California, and Washington score very poorly.
Interestingly, Virginia does very well regardless of whether abortion is included, and North Carolina and Georgia also do well in both maps.
The report, to its credit, does include a graphic showing where people are actually having kids.
Lo and behold, fertility is highest in red-leaning states such as Utah, Texas, and Idaho.
By contrast, Maine (which was supposedly one of the best states based on the report’s dodgy methodology) is the state with the lowest fertility.
Maybe, just maybe, Ms. Zhou should have considered whether the states with the highest fertility might actually be the ones with the best policies?
P.S.While I think the education methodology is reasonable, I wonder what would happen if the results were adjusted for demographics, as captured by this debunking of Paul Krugman.
White students in Texas perform better than white students in Wisconsin, black students in Texas perform better than black students in Wisconsin, Hispanic students in Texas perform better than Hispanic students in Wisconsin. In 18 separate ethnicity-controlled comparisons, the only one where Wisconsin students performed better than their peers in Texas was 4th grade science for Hispanic students (statistically insignificant), and this was reversed by 8th grade. Further, Texas students exceeded the national average for their ethnic cohort in all 18 comparisons; Wisconsinites were below the national average in 8, above average in 8.
Almost surely, red-leaning states would score even better.
P.P.S. Given the way red states economically out-perform blue states (see here, here, here, here, and here), including measures of prosperity other than affordability presumably also would generate different results.
Leaving the European Union would give the United Kingdom more leeway to choose a pro-market, Singapore-on-Thames policy agenda.
The good news is that Point #1 is still completely relevant. In the long run (which may be short run), I fear the European Union will will turn into the Welfare State Transfer Union.
The not-so-good news is that Point #2 is still relevant, but British politicians have moved policy in the wrong direction ever since Brexit. I’m tempted to joke that they are bad at geography and opted for Caracas-on-Thames by mistake.
All things considered, I think Brexit was the right choice, but I’m very disappointed that British politicians have not taken advantage of their nation’s independence from Brussels.
But what if I’m wrong? That heretical thought crossed my mind when I saw these estimates showing that Brexit has produced all sorts of negative outcomes.
The charts all come from a new study published by the National Bureau of Economic Research, authored by Nicholas Bloom, Philip Bunn, Paul Mizen, Pawel Smietanka, and Gregory Thwaites.
Here are the key findings from the abstract.
This paper examines the impact of the UK’s decision to leave the European Union (Brexit) in 2016. Using almost a decade of data since the referendum, we combine simulations based on macro data with estimates derived from micro data collected through our Decision Maker Panel survey. These estimates suggest that by 2025, Brexit had reduced UK GDP by 6% to 8%, with the impact accumulating gradually over time. We estimate that investment was reduced by between 12% and 18%, employment by 3% to 4% and productivity by 3% to 4%. These large negative impacts reflect a combination of elevated uncertainty, reduced demand, diverted management time, and increased misallocation of resources from a protracted Brexit process.
This seems like bad news, and I instinctively agree that “the protracted Brexit process” was not helpful for the U.K. economy.
But what about the study’s main findings? Did Brexit actually reduce GDP, investment, employment, and productivity?
The study is based on data from 33 nations (North America, Japan, and Europe), which is certainly a reasonable approach. But I wondered what the data would show if we just compared the United Kingdom to the other two major European economies?
So I crunched some numbers from the IMF’s big database and found that France, Germany, and the United Kingdom have all suffered from anemic economic performance, with the U.K. being in the middle of the pack.
I then contemplated why these major economies have all averaged less than 1 percent growth over the past 10 years.
And the United Kingdom, for what it’s worth, has been the worst of the worst.
Since I’m a fiscal wonk, I also went to the IMF database to specifically see what has happened to the burden of taxes and spending in Europe’s Big-3 economies.
Interestingly, France has moved slightly in the right direction since 2015 (when you’re at the bottom of the barrel, it’s hard to get worse).
Germany and the United Kingdom, however, have both substantially deteriorated, with Germany being especially bad on spending and the U.K. doing a bad job across the board.
Looking at all this data, and thinking about the results of the aforementioned study, leads me to ask a few questions.
If Brexit was so terrible for the United Kingdom, why have France and Germany endured similar economic weakness?
Is it possible that the weakness of the United Kingdom has been caused by statist domestic policy instead of Brexit?
Why is it better to compare the U.K. to 33 rather different nations rather than the two nations that are most similar?
I’m open to there being good answers to these questions, but suffice the say the study doesn’t provide them.
Since today’s column is a defense of Brexit, I’ll also address an article last year for the Institute of Economic Affairs. Emmanual Comte made a libertarian argument against Brexit.
Here are some of his claims.
Many libertarians supported Brexit, believing it would reduce governmental layers… They saw it as an opportunity to escape the control of Brussels’ technocracy, expecting increased autonomy and economic freedom. …They imagined a country liberated from Brussels… The critique of the EU often portrays it as an overreaching superstate… This interpretation overlooks the true nature and purpose of the EU. Contrary to being an emerging superstate, the EU essentially operates as a collection of regimes designed to check excessive state power. …Membership in the EU involves states mutually restricting their arbitrary power – for example, of limiting international trade or controlling the movement of people. …This approach is evident in the EU’s efforts to curtail excessive state intervention in trade, capital movement, and the flow of people. In monetary matters, the creation of an independent European Central Bank (ECB) following the Maastricht Treaty was aimed at imposing restraint on monetary debasement – a common strategy of overreaching states. …In retrospect, the libertarian argument supporting Brexit appears to have been fundamentally flawed in its understanding of the European Union’s nature and functions.
I agree with Mr. Comte that the European Union has some positive features.
I’m even open to the idea that it is a net plus for poorer nations from Southern and Eastern Europe to join (though it’s definitely not a slam-dunk case).
But as I wrote recently about Iceland, I think richer nations lose by being part of the Brussels-based bureaucracy. Especially if they have a history of being more market-friendly.
P.S. I definitely agree with Mr. Comte’s analysis of the U.K.’s misguided post-Brexit approach to policy.
After Brexit, the United Kingdom’s policy direction did not follow the libertarian ideal of limited state intervention. …Libertarians had hoped for a reduction in state involvement, greater economic freedom, and a move towards decentralised power. However, the reality has been quite different.
Except we’re not going to slap down a leftist. We’re going to smack a Trumpie who thinks like a leftist.
Or, to be fair, we’re going to slap down a Trumpie – the President’s Press Secretary – who felt compelled to issue a bone-headed tweet because she is in the unfortunate position of trying to defend the indefensible.
To be more specific, she cited an article from Breitbart that cited a new economic study stating that protectionism is historically associated with lower levels of inflation.
But there’s an itsy-bitsy, teenie-weenie problem. The study explained that inflation is lower because the economy suffers, as David Bahnsen’s counter-tweet correctly explains.
By the way, here’s a link to the aforementioned study, which was authored by Régis Barnichon and Aayush Singh.
Here’s a brief excerpt.
During the so-called first wave of globalization —the period of increased global economic integration in trade and finance between 1870 and 1913— as well as during the inter-war period, tariff rates displayed large and fast variations that are reminiscent of the 2025 change. We exploit these variations to learn about the macro effects of tariff changes. …tariff shocks appear to act as aggregate demand shocks—moving inflation and unemployment in the same directions. A possible explanation relies on the effects of uncertainty: a tariff shock creates (or coincides with) an uncertain economic environment, which by itself depresses economic activity by lowering consumers’ and investors’ confidence and puts downward pressures on inflation… Another possible channel is a wealth channel, whereby an adverse tariff shock leads to a drop in asset prices, which then depresses aggregate demand and leads to higher unemployment and lower inflation. We find evidence in support of both channels: in response to higher tariffs, stock prices decline and stock market volatility increases.
And here’s a relevant graphic from the study.
If Ms. Leavitt (or the reporter at Breitbart) had bothered to do a minimum level of research, it would have been obvious the study showed that protectionism is a bad idea.
Assuming, of course, we agree that more unemployment and weaker economic performance are not good outcomes.
Once again: Game, set, match.
Not that we should be surprised. A study I cited in 2019 had very similar results.
P.S. The Fed study also confirms what I wrote earlier this year, which is that protectionism causes higher relative prices for goods hit by the trade taxes, but not overall higher inflation. As Milton Friedman taught us, it’s bad monetary policy that causes inflation, not bad trade policy (or bad fiscal policy, or bad regulatory policy).
Time for 2025’s third column of libertarian humor (first two columns available here and here).
We’ll start with some humor from Instagram that mocks libertarians. Not as good as this classic video, but it lands some clever shots (good thing libertarians have self-confidence!).
Next, we have a couple of memes related to the just-ended government shutdown.
Here’s one that looks at shutdowns from the perspective of bureaucrats.
And here’s one that nicely captures my view.
If you like shutdown humor, I shared some material in 2013 (here, here, and here) and 2018 (here).
Since the previous meme expressed my view on shutdowns, our last item – and my favorite one today – summarizes a sensible attitude on the appropriate size of government.
Though I confess I would be more than happy to go back to the fiscal policy of the 1800s, when Washington consumed less than 5 percent of GDP.
Mr. Demos of Pnyx speculated that China would be as backward as India today if the communists has not prevailed in that nation’s civil war about 75 years ago.
To which Mikita responded that Taiwan’s economic success is evidence to the contrary. That’s where the KMT wound up after losing the war and Taiwan is now one of the world’s most-successful economies.
This has motivated me to take a closer look at Taiwan’s economic performance.
Back in 2014, I looked at per-capita GDP from Maddison and asserted that Taiwan is the success story, not China.
Since 11 years have passed, I went to the same database to show updated numbers.
Lo and behold, Taiwan has almost caught up to the United States.
Needless to say, there’s a big gap between having the 7th-highest level of economic liberty and being mired at #108.
I suspect China’s per-capita GDP will struggle to reach $25,000 in the absence of further reform (in other words, caught in the middle-income trap). Taiwan, meanwhile, may very will pass the United States in the near future.
One very admirable feature of Taiwanese economic policy is that the burden of government spending is less than 20 percent of economic output, which is similar to Hong Kong and Singapore.
And it has enjoyed periods of significant spending restraint. I already noted significant spending restraint between 2001 and 2006.
The IMF data shows an even longer period of spending restraint between 2010 and 2019.
Taiwan has slipped a big since 2019, but the burden of spending is still less than 18 percent of GDP, which is very impressive compared to other rich nations.
I’ll close by observing that all the “Asian Tigers” have had reasonably good pro-market policies. Taiwan is simply the least-appreciated member of that club.
I can’t resist when I see online quizzes that purport to identify one’s philosophical leanings or political preferences. Here’s how I’ve been categorized over the years.
Given my willingness to take these little tests, you won’t be surprised that I willingly answered 26 new questions to determine “Your Political Tribe.”
Here are my headline results, with economic issues measured on the horizontal axis and social issues measured on the vertical axis. According to this quiz, I’m “Hard Right” and in the “Conservative Quadrant.”
I’m not surprised I’m about as far to the right as possible in the graph, meaning very strong support for free markets and limited government.
But I was somewhat surprised to see that I’m in the “Conservative” quadrant (top right) instead of the “Libertarian” quadrant (bottom right).
Here’s a more detailed breakdown of my score.
As usual, I did not like how some of the questions were worded.
For instance, Question 3 doesn’t give an option consistent with my 21st Theorem of Government. I wound up picking “somewhat agree with option 2,” but that is not really what I believe.
Likewise, Question 7 was irritating because I don’t want to fund a War on Drugs or to subsidize asset forfeiture, yet I also don’t think more social spending is a good idea.
So, once again, I picked “somewhat agree with option 2” even though that is not my position.
If you’re wondering why I didn’t get a perfect score on economic issues, I suspect it’s because I picked “somewhat agree with option 2” for Question 15.
Why? Because, rather than merely “curb benefits,” I want to fundamentally reform Social Security and Medicare so the programs are structurally sound.
Last but not least, I think Question 19 is a mess.
Or do I pick Option 2, when opinion polls and personal experience reveal that “ordinary people” can be shockingly ill-informed?
Garett Jones makes a persuasive case that I should have picked Option 1, but I think the so-called elite (especially in universities) are wrong on some very important issues. So I was a wimp of picked “not sure” as a response to this question.
Since online quizzes are imperfect, I always recommend people click here and here for the best perspective.
I lied. Back in 2023, I wrote that Part V would be the last segment in my series on blue-to-red tax migration (with Parts I-IV available here, here, here, and here).
But I’ve decided to extend the series because here’s a must-share map showing how some states have lost – or gained – large amounts of taxable income as a result of people “voting with their feet” over a ten-year period.
Notice that the worst states (darker red) are fiscal hellholes such as New York, Illinois, and California.
The map is part of an editorial in the N.Y. Post that bemoans the exodus of taxpayers – and taxable income – from New York and other high-tax states.
…the wonks at the free-market-advocacy group Unleash Prosperity are out with a study that exposes the true depths of flight from high-tax states. It’s not uncommon to look at the one-year losses and gains of income from internal migration such as taxpayers fleeing New York for Florida, but that fails to capture the long-lasting impact: The migrant’s income is lost (or gained) year after year for the rest of his or her life. This new report used Census and IRS data to calculate the cumulative impact; it finds that New York state has lost more than $500 billion in resident income over the past 10 years, while New Jersey has lost $170 billion. Nearly 2 million New Yorkers have moved away this past last decade; New Jersey has lost 500,000 residents to other states. New York has lost the most income of any state — and only California and Illinois have lost more money than New Jersey.
Much of the underlying research comes from the folks at the Committee to Unleash Prosperity.
Including this chart that shows the cumulative loss of adjusted gross income for the Empire State.
What our friends on the left don’t understand (or pretend not to understand) is that a good chunk of that income would still be in New York – and still be taxed in New York – if politicians in Albany weren’t so greedy.
And let’s not forget that New York City politicians also are greedy, a problem that surely will get worse now that a crazy self-professed socialist has been elected as Mayor.
For today’s column, however, I want to focus on how government meddling will hinder the valuable and necessary process of creative destruction. I’ve previously produced a three-part series (here, here, and here) on why it’s important to let new technologies and entrepreneurial discoveries displace existing ones.
Today, I want to specifically explore why it is bad news to prop up zombie companies.
We’ll start by looking at some research by three OECD economist for the Swiss National Bank. Here are the key passages.
This paper explores the extent to which “zombie” firms – defined as old firms that have persistent problems meeting their interest payments – are stifling labour productivity performance. This paper provides evidence that the prevalence of financially weak or “zombie” firms – that increasingly linger as opposed to exit the market – are associated with less efficient resource allocation. We apply the framework from the seminal study of zombie firms in Japan (see Caballero et al., 2008) to a broader sample of OECD countries and show that a higher share of industry capital sunk in zombie firms is associated with lower investment and employment growth of a typical non-zombie firm. Besides limiting the expansion possibilities of healthy incumbent firms, market congestion generated by zombie firms can also exacerbate productivity dispersion, create barriers to entry and constrain the post-entry growth of young firms. Finally, we find that an increase in the capital stock sunk in zombie firms is associated with less productivity-enhancing capital reallocation, measured as the decline in the ability of more productive firms to attract capital.
And here are three charts from the study, beginning with a look at how productivity is lower in zombie firms.
Next we have a chart showing that the presence of zombie firms has a negative effect on jobs and investment in the rest of the economy.
Finally, our third chart shows the potential productivity gains from allowing a reduction in zombie firms.
Let’s also look at a study by two economists for the Bank for International Settlements.
Here are some relevant excerpts.
Zombie firms, meaning firms that are unable to cover debt servicing costs from current profits over an extended period, have recently attracted increasing attention in both academic and policy circles. ..We take an international perspective that covers 14 countries and a much longer period than previous studies. …First, are increases in the incidence of zombie firms just episodic… We find a ratcheting dynamic: the share of zombie companies has trended up over time through upward shifts in the wake of economic downturns that are not fully reversed in subsequent recoveries. …Second, what are the causes of the rise of zombie firms? Previous studies have focused on the role of weak banks that roll over loans to non-viable firms rather than writing them off… A related but less explored factor is the drop in interest rates since the 1980s. The ratcheting-down in the level of interest rates after each cycle has potentially reduced the financial pressure on zombies to restructure or exit… Our results indeed suggest that lower rates tend to push up zombie shares, even after accounting for the impact of other factors. Third, what are the economic consequences of the rise of zombie companies? Previous studies have shown that zombies tend to be less productive… Therefore, the higher share of zombie companies could be weighing on aggregate productivity. Moreover, the survival of zombie firms may crowd out investment in and employment at healthy firms. Our findings confirm these effects for more countries and a longer period.
The bottom line is that zombie firms are not good for long-run economic performance.
Such firms can and will persist in the absence of government intervention.
The problem can become far bigger, however, when politicians get involved. As noted in the video, they focus on the “seen,” meaning businesses, jobs, and factories that currently exist. And they face a “public choice” pressure to protect the status quo.
But they are oblivious to the “unseen,” meaning the greater productivity, innovation (and the accompanying jobs) of new companies and new technologies.
I am very much afraid that Donald Trump now has a big incentive to bail out and prop up the companies where he has made Washington a shareholder. And I’m similarly afraid that a future Democrat president will double down on Trump’s misguided approach.
But let’s not overlook the economic lessons we can learn from other nations in the region.
Today, let’s compare Chile (famous for adopting free markets back in the 1980s) and Venezuela (infamous for shifting to socialism over the past several decades). And we’ll look at three charts to see how this natural experiment turned out.
We’ll start with some data from Economic Freedom of the World. As you can see, it is definitely the case that economic liberty dramatically increased in Chile and dramatically decreased in Venezuela.
Did these shifts in economic policy make a difference?
The answer is a resounding yes. Here’s a map from Michael Arouet, which I’ve already shared, showing that Venezuela was the richest nation in the region in 1980 while Chile lagged far behind.
The map confirms some numbers I shared in 2011, 2016, 2021, and 2023.
But let’s take a different look at the data, courtesy of Oxford University’s Our World in Data.
There are several counties included in this chart, but notice how Chile is the best performer over the past few decades while Venezuela has lagged far behind.
However, I doubt the pro-Venezuelan ideologues like Joseph Stigliz will be offering any apologies (just like I’m not holding my breath waiting for mea culpas from Thomas Piketty, Gabriel Zucman, and the other supposed economists who warned that Javier Milei’s election would lead to disaster).
P.S. Chile has a presidential election next month, followed by a run-off election in December. In 2021, voters made the mistake of electing a hard-core leftist. It will be interesting to see whether “Milei-ism” crosses the Andes Mountains and Chile moves back in a sensible direction.
P.P.S. Venezuela does not have democratic elections, so we have to wait until people overthrow that tyrannical government.
Beyond that, I didn’t have any specifics (which is why I sympathized with Gary Johnson back in 2016). I know that Switzerland and Singapore are very well-governed, but are their current leaders especially admirable? I have no idea.
The reader then shared her list, which included Milei, as well as Trump, Victor Orbán of Hungary and Nayib Bukele of El Salvador.
And I then looked at Economic Freedom of the World to see whether Orbán or Bukele deserved praise.
Lo and behold, economic liberty has dropped during their respective times in office.
I’m not too surprised about Hungary, having pointed out a few years ago that Denmark ranks higher for sensible economic policy.
Yes, Hungary has some good policies, like a flat tax for households and a low corporate tax rate. And I like how Orbán is not a fan of more centralized power for the European Union.
He’s also the leading voice in Europe in the fight against mass immigration. So I understand why some people identify him as a conservative.
But overall economic policy during his reign has been mediocre. Phil Magness is even more dour about Hungary, as you can see from this tweet.
What about Bukele in El Salvador?
He’s famous (or infamous, depending on your perspective) for dramatically reducing crime. So I can understand why he’s seen as a conservative.
But I’m not aware of any pro-market reforms since he took office. And this tweet from Daniel Di Martino indicates that economic liberty in El Salvador will probably continuing to decline under his reign.
The bottom line is that I can appreciate why people characterize Milei, Trump, Orbán, and Bukele as conservatives. Indeed, it’s probably accurate to say that all four are cultural conservatives.
So I decided to create a Venn Diagram that makes the basic point that every free-market leader is a conservative, but not every conservative is free market.
For what it’s worth, I sometimes refer to myself as a Reaganite. Perhaps in the future I’ll call myself a Mileist.
P.S. I sometimes tell audiences that Donald Trump is a populist rather than a conservative. But it all depends on your definition of conservative. In any event, I think my my Venn Diagram showing the difference between Trumpies, Reaganites, and establishment republicans is very accurate.
The Washington Post also disapproves of Trump’s victim blaming. Here are some excerpts from yesterday’s editorial.
The Democratic romp in this week’s off-year elections highlighted voters’ persistent frustration about inflation and the cost of living. The White House has taken note. Unfortunately, its first reflex is the same as that of the Biden-Harris administration: Blame corporate price gouging. …Trump’s abrupt public declaration suggests he’s casting about for a political answer to cost-of-living concerns after Tuesday’s political rebuke. …The Biden administration contributed to inflation with regulation and massive economic stimulus. Democrats tried to address their political problem by blasting corporations for raising prices. Biden specifically called out meatpackers in his 2022 State of the Union. Later in his term, he attacked grocery stores. Vice President Kamala Harris ran on imposing the “first-ever federal ban on price gouging on food.” If the Biden administration wanted to deal with inflation, it should have controlled spending and eased regulations. But that would have been politically difficult. Blaming price-fixing is easy. It’s the same story with Trump: His tariffs are raising prices on imported goods. Meanwhile, he’s trying to take control of the Federal Reserve while demanding it cut interest rates.
Almost makes you wonder if Trump and Biden were separated at birth?
I’ll close by regurgitating a point I made about Biden, which is that voters care a lot about whether their inflation-adjusted disposable income is going up or down. Republicans will deserve what happens to them in 2026 and 2028 if they don’t heed that lesson.
But I’ve never ranked all presidents from best to worst. Especially when considering all issues rather than just economic policy.
So I was very interested when Prager University asked me to take part in a survey designed to rank every chief executive from George Washington to Joe Biden (Trump was not included since we obviously don’t know what his final record will be).
According to me (and 154 other people), George Washington deserves first place. Here are the top-6 presidents of all time.
Now for my two cents. I definitely think Thomas Jefferson is ranked too high.
I’m also not sure why Eisenhower gets a very high score. Yes, he led the allied forces in WWII, but that presumably means he was a good general. In his role as president, he mostly was a placeholder. Nothing really good happened and nothing really bad happened.
Having said that, I confess that I don’t know enough about some past presidents to know which ones should rank above them (and, of course, I didn’t save the rankings I sent to Prager, so I can’t even share that info).
Now let’s look at the six-worst presidents of all time.
Once again, I’ll add my two cents.
Woodrow Wilson would be my choice for last place. He had terrible policy (income tax, Federal Reserve, etc) and also was a terrible person.
I also think FDR deserves to be very low on the list, perhaps second to last. When discussing Roosevelt, some people tell me, “but he was president when we won WWII.” My response is “so what?” since presumably anyone who was in the White House would have responded in the same way.
And Lyndon Johnson definitely belongs in the bottom group. As does Nixon. And Hoover as well.
The rankings also have what is sometimes called “recency bias.” More specifically, Biden and Obama get very low rankings because they are fresh in our memories. From a big-picture perspective, however, I think both of them were bad, but largely irrelevant (see here and here).
For those interested, here are the rankings for all the other presidents.
I’ll add a few closing comments on these middle-tier presidents. I think Harding and Clinton are under-ranked.
And I think Truman and Jackson are over-ranked (as mentioned above, FDR is ranked way higher than he deserves).
Last but not least, Donald Trump would belong in the middle of the pack if he was included. Maybe in the bottom third depending on what happens with the Supreme Court and his awfulprotectionism.
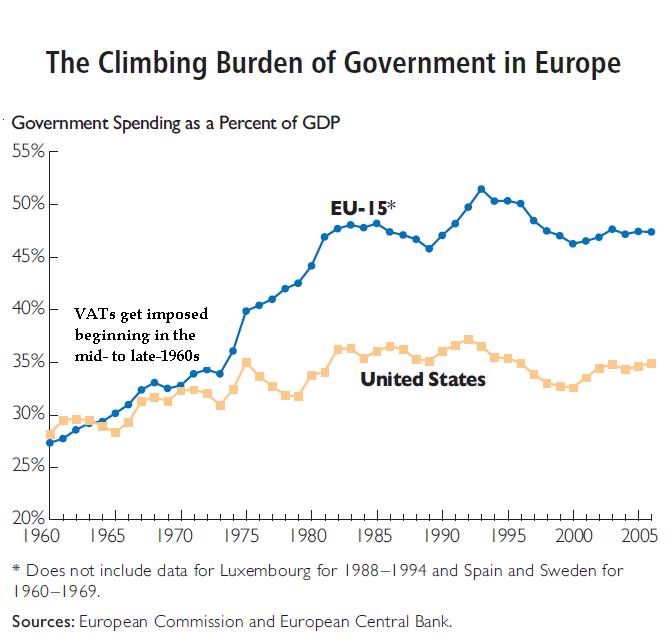
Simply stated, this hidden type of national sales tax was a key precursor for the expansion of the European welfare state. As you can see in the chart, the burden of government spending in Europe after World War II was similar to the size of the public sector in the United States.
Then European governments began to adopt the VAT in the late 1960s. Those VATs quickly expanded and became money machines for more spending (and more debt!).
Needless to say, the United States should not make the same mistake. Bigger government has led to worse economic outcomes in Europe, as I’ve documented in my four-part series (here, here, here, and here).
Financing bigger government with a VAT would weaken economic performance. In a 2010 study for the Mercatus Center, Professor Randall Holcombe crunched some numbers and reached some depressing conclusions.
…the effect of various VAT rates on GDP looking 10 years out and 20 years out. …In the revenue-enhancement case, where VAT revenue adds to existing sources of tax revenue, a 3 percent VAT would exact a 2.1 percent GDP penalty by 2020 and a 3.7 percent GDP penalty by 2030. A 5 percent VAT rate would bring with it a 3 percent GDP penalty by 2020 and a 5.6 percent GDP penalty by 2030. A 7 percent VAT rate…would reduce GDP by 4.1 percent by 2020 and 7.5 percent by 2030.
And here’s one of his tables, showing the negative effect on economic output (as well as some calculations showing that the VAT would not collect as much money as supporters hope).
Now let’s look at some more-recent research.
In 2024, Adam Michel wrote a report on the tax implications of bigger government.
Here’s his section on the VAT.
…consumption taxes (taxes on goods and services) account for almost three times as much revenue in the EU countries than in the United States. Every European country uses a value-added tax (VAT), a type of national sales tax collected by businesses at each stage of production instead of at the point of sale. In the United States, most consumption tax revenue is collected by state governments through a point-of-sale retail sales tax. In 2022, the average standard VAT rate in the EU countries was 21.8 percent, and the average state and local sales tax rate in the US was 6.6 percent. EU country VATs raise revenue equal to 12 percent of GDP, compared to sales taxes, which collect 4.3 percent of GDP in the United States. The adoption of VATs is closely associated with government growth because new revenue sources, especially when the cost of the tax is not transparent, tend to fuel new public expenditures and reduce pressure on spending reforms. This association is evident in the reliance on VAT revenue across EU countries, where governments are almost 20 percent larger than in the United States.
Here’s Adam’s chart, showing how the absence of a VAT is the main reason the United States has a fiscal advantage over the European Union.
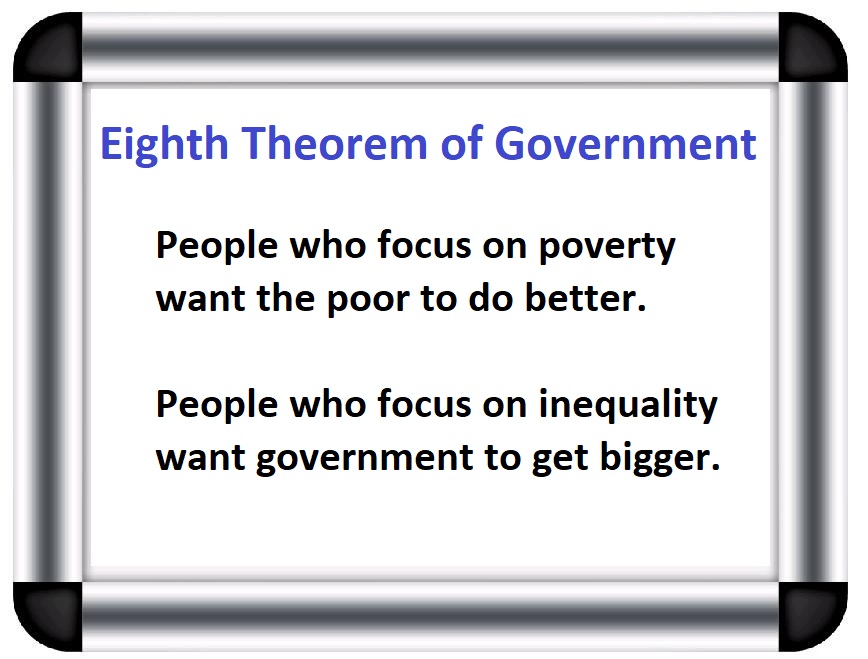
When I unveiled my Eighth Theorem of Government in 2020, my target was the head of the International Monetary Fund, a bureaucrat with a very generous tax-free salary who wanted other people to pay higher taxes to fund bigger welfare states.
Her excuse was fighting inequality, but her policy was bigger government.
And since the IMF had published research implying that societies would be better off if everyone was poorer but more equal (I’m not joking), I decided that I needed a way of capturing this perverse mindset.
Now I have a new reason to share my Eighth Theorem. The failed government of South Africa recently paid some leftist academics to issue a report on inequality.
Here’s their premise (keep in mind that “neoliberal” in much of the world means free market).
A series of economic policies that found favour from the 1980s led to steep increases in economic inequality in many high-, middle- and low-income countries. …Collectively, these policies have been described as ‘neoliberal’. They have been a common feature in most nations at different times over the last four decades… Broadly they are based on the idea that unregulated markets are the most efficient way of allocating resources. They were adopted nationally and globally through globalisation. Several of these policies led directly to higher inequality.
The authors are partly right. As I noted yesterday, there was a global shift to free-market policies that started under Reagan and Thatcher (an era sometimes known as the Washington Consensus).
Did this period of “neoliberalism” mean more inequality?
My responses is that I don’t care if some people get richer faster than other people get richer. I just want a system that produces more prosperity for everyone.
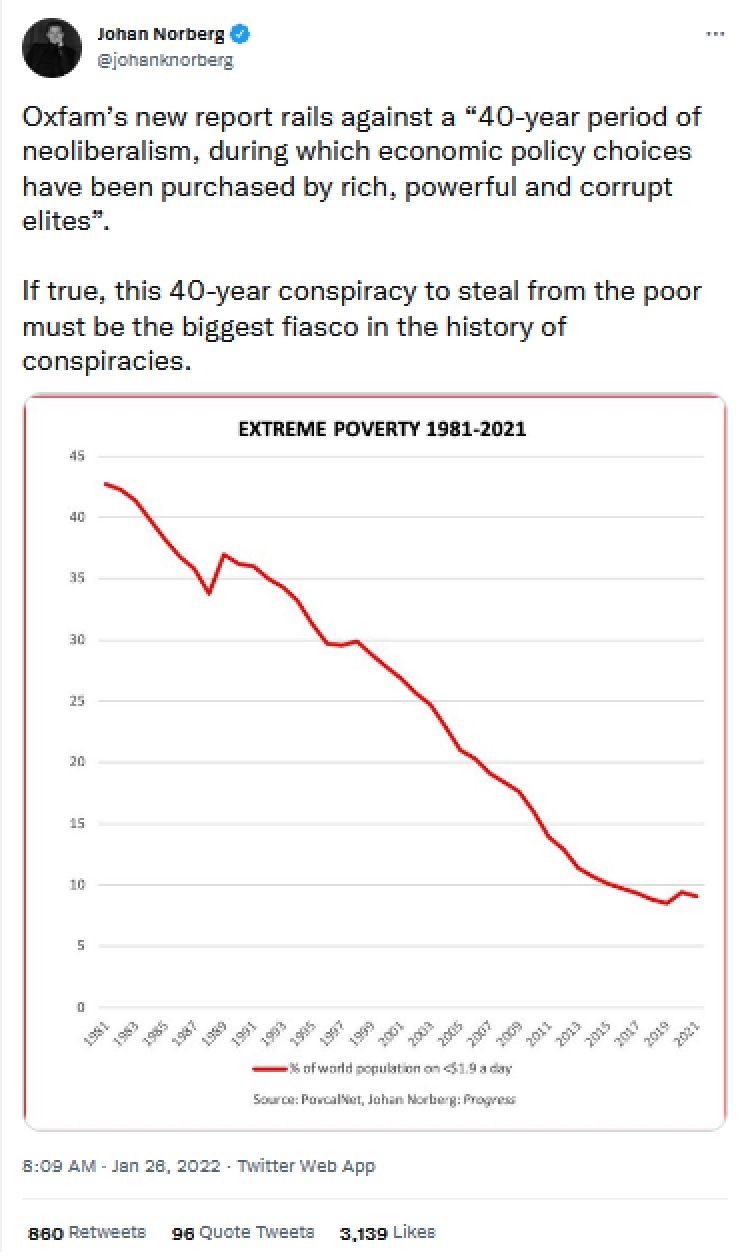
And, as Johan Norberg noted back in 2022 when responding to a different attack on neoliberalism, it was a spectacularly wonderful time for poor people.
Since the authors started with the wrong premise (fixating on inequality rather than looking at how to reduce poverty), it will come as no surprise that their proposed policies are misguided as well.
At various points, they endorse more spending, industrial policy, price controls, weakening property rights, and protectionism.
As you might suspect, I found their analysis of tax policy especially loathsome.
There is no ‘magic bullet’ to reduce inequality. But there is a menu of prudent policies that have proven to be highly effective, and could even be seen as preconditions, for reducing various dimensions of inequality. …we have a specific emphasis on the international approaches and strategies to reduce inequality… An agreement among countries to have a minimum corporate income tax would, for instance, help prevent the destructive race to the bottom in corporate taxation. …new negotiations at the UN towards a Framework Convention on International Tax Cooperation provide a historic opportunity to redesign the international tax architecture. Minimum global tax rates on corporate incomes and extreme wealth could be vital elements of this, which in turn would require…ideally the creation of a global asset register to identify and track wealth ownership.
P.S. The part about a “global asset register” is especially Orwellian. Fits well with the left’s desire to abolish cash and require everyone to use central bank digital currencies.
My intense support for Javier Milei is not because I care deeply about Argentina (though it is a very nice country and I want it to prosper). Instead, as I explain in this one-minute clip, I’m mostly hoping Milei’s economic and political success will encourage other governments to copy his policies.
I especially want some Milei copy-cats to emerge in the United States, where we desperately need the kind of spending restraint that Argentina is now enjoying (and it also would be nice to have some leaders who understand and appreciate the benefits of free trade!).
In my fantasy scenario, Milei triggers a global renewal of pro-market reforms, much as we saw a few decades ago when Reagan and Thatcher helped usher in an era known as the “Washington Consensus.”
The good news, building on what I wrote last week, is that Milei-ism is attracting more and more attention. Here are some excerpts from an article in the U.K.-based Economist.
Mr Milei’s spending cuts are perhaps the deepest and fastest ever imposed on a country through broad democratic consent. When he won the presidency, promising intense austerity, voters had not yet felt his chainsaw. Now they have… And yet the voters have backed him again….This matters beyond the Rio de la Plata. Many rich-world governments are struggling with fiscal deficits and soaring debt. Their problems are not at Argentine levels, but rich-country leaders can still learn from Mr Milei. His success shows the power of tough-but-coherent economic messages that are proclaimed with clarity and conviction. …The president now has a welcome opportunity to launch a second tranche of reforms. …Liberalising labour markets and simplifying the tax system would be a good start. This would reinforce the financial reforms, boosting the economy and Mr Milei’s popularity, paving the way to dealing with tougher policies like pension reform. …Mr Milei has a chance to improve Argentina in a way that will last long after he leaves office, by transforming the terms of political debate. …his journey already holds lessons for the world—and it may soon offer more.
One of the reasons I’m citing an article in the Economist is that it is not a libertarian publication. Indeed, I think it leans a bit to the left (see here, here, and here).
In any event, it’s definitely an establishment outlet, so it’s noteworthy that even it is observing that Milei’s libertarian revolution “holds lessons for the world.”
Another establishment outlet is Project Syndicate. It’s a good site to visit for wonks who care about both domestic and international economic policy and it publishes articles I don’t like (see here, here, and here) and articles I do like (here, here, and here).
Interestingly, it just published an article by Nouriel Roubini, who has a very establishment pedigree (Clinton Administration, Wall Street, IMF, etc). Yet he has an article that makes many of the same points I’ve made.
Breaking from the pattern of past failed economic-stabilization episodes…Argentine President Javier Milei used his 2023 election victory to implement the strongest fiscal-austerity and structural-reform policies in the country’s history. In 2024, the primary fiscal adjustment (excluding interest payments) amounted to 5% of GDP, setting the stage for a strong economic rebound… Now, for the first time in ages, Argentina may escape the policies that have repeatedly driven it into debt defaults and high inflation. After the most recent Peronist administration had pushed the country close to an inflation spiral and another default, Milei started cleaning up the mess with ruthless efficiency. While many have criticized his draconian approach, the results of the October election show that the Argentine people would prefer short-term economic pain over a return to Peronist policies. Milei will now…continue his program via legislation, rather than decrees, starting with labor-market and tax reforms. Further economic liberalization will then attract a surge of domestic and foreign investment, ensuring strong economic growth for the future. …The market reaction to the October election confirms that investors are on board with Milei’s strategy. The panic leading up to election day was not about him, but about the prospect of a Peronist return. With the recent electoral uncertainty behind it, Argentina now has a clear path to political stability. We will likely see significant inflows of FDI, allowing growth to accelerate over time. Argentina may even become a model for the kind of market-oriented economic reforms and fiscal austerity measures that are needed in other Latin American economies, such as Chile, Brazil, and Colombia – all of which will hold elections in the coming years.
For purposes of today’s column, the part I like is when he wrote “Argentina may even become a role model.”
Let’s hope so. And not just that Argentina may be a role model for Chile, Brazil, and Colombia.
Of course, I’m mostly focused on Milei being a role model for the United States. Surely there are some Republicans (and maybe a few Democrats) who will be emboldened to do what’s right, especially since Milei has confirmed my Fourth Theorem of Government.
I try to share at least three columns of anti-communism satire every year. So here are more examples of anti-Marxism satire, building on what I published in June and October.
Since we’re on the topic of North Korea, someone did manage to find an area where that country has an advantage.
There’s nothing subtle about this next cartoon strip. However, given the track record of communism, it’s obviously accurate.
Our fourth item is for people interested in marketing.
Forget New Coke vs Classic Coke. There’s something even more amazing.
Sticking with tradition, I always save my favorite bit of satire for the end.
It’s a meme explaining that the only equality under communism is that everyone is poor.
Except that’s not technically true. Communist dictators and their families/cronies make out like bandits. It’s the other 99.99 percent of the population that is equally deprived.
From a practical perspective, however, “immediate” won’t happen immediately. Or even in the next four years.
That’s because the Labour Party in now in charge and doubling down on the tax-and-spend policies of Johnson and Sunak.
At the risk of understatement, this bi-partisan approach of bigger government is not working.
In a column for the U.K.-based Telegraph, Dan Hannan opined on the decline of the United Kingdom. Here are some of his depressing comments.
On current trends, our standard of living will fall behind Lithuania in five years’ time and behind the Czech Republic in six. The deadweight of taxation and debt have pushed us steadily down the league tables, from 12th place at the beginning of the century to 24th today. If nothing changes, we will fall to 46th by 2050 – a middle-income nation. Along the way, we’ll be overtaken by Romania, Georgia, Turkey and Moldova. …None of this is inevitable. It is the direct result of choices we have made – and, depressingly, that we continue to make. People respond to incentives. If you put up their taxes, so that they keep a smaller portion of what they earn, they will be less productive. Likewise, if you hand them money unrelated to what they produce, they will be less productive. …Similarly, if you have regulations that inhibit risk-taking, privilege some sectors over others, or prevent companies from acting in the most efficient way, those firms become less productive. …This year, we will spend £303bn on benefits. It is hard to convey quite how vast that sum is. It is not only bigger than last year’s defence budget; not only bigger than last year’s NHS budget; it is bigger than both combined. Yet there is no willingness to curtail this expansion. Indeed, Labour seems set to add a massive new driver to the growth of welfare by lifting the two-child benefit cap. That is why taxes are going up. …Ours was the country of Adam Smith and David Ricardo and Margaret Thatcher, the country that introduced the world to free contract, secure property and open markets. Those ideas made us the richest nation in the world. Yet our generation cares nothing for them. …We choose mediocrity.
Since I’ve written about the United Kingdom’s unfavorable growth trajectory when compared to Poland, Australia, Lithuania, and Singapore, I’m not overly surprised that Hannan is worried this his country will soon fall behind nations such as Romania and Turkey.
And he’s right that the Starmer government is crazy to punish success and reward sloth.
Sadly, things are probably going to get even worse.
Allister Heath, the Editor of the Sunday Telegraph, has a column about the government’s plan to further increase the burden of government.
The Government swore it wouldn’t put up national insurance, and then changed its mind. It promised it wouldn’t put up income tax, and now the Prime Minister is opening the door to doing exactly that, refusing to recommit to his manifesto. The Chancellor pledged she wouldn’t impose a wealth or mansion tax, and is now considering such plans. …No government in modern history has broken so many promises so quickly. The first lies came almost immediately, with the fabricated discovery of a “black hole”, the abandonment of the semi-responsible Tory spending plans and the adoption of unaffordable policies, including pay rises for its electoral base in the public sector. Reeves raised tax by £41bn a year by 2029-30 at her 2024 Budget, five times more than promised, to part-pay for a £71bn a year increase in spending. …Next month’s Budget will see another round of tax hikes, probably £30-£40bn a year… This time she will likely breach either or both of her pledges on income tax and wealth taxes. She could become the first Chancellor since Harold Wilson in 1975 to raise the basic rate of income tax. She could impose a wealth tax, perhaps in the form of a levy on expensive homes. …Her original lie was the “black hole” she caused herself by ditching Tory plans. Her latest rationalisation of higher tax is equally mendacious, and involves blaming “austerity” (at a time when tax and spend are at historic highs).
So what needs to happen? In my fantasy world, the U.K. would trade the Falkland Islands for Javier Milei and then get some much-needed spending restraint.
That won’t happen, of course, but it is worth noting that the U.K. has benefited from “austerity” a few times (1800s, 1980s, and 2010s).
Sadly, we won’t see anything like that in the next few years. Starmer and Reeves inherited fiscal profligacy and are making a bad situation worse.
Let’s look today at European fiscal policy. But instead of focusing on the immediate issue (the likelihood of another fiscal crisis), we’re going to investigate whether we can learn anything by looking at what’s happened in the past.
My two cents, based on these charts, is that European governments have given us very powerful evidence that tax increases are simply a recipe for more spending and more debt.
The first chart shows how tax burdens in Western Europe (specifically, the 15 pre-enlargement members of the European Union) have jumped dramatically over the past five decades (and I used five-year averages to avoid any risk of cherry-picking one year with unusual data).
The second chart then points out that average government debt in those nations was about 45 percent of GDP in the late 1960s, back when tax burdens averaged about 29 percent of GDP.
And I ask what happened to debt levels over the past 50-plus years? There’s been a massive increase in tax burdens. Did politicians use the revenue to balance budgets and pay down debt?
The third chart then answers those question by pointing out that debt levels have skyrocketed.
In other words, politicians spent every penny of additional tax revenue, and then spent even more.
This should be all the evidence needed to confirm that tax increases are the wrong way of dealing with fiscal problems
And these lessons from Western Europe apply to the United States.
In other words, Milton Friedman is correct. If you give politicians more money, they will spend it. And red ink will become an even bigger problem.
I’m sharing this data because we’re now going to look at a new report from Brookings by William Gale, Ian Berlin, and Sam Thorpe. They argue that the United States should have a higher tax burden.
Here are their main findings.
…the U.S. faces an unsustainable fiscal future. …How should the U.S. respond? …In brief, we find that (a) the U.S. does not face a short-term crisis, so it can employ gradual adjustments which may minimize short-term harm; (b) consolidation should occur in a strong economy with monetary accommodation; and (c) tax increases could play a comparatively larger role — and spending cuts a smaller one — in US consolidations than in European adjustments.
And here’s a chart the authors shared showing tax and spending levels in countries that decided to address fiscal problems.
The report has plenty of interesting information and cites lots of worthwhile research.
But it ignores the elephant in the room, which is that Europe has been doing tax-heavy consolidations for decades and the result has been more debt.
For all intents and purposes, the authors pretend that the problem of “public choice” does not exist.
But there’s more than one elephant. Another problem with the Brookings report is that it basically concludes that the United States should be more like Western Europe. Yet at no point does it look at the implications for American prosperity.
So here’s a chart recently shared by @cremieuxrecueil.
At the risk of stating the obvious, the United States is far richer than most other developed nations, including our friends in Europe (by the way, the green bars are European nations and the pre-enlargement EU-15 nations are all on the list).
The obvious takeaway is that European nations should be copying the United States, not the other way around. Yet Gale and his co-authors want America to be more like Europe.
Call me crazy, but I don’t think the United States should copy the policies of nations that have much lower living standards. Especially when tax increases would almost surely worsen America’s fiscal outlook.

First-ranked California has more than three times the US average. New York and California boardrooms often complain about onerous permitting rules, licence requirements and reporting standards that raise costs, crimp innovation and slow expansion. Both states have among the highest minimum wage rates, too. A complex web of high taxes makes matters worse. …The loss of businesses and workers puts strain on California and New York’s economic model. …Both states are struggling to balance the books. New York faces an estimated cumulative three-year budget deficit of $34.3bn. California has a projected $18bn shortfall for the new fiscal year. …the continued loss of cornerstone taxpayers isn’t sustainable. In the decade between 2011 and 2021, New York lost $111bn in net adjusted gross income due to interstate migration, and California lost $102bn… As California and New York demonstrate, taxpayers can and do vote with their feet.