-
-

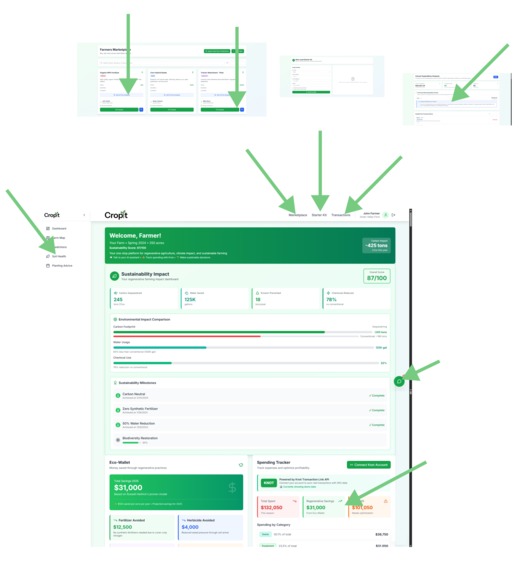
Login & Authentication - Secure access to the Crop It platform
-
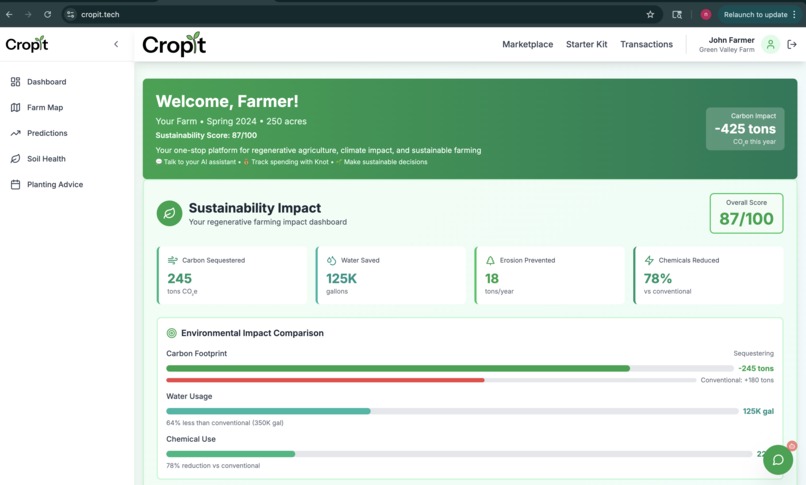
Sustainability Dashboard - Comprehensive environmental metrics and impact tracking
-
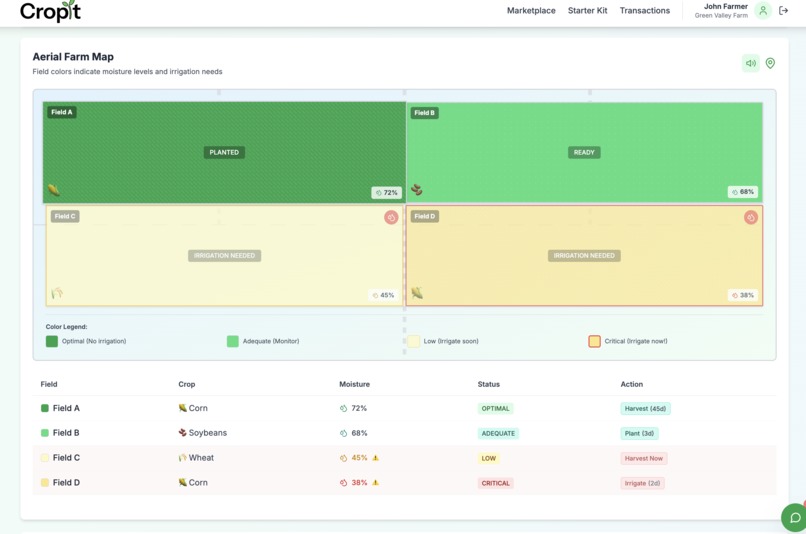
Farm Map Visualization - Real-time field monitoring and irrigation management
-
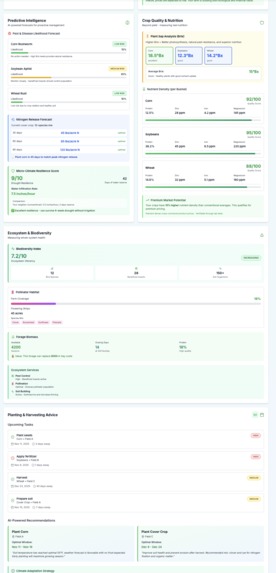
Real-time metrics and regenerative farming recommendations
-

Financial Integration Loan application and project cost management via Capital One API"
-

Marketplace Intelligence - Nova AI-driven pricing analysis and competitive advantage recommendations
-
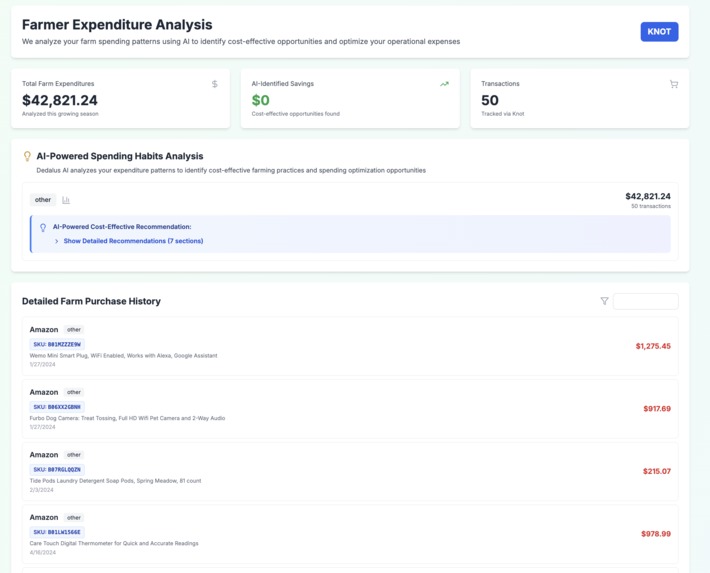
Transaction Analytics - Knot API integration for comprehensive farm expenditure tracking and optimization
-


Cropit: Regenerative Insights for Real-World Profits 🌾🚀
🌱 Inspiration
Our journey started with a love for food, climate action, and the powerful stories of Gabe Brown, Russell Hedrick, and real working farms. Watching Nature's Balance: The Art of Regenerative Farming and Chef’s Table, we saw firsthand that regenerative agriculture is not only possible, it’s the future economically and ecologically.
For years, climate targets have fallen short often because “sustainability” felt like a cost, not an opportunity. Cropit is built to flip that script by showing how regenerative agriculture can be a profitable path for farms and food businesses.
What really grabbed us:
- Gabe Brown’s 6 Principles context, least disturbance, soil armor, diversity, living root, animal integration—are real-world wisdom, not just theory.
- Russell Hedrick’s data: over \$62,000 saved in a year with numbers to prove it, not just hope!
- The relentless challenge of monocropping in the US: most row crop farms plant just 2–3 crops, nowhere near the diversity that regenerative science recommends.
- Our team’s foodie spirit: believing every great meal starts with soil health, and every farmer deserves recognition (and reward!).
🤖 What It Does
Cropit is your farm’s collaborative dashboard and “helping hand” for all things regenerative. Here’s the magic:
- Integrates real-world data (USDA, OpenWeather, live web scraping via Gemini API, satellite sources) to power actionable farm analytics.
- Tracks profit, diversity, and resilience for every field. See the “Eco-Wallet”: money saved, risks avoided, new revenue streams (like carbon credits).
- Gives proactive insights how to boost soil health, manage crop rotations, and prepare for weather or market changes.
- Visualizes advanced metrics: Fungal:Bacterial Ratio, real-time Brix (sap) readings, crop rotation diversity, water-holding capacity, and more.
- Not just a dashboard. Cropit is a digital partner, helping you make informed, profitable, sustainable choices, not just handing down “advice.”
🛠️ How We Built It
- Stack: Next.js, Python, Gemini API (web scraping/insights), ElevenLabs (audio alerts), OpenWeather, USDA agricultural data, Amazon Nova (contextual AI insights), Knot (transaction analytics), Capital One API (financial tools).
- UI/UX: Crafted with (lots of!) Figma iterations, prioritizing clarity for high-stakes decisions and making data approachable.
- Data scraping: Leveraged Gemini’s API to routinely pull fresh web/crop/soil/weather data, keeping insights grounded in what's happening on the ground right now.
Analytics: Developed “Eco-Wallet” cost models, leveraging real farm data running calculations like: $$ \text{Water Infiltration Rate} = \frac{\text{Total Rain}}{\text{Time}} $$
Voice & contextual insights: ElevenLabs reads out key alerts and recommendations so farmers can keep their hands free. Amazon Nova automates deep-dive research, surfacing actionable advice from a world of ag, climate, and science reports.
Financials & transactions: Knot's API tracks crucial farm and supply-chain transactions, while Capital One's API enables in-dashboard loan offers and financial benchmarking, helping farms easily discover, plan, and finance regenerative upgrades.
All this comes together in Cropit’s dashboard making sense of a lot of moving pieces for a clear, rewarding, and enjoyable user experience.
🚧 Challenges We Ran Into
- API integration: Combining many data streams (USDA, weather, web scraping) presented tons of hurdles—rate limits, inconsistent data schemas, and lots of “why won’t this connect?” moments.
- Data overload: Modern farming generates mountains of data. Our toughest task was making this simple and actionable for real decisions. Too much info? It paralyzes. Not enough? It misguides.
- Communicating complexity: Regenerative ag is science + creativity. Making advanced analytics enjoyable and not overwhelming was a constant balance.
- Climate variability: Farming data is at the mercy of the weather global warming brings chaos. We had to design not for “average” but for the wild, unpredictable future.
🏅 Accomplishments That We’re Proud Of
- Live dashboard: Working, demo-ready, and totally flexible ready to plug in any farmer’s data.
- Dynamic "Eco-Wallet": Every cost-saving, every new revenue source, visible at a glance.
- Multi-source data blending: USDA, web, weather unified for actionable insights.
- Designed with empathy: Not “dictating” to farmers, but listening to the real-world constraints that fields, markets, and nature impose.
📚 What We Learned
- Diversity is rare but essential. US farms average just 2.1 crops per rotation our dashboard makes expanding that not just a goal, but a reward.
- Profit isn’t yield alone. Sometimes less is more: like Russell Hedrick found, spending \$108 for a \$36 gain isn’t smart business.
- Let data serve, not rule, the user. Our goal shifted from “more data” to “right insights, right moment.”
- Collaboration beats command. Farmers are experts tech should be a partner, not a boss.
🔮 What’s Next for Cropit
- Deeper weather/soil mapping powered by AI agents predict droughts, pest threats, and yield well in advance.
- More cross-platform features: text or voice insight feeds, simple export to accounting or supply chain platforms.
- Expand Cropit as a “regenerative social network” for sharing across farms, researchers, and chefs.
- Continue blending passion for great food, resilient ecosystems, and real farmer prosperity—the operating system for the agricultural revolution.
Thanks to our community of visionary growers, leaders, innovators, and everyday people. Cropit is built for everyone—from farmers to business leaders—by technologists who believe the smartest future is regenerative, profitable, and shared.
Built With
- amazon
- capital-one
- dedalus
- elevenlabs
- gemini
- knot
- next.js
- react
- tailwind.css
- usda-national-farmers-market-directory
- usda-soil-data-access


Log in or sign up for Devpost to join the conversation.