-
-
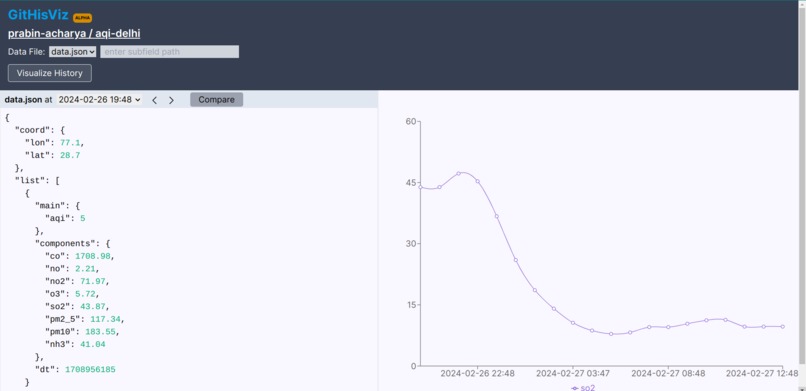
screenshot of plotting entire repo history of air quality index in gitlab-data-history-visualizer
-
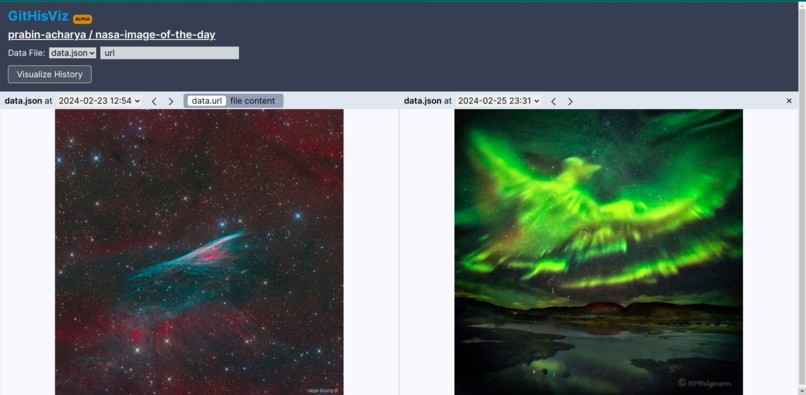
screenshot of demo of comparing two files across different commits using gitlab-data-history-visualizer


GitLog W Gitlab
Git is a powerful tool. It is heavily used in software development to track changes to code over time. However, its capabilities extend far beyond just a version control for coding project. It can be used to track changes in any type of data. Unfortunately, because of technical hurdles, it is very rarely used outside of programming tasks.
This project utilizes git and Gitlab CICD components to enable users to use git to track changes in dynamic data very easily.
Background
Tracking dynamic data, such as air quality, news headlines, or financial metrics, is crucial for various applications ranging from environmental monitoring to market analysis. However, setting up a robust system to continuously collect and archive this data can be challenging and often requires specialized tools and infrastructure.
By leveraging Git, we can simplify the process of tracking dynamic data. Git provides a solid foundation for managing changes to files, enabling us to create a time-stamped record of data updates automatically.
By combining this with Gitlab CICD components we can implement a scalable solution for tracking dynamic data over time. By setting up scheduled tasks with Gitlab CICD, we can automate data collection from external sources and commit it to our Git repository at regular intervals. Hence, gathering a record of data over time. This data can then be processed, analysed, visualized to understand how the data changes over time.
Getting Started
To begin tracking data with Git Tracking, follow these simple steps:
Create a New Repository: Start by creating a new repository where you'll store your tracked data.
Configure
.gitlab-ci.yml: In your repository, create a new file named.gitlab-ci.ymland paste the following content:
  include:
    - component: gitlab.com/prabin-acharya/gitlog-w-gitlab/[email protected]
      inputs:
        stage: build
        link: "https://api.nasa.gov/planetary/apod?api_key=DEMO_KEY"
Customize API Link: Replace the placeholder URL
"https://api.nasa.gov/planetary/apod"with the URL of the API you want to track data from. If the API requires an API key, add the key to the project's CI/CD variables and reference it in the.gitlab-ci.ymlfile as:link: "http://api.openweathermap.org/data/2.5/air_pollution?lat=28.7&lon=77.1&appid=${OPENWEATHER_API_KEY}"Customize Data Processing(Optional): If you need to modify the response of the API, create a script named processData.js. The GitLab Runner will execute this script automatically.
Create Project Access Token: Create a project access token with write_access permissions and save it in the CI/CD variables as
GITLAB_PROJECT_TOKEN.Setup Schedules: Configure schedules for data tracking through "Build" > "Pipelines Schedules" in the project page settings.
Use Cases
By simplifying the workflow, this project opens up git and gitlab's power to wider community. It can be used to track any type of data that changes over time. Here are some of the examples I implemented:
- Air Quality Monitoring: track air quality levels in specific locations to analyze pollution trends and support public health initiatives.
- NASA Image of the Day: archive NASA's daily featured image for educational or inspirational purposes.
- News Headline Tracking: monitor changes in New York Times headlines to observe shifts in media coverage and trending topics.
GitHisViz - Git History Visualizer
GitHisViz is a powerful companion tool designed to simplify the navigation of a GitLab repository's history. You can access the app here: https://githisviz.vercel.app/
When you're tracking data with Git History Keeper, reviewing changes over time directly in the project repository can be cumbersome and slow. GitHisViz addresses this challenge by offering a user-friendly interface to explore your repository's history effortlessly.
How GitHisViz Works
GitHisViz loads your repository and its commits, providing intuitive navigation to view data changes across different points in time. With interactive visualizations, it helps you understand how your data evolves over the course of your project.
Key Features
- Effortless Navigation: Seamlessly browse through your repository's history and track data changes with ease.
- Compare data across different commits: see how data differes at different point in time.
- Interactive Visualization: Visual representations help you grasp data transformations over time at a glance.
Built With
- gitlab
- nextjs


Log in or sign up for Devpost to join the conversation.