-
-

The problem we are solving
-
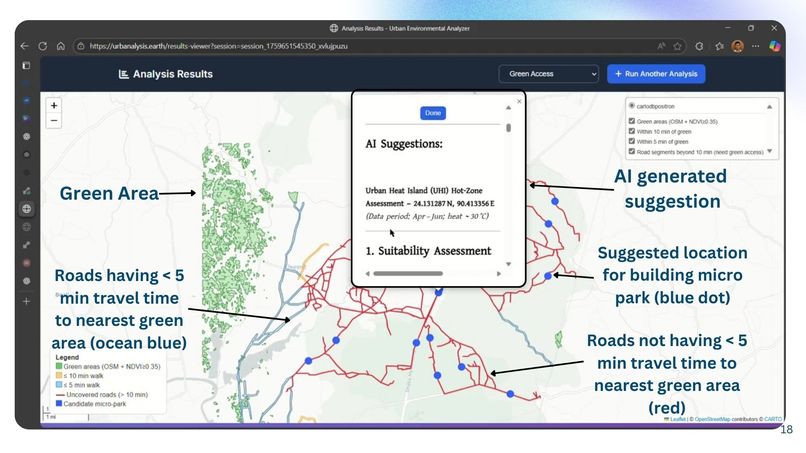
AI generated suggestion
-
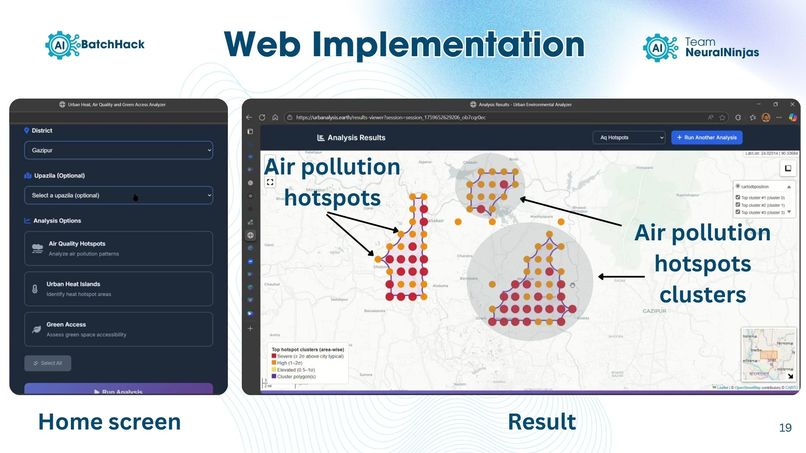
Web app implementation showing air pollution hotspot results
-

Data Pipeline


I. Inspirations
The Urbanalysis project was inspired by growing evidence that rapid urbanization is amplifying heat stress, air pollution, and the loss of accessible green spaces, particularly in cities of the Global South. Contemporary reports and case studies from cities such as Dhaka, Madrid, and Pune highlight how vulnerable communities disproportionately experience these environmental burdens. Despite the availability of rich satellite data from NASA and ESA missions, there remains a significant gap between data availability and its effective use in urban planning practice. Urbanalysis was conceived to bridge this gap by transforming complex Earth-observation data into actionable, equitable, and policy-relevant urban insights.
Rapid urbanization is exacerbating environmental stressors in cities, with implications for public health and sustainability. One prominent issue is the urban heat island (UHI) effect, wherein dense built-up areas trap heat and experience higher temperatures than their rural surroundings. This phenomenon is driven by the loss of vegetation and the prevalence of impervious surfaces that absorb and re-emit solar radiation.
Recent advances in satellite remote sensing enable detailed UHI monitoring. Thermal sensors on platforms like MODIS and the ECOSTRESS mission provide land surface temperature (LST) data that reveal fine scale hot spots and diurnal heating dynamics in urban agglomerations.
Another critical challenge is urban air quality. Cities often suffer from elevated levels of nitrogen dioxide (NO₂) and fine particulate matter (PM₂.₅). The Sentinel-5P satellite’s TROPOMI instrument allows high-resolution mapping of NO₂ and other trace gases over metropolitan areas.
Urban green spaces mitigate heat, improve air quality, and provide recreational and health benefits. However, access to parks and green amenities is often distributed unequally across socio-economic groups.
For this we present Urbanalysis, a smart web application that automatically downloads and processes satellite data, identifies environmental hotspots using density-based clustering and normalised indices, and summarizes these findings via a large language model (LLM) to deliver site-specific recommendations. Our system fuses MODIS and ECOSTRESS land surface temperature products with Sentinel-2 vegetation imagery and Sentinel-5P air-pollution measurements, uses density-based spatial clustering (DBSCAN) to delineate hot zones and converts the results into human-readable planning guidance.
An intuitive interface allows planners to select an area of interest, run analyses on demand and explore the results in interactive maps. Demonstrations on districts in Dhaka show that Urbanalysis can expose heat hotspots, air pollution exceedances and green-space gaps, while the AI assistant recommends targeted interventions such as cool roofs, micro parks or traffic diversion. The platform bridges the gap between satellite intelligence and actionable urban-planning decisions.
II. Methods
A. Data Sources
Urbanalysis integrates multi-mission Earth Observation (EO) and ancillary datasets to capture thermal stress, air pollution, and green-space accessibility at city scale.
| Dataset | Description |
|---|---|
| Landsat | Historical reference, NDVI fallback |
| SMAP | Soil moisture |
| MODIS | Land surface temperature |
| ECOSTRESS | High-resolution thermal |
| Sentinel-2 | NDVI vegetation |
| Sentinel-5P | Air quality |
| JRC GSW | Surface water |
| SoilGrids | Soil properties |
| OpenStreetMap | Roads and land use |
B. Data Processing and Analysis Pipeline
- AOI selection and ingestion
- Harmonization and quality control
- Feature engineering and normalization
- Density-based clustering (DBSCAN)
 Figure 1: sample line graph using colors which contrast well both on screen and on a black-and-white hardcopy
III. Results and Discussion
A. Air Quality Hotspots
Sentinel-5P NO₂ data are analyzed to identify severe and elevated pollution zones.
 Figure 2: Air Quality Hotspots
B. Urban Heat Island Clusters
Normalized LST from MODIS and ECOSTRESS identifies the hottest 10% of pixels.
 Figure 3: Urban Heat Islands
C. Green-Space Access Gaps
NDVI and network service-area analysis reveal underserved neighborhoods.
 Figure 4: Green-Space Access Gaps
D. AI Guidelines and Recommendations
A large language model translates analytical outputs into planning guidance.
 Figure 5: AI Recommendations
E. Web Implementation
Urbanalysis provides a user-friendly web interface.
 Figure 6: Web Interface
F. Financial Overview
| Item | Cost (USD/month) |
|---|---|
| Data acquisition | 0 |
| Infrastructure | 100 |
| LLM inference | 150 |
| Marketing | 50 |
IV. Case Study
Study Area: Narayanganj, Bangladesh
Challenges We Ran Into
Several challenges were encountered during the development of Urbanalysis. Such as:
Data-quality limitations, including cloud contamination in optical imagery and the coarse spatial resolution of some air-quality products, required careful preprocessing and multi-date compositing.
Harmonizing datasets with different spatial resolutions, temporal frequencies, and uncertainty characteristics posed additional technical complexity.
Algorithmic challenges included selecting robust normalization thresholds and DBSCAN clustering parameters that generalize across diverse urban contexts.
Infrastructural constraints related to large raster processing and considerations around user trust and adoption of AI-generated recommendations required deliberate design choices.
V. What We Learned
Through the development of Urbanalysis, we learned that technical sophistication must be balanced with interpretability and usability to achieve real-world impact.
We have learnt how to process big data and how to manage algorithms when the computational resources become crutial in the case of heavy data processing.
Integrating multi-source satellite data highlighted the importance of transparent preprocessing and normalization choices.
We also gained insight into the strengths and limitations of density-based spatial clustering for urban hotspot detection and the careful role that large language models can play in translating quantitative analytics into decision-support narratives. Overall, the project reinforced the value of interdisciplinary approaches that combine remote sensing, data science, and urban planning expertise.
VI. Conclusion
Urbanalysis demonstrates how automated satellite data pipelines, density-based clustering, and AI-powered summarization can transform Earth observation data into actionable urban planning insights. The platform enables evidence-based decision-making to support greener, cooler, and healthier cities.
Acknowledgment
We thank the BatchHacks organizers, NASA, ESA, and the open-source geospatial community for their support.
References
- Roba & Tabor (2025), Scientific Reports
- Chang et al. (2023), Sustainable Cities and Society
- Son et al. (2023), Atmospheric Pollution Research
- Bressane et al. (2024), Urban Forestry & Urban Greening
- Gerasopoulos et al. (2022), Environmental Science & Policy
- Cesario et al. (2023), Big Data and Cognitive Computing
Built With
- dbscan
- fastapi
- googleearthengine
- gpt-oss-120b
- groq
- leaflet.js
- ml
- react.js

Log in or sign up for Devpost to join the conversation.