-
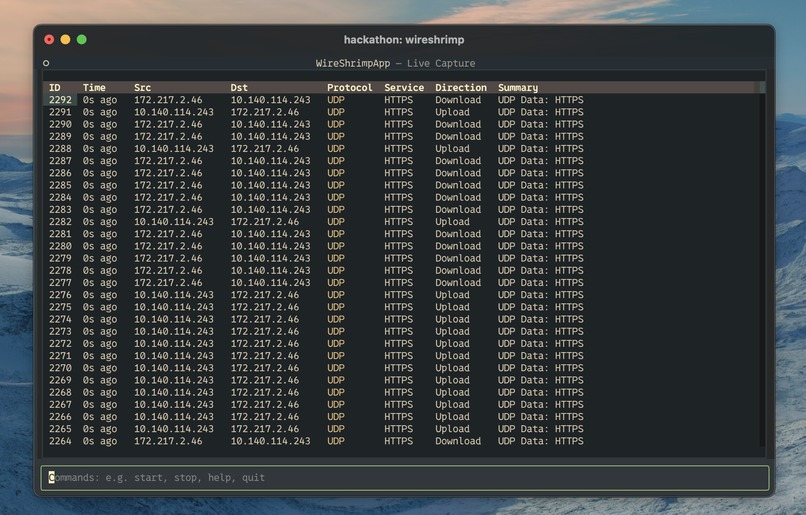
WireShrimp live feed - Normal Mode
-
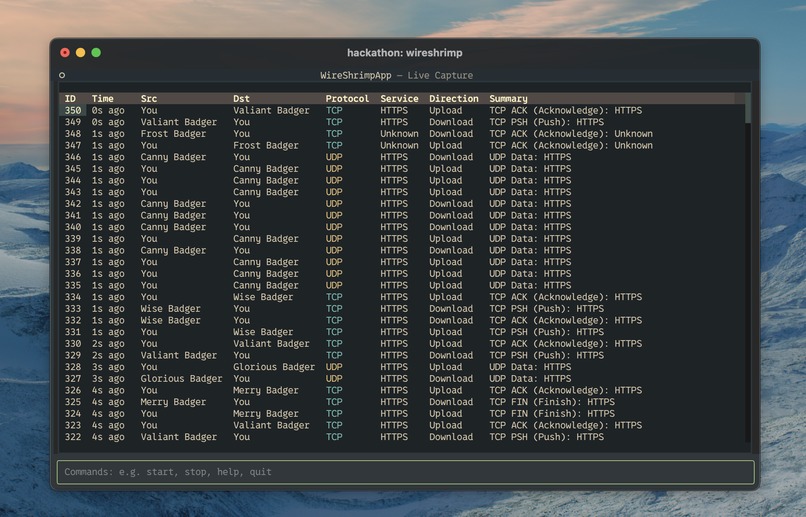
WireShrimp live feed - Friendly Mode
-
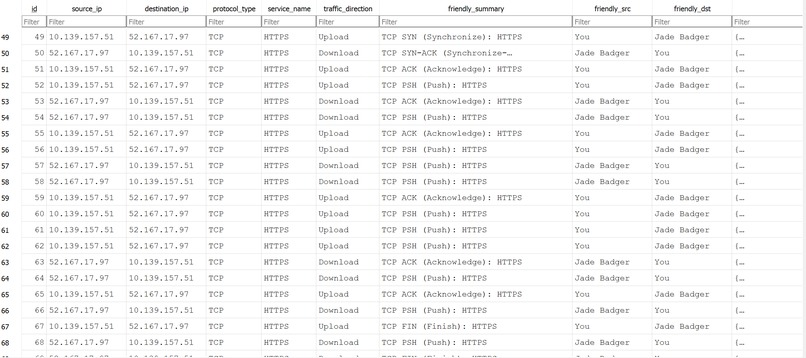
WireShrimp Database


WireShrimp
Team: Connor, Jack, Niyati, Pranav
The Problem: The Wireshark Learning Curve
Wireshark is the industry standard for network protocol analysis, offering immense power and detail. However, for students, aspiring developers, and junior engineers, its interface can be overwhelming. The sheer volume of "raw" data, complex filtering syntax, and the presumed knowledge of networking concepts create a steep learning curve, making it difficult to gain initial insights into network traffic.
Our Solution: A Stepping Stone to Network Analysis
We are building a Command-Line Interface (CLI) tool that serves as a "stepping stone" to more advanced tools like Wireshark. By adding a layer of abstraction, our tool will provide a user-friendly way to capture, analyze, and understand their own network traffic. The goal is to make network analysis more accessible and intuitive for those new to the field, fostering a better understanding of fundamental networking concepts.
Key Features
Live Packet Capture: Easily start and stop capturing packets on a selected network interface.
Simplified Packet View: Instead of a raw data dump, packets are presented in a clean, human-readable summary, highlighting the most important information (IP addresses, ports, protocols).
Educational Features: An interactive "Packet Explainer" that allows users to select a packet and get a clear explanation of its different headers and fields (e.g., "Assigning Each IP an English name for better readability").
Target Audience
Computer Science Students
Aspiring Software & Network Engineers
Cybersecurity Beginners
Anyone curious about the data flowing through their network!
How It Works
We use Scapy's asynchronous Sniffer to capture packets to and from the user's device without creating a bottleneck. These packets are written to a SQLite database along with critical metadata about each packet (see image gallery). The program is structured as a CLI tool using Click for command management and Textual with CSS for the visual interface, which displays information from the database. We implemented several commands that allow users to start/stop packet sniffing, inspect individual packets in detail, filter by IP address or protocol, and enable "friendly mode," which replaces IP addresses with readable nicknames.
Technical Design and Performance Notes
The High-Throughput Challenge: Handling Packet Streams
During development, we encountered a critical performance bottleneck. The initial design attempted to write every captured network packet to the SQLite database individually.
Problem: On an active network, packet capture can run at thousands of packets per second. Attempting a separate database write for each packet created extreme I/O overhead. This overwhelmed the database, causing the packet processing queue to back up and drop large numbers of packets. The application appeared to hang and failed to store any data.
Solution: Batch Processing: The issue was resolved by implementing a batch processing strategy for database writes. The new design works as follows:
Captured packets are collected in a temporary in-memory list (a "batch"). The application writes the entire batch to the database in a single, efficient bulk transaction when one of two conditions is met: The batch reaches a predefined size (e.g., 200 packets). A timeout is reached (e.g., 2 seconds), ensuring data is saved even during periods of low traffic. This approach dramatically reduces database overhead and allows the application to keep up with high-traffic networks, ensuring reliable data capture.
Next Steps
- More Detailed Packed Analysis
- Network Flow Visualizers
- Lookup for Known IP-Addresses
- Enchanced UI
Built With
- click
- css
- python
- scapy
- sqlalchemy
- sqlite
- textual


Log in or sign up for Devpost to join the conversation.