Added scalloped path effect #1609
Conversation
|
This is super cool, thanks for submitting--I'm excited you got this working so relatively easily. I haven't done a detailed review, but a couple things jump out:
|
|
This pull request introduces 1 alert when merging 787766d into b5e3942 - view on LGTM.com new alerts:
|
|
This pull request introduces 1 alert when merging 96328fd into b5e3942 - view on LGTM.com new alerts:
|
|
Failing check is due to old version of |
|
If that came in with the recent matplotlib PR and won't appear until 3.4, then yeah. That part would go in |
|
This pull request introduces 1 alert when merging b7b5337 into db732bd - view on LGTM.com new alerts:
|
|
This pull request introduces 1 alert when merging 87c3a7d into db732bd - view on LGTM.com new alerts:
|
|
This pull request introduces 1 alert when merging 823a808 into db732bd - view on LGTM.com new alerts:
|
This commit adds a path effect to make lines drawn appear to be
scalloped. This was based off of modifying the matplotlib
TickedStroke path effect. This style of line is often used for
highlighting areas in SPC MCD products.

Places it in metpy.plots.patheffects module with patches for
versions of matplotlib < 3.2 in the metpy.plots._mpl module.
|
This pull request introduces 1 alert when merging f9dac66 into db732bd - view on LGTM.com new alerts:
|
|
I think everything is in order now. I cannot figure out why the Build Docs (3.9) fails. The output does not indicate its anything with the additions. |
|
In some of my testing with this on plotted maps, I've noticed that the same parameters given to the scallops will look different depending on the the selected area/extent. It seems to be related to the aspect ratio of the area selected. I find that when I manually multiply the scallop parameters by the data coordinates aspect ratio that it looks the same between varying areas. Setting the aspect to equal in matplotlib did not fix the issue. Is there a way to do this when the scallops get created instead of doing it manually? I looked into it some but could not find an obvious way to get it at a lower level. |
|
Well, it seems I may not have been setting the aspect ratio correctly. Using |
|
This pull request introduces 1 alert when merging f9dac66 into 1aaf805 - view on LGTM.com new alerts:
|
 dopplershift
left a comment
dopplershift
left a comment
There was a problem hiding this comment.
sigh Well I see I never clicked 'submit' on some of my last review comments. Any interest in reviving this @nawendt? I think we can just depend on Matplotlib 3.4 at this point, otherwise there were just a couple minor things I found last time I looked at this.
Sorry, I thought this was waiting on your end, not mine.
| import pytest | ||
|
|
||
| from metpy.plots import patheffects | ||
| # Fixtures to make sure we have the right backend and consistent round |
There was a problem hiding this comment.
| # Fixtures to make sure we have the right backend and consistent round | |
| # Fixture to make sure we have the right backend |
| @@ -0,0 +1,44 @@ | |||
| # Copyright (c) 2018 MetPy Developers. | |||
There was a problem hiding this comment.
| # Copyright (c) 2018 MetPy Developers. | |
| # Copyright (c) 2020 MetPy Developers. |
|
Yes. I was actually looking at this recently. I know I talked about trying to get them to look the same for different spatial extents. At least with looking at these on a map, the pixels will represent different sizes depending on the extent. If you get the average meters per pixel (between x and y directions), you can use that to scale the sizing parameters to have some static "scallops per pixel" so to speak. In NMAP they do not try and keep things static based on extent. So that's the remaining question I have: do we do anything to account for such things or should the user be responsible for getting to to look "right" for their use case? |
|
Ideally, I think we account for those effects to make everything work as perfectly as possible out of the box. However, those little details can make the job a LOT harder to get to completion, and we don't want to hold up something useful just for that. So I'm willing to merge and if you or someone else is interested in getting the last part "right", we can do that later. "Don't let perfect be the enemy of good" and all that. (I'm about to talk about something similar over on #2420) |
| [np.sin(theta), np.cos(theta)]]) | ||
|
|
||
| # Convert spacing parameter to pixels. | ||
| spacing_px = renderer.points_to_pixels(self._spacing) |
There was a problem hiding this comment.
Does this "blow up" when using a PS/SVG backend that does not have the concept of pixels?
There was a problem hiding this comment.
It's part of the core RendererBase interface. In that case it's basically a noop (returns points).
There was a problem hiding this comment.
Thanks and sorry, I was vague. I was wondering if passing a points value of say 30 would cause the rendered path on SVG to look wildly bad. I've personally struggled with an issue like this attempting to figure out how something will look within matplotlib figure before the renderer is called/known.
There was a problem hiding this comment.
I haven't tried it on this PR, but it's working great on #2420 with the same call.
There was a problem hiding this comment.
OK, thank you! This all is very cool and thanks @nawendt !
|
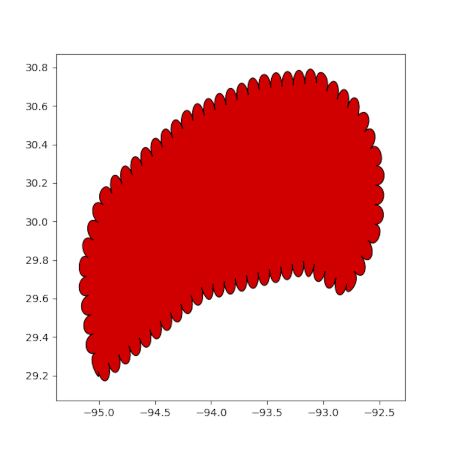
Ok. I have something worked up. I just pulled from this PR since I cannot find my old local copy. I pushed those commits to my fork with the same name. However, it looks like GitHub does not want to link those commits to this PR. I probably worked on this on a computer I no longer use back in the day. Can I do anything about connecting things here or do I have to open a new PR? Also, it looks to me like the all the scaling works as expected. Everything is done in pixels. Things can look a bit odd when zoomed out, but, again, I think matplotlib is doing what it is supposed to. I have attached an example imaged of a scalloped area zoomed out (the settings are the same as the formal test). If I were to try and normalize things, I think it just would look like very small scallops and just look bad for another reason. Anyway, you let me know if we need some more work on the scaling.
|

|
Weird on the GitHub problems. If nothing immediate jumps out, it's fine to just open a new PR and not worth spending value dev minutes debugging it. As far as the scaling goes, what you have above looks great to me and worth including as-is. Again we can always revise in-tree if someone discovers some better matplotlib-fu that makes things look even better. The main questions are always:
Note that "is perfect" appears nowhere in that list. 😉 |
|
I'll also add that I suspect you are going to be using this the most of anyone, so if it's good for your purposes, I think the rest of us will be more than happy. |
|
Cannot recover branch this links to. Closed and continued in #2992. |
Description Of Changes
This commit adds a path effect to make lines drawn appear to be scalloped. This was based off of modifying the matplotlib TickedStroke path effect. This style of line is often used for highlighting areas in SPC MCD products.
Here is an example of what it looks like:
It seemed to make the most sense in the plot._mpl module, but that can be changed if needed.
Checklist