- Products
 Dashboards for smart marketers for real-time view of marketing data across multiple channels.
 20+ integrations across channels such as social advertising, search ads, email marketing more.
 Reporting solution for marketers with multi-client management multi-channel marketing.
 Everything your marketing team needs to impress clients earn more revenue for your agency business.
Dashboards
Dashboards for smart marketers for real-time view of marketing data across multiple channels.
Learn More
Integrations
20+ integrations across channels such as social advertising, search ads, email marketing more.
Learn More
Reports
Reporting solution for marketers with multi-client management multi-channel marketing.
Learn More
Features
Everything your marketing team needs to impress clients earn more revenue for your agency business.
Learn More - Reports
- Dashboards
- Pricing
- Support


 GreyMetrics Knowledgebase
Our detailed knowledgebase contains how to guides for all our features and can help you get started
- Blog
- Products
Dashboards for smart marketers for real-time view of marketing data across multiple channels.
20+ integrations across channels such as social advertising, search ads, email marketing more.
Reporting solution for marketers with multi-client management multi-channel marketing.
Everything your marketing team needs to impress clients earn more revenue for your agency business.
Dashboards
Dashboards for smart marketers for real-time view of marketing data across multiple channels.
Learn More
Integrations
20+ integrations across channels such as social advertising, search ads, email marketing more.
Learn More
Reports
Reporting solution for marketers with multi-client management multi-channel marketing.
Learn More
Features
Everything your marketing team needs to impress clients earn more revenue for your agency business.
Learn More - Reports
- Dashboards
- Pricing
- Support
GreyMetrics Knowledgebase
Our detailed knowledgebase contains how to guides for all our features and can help you get started
- Blog
Every Feature
For Perfect
Reporting
Including multiple templates, insightful dashboards, custom drag and
drop builders, scheduling and report downloading.
Features Designed For You
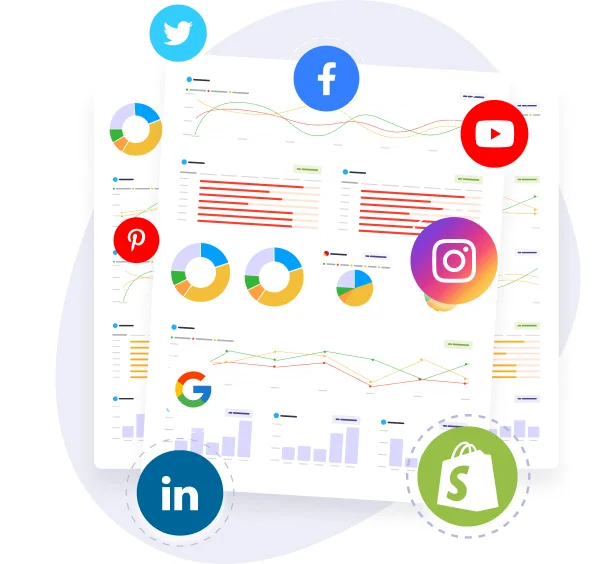
Instagram, Twitter, Mailchimp, Twilio & many more
to help your agency tide over the reporting.


Schedule Reports

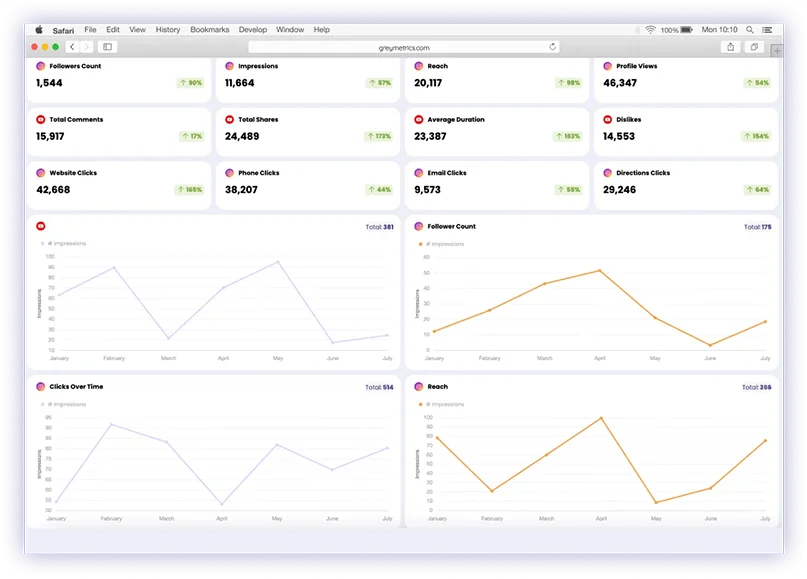
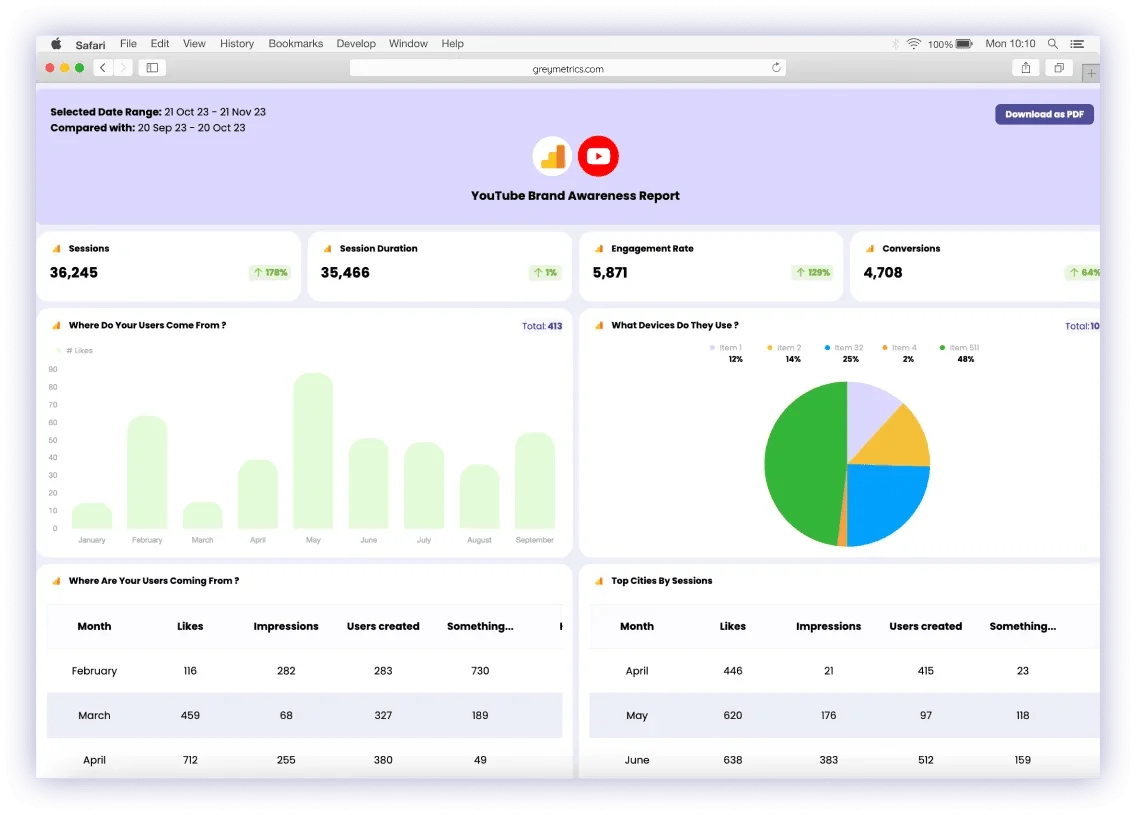
Live Dashboards

Your Way.
reports, mash-up data & share with clients
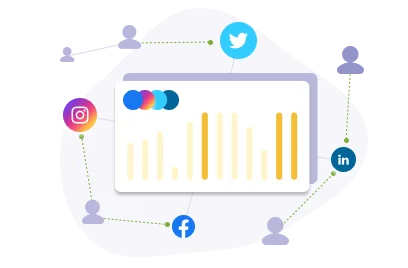
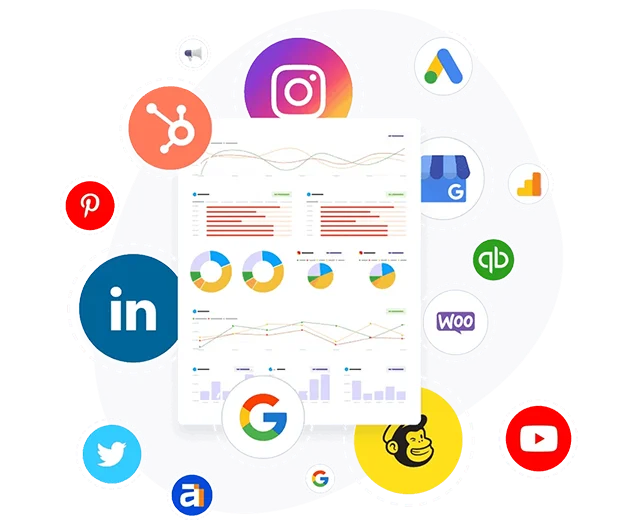
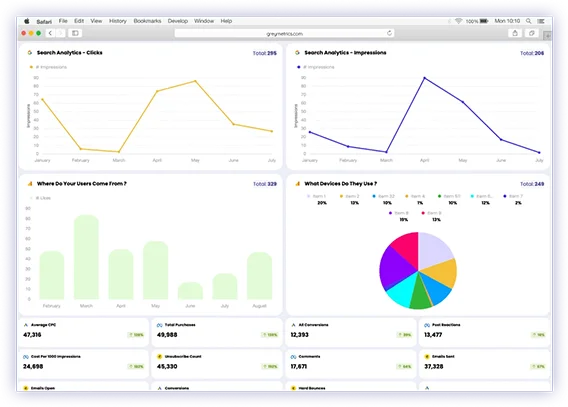
Marketing reports from 20+ marketing
integrations such as Facebook, Google
Ads, Analytics, Instagram, Twitter,
Mailchimp, LinkedIn & more on one
meaningful report.
Enable your marketing team to garner key insights, track KPI’s,
view analytics & measure ad performance with ease. Not to
mention share with clients to wow and impress them.
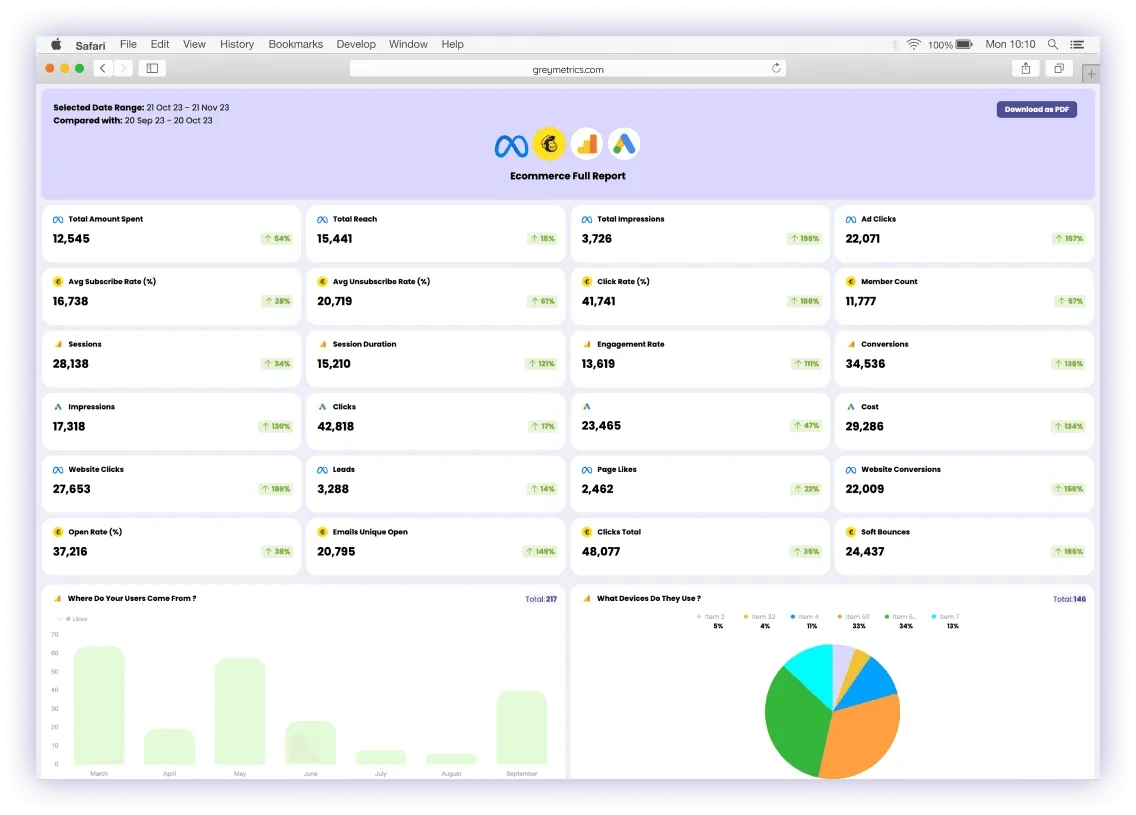
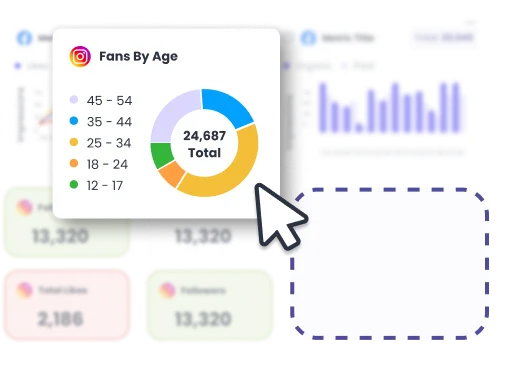
Meaning to Marketing data with compact
& clean dashboards. Designed to add
key KPI’s while making it insightful as
well as pretty.
the needs of every client. Simple, intuitive & easy to use.
No coding knowledge needed to build a custom
dashboard.
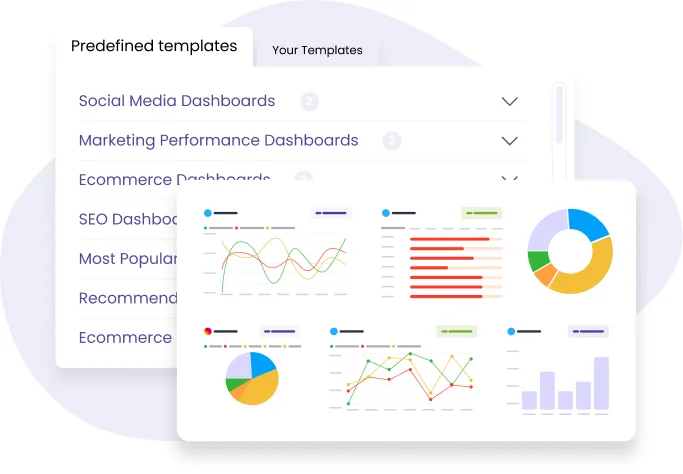
templates created by marketing experts
to help kickstart your client reporting
your marketing analytics simple, straightforward & easy to
start
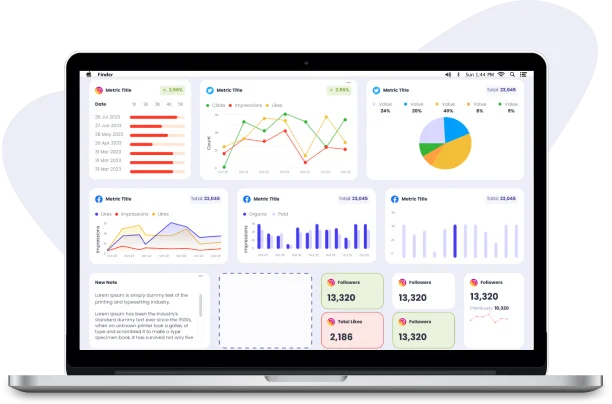
Live Marketing
Dashboards
- Dashboard samples for all integrations
- Monitor data from everywhere
- Build beautiful visualizations, no design skills required

in 9 different languages

No limits. No catch.

GreyMetrics
Dashboards in 9
different
languages

Lorem Ipsum Lorem
Lorem Ipsum
15 days trial.
No limits.
No catch.
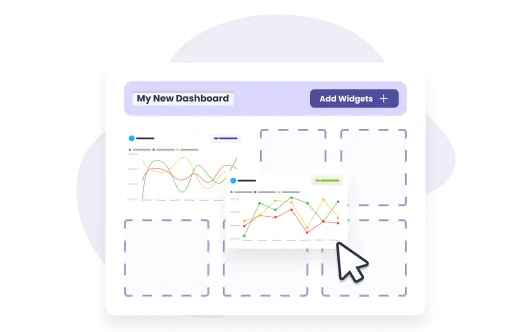
4 Drag & Drop builder
150+ marketing data widgets to add to
your report/dashboard. Select all widgets
you want to report on and add them
Drag & Drop builder to add, move & create the perfect
client report. Dashboard widgets have additional
functionality of resize and position adjust
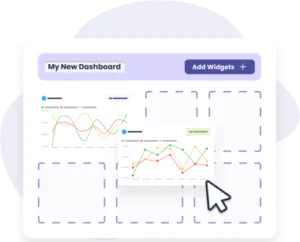
Create your own report or dashboard by
adding widgets. Drag, drop, move &
rename report to make it your own.
Add agency branding to make it your own or even better host
it on your URL. reports.youragency.com? (talk to us)
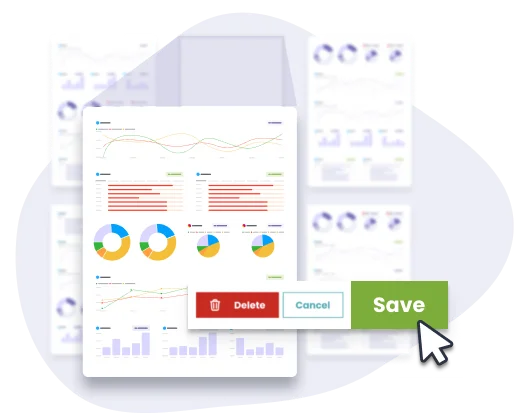
6 Save designs as templates
Create your own report or dashboard &
save them as templates. The templates
are available in your account for re-use.
Reuse saved template to any client & maintain a single
standard on your reporting
Still Not Convinced?
support videos to
get a first hand understanding.
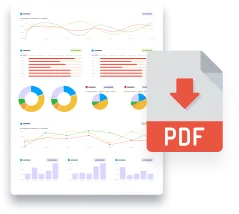
high resolution PDF with all the KPI’s you
choose
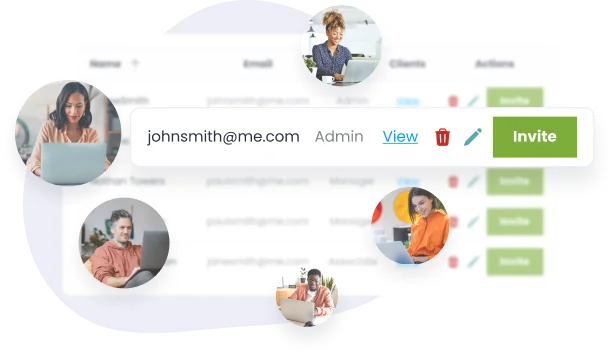
Add your team members and control
which clients & what your team can see
workflows
by scheduling reports
email the report automatically to the clients, so that you
don’t have to remember to log in and do it yourself.