New
Introducing The World’s First AI Infographics Video Maker! 📊✨
Every team has lived this routine: marketing dashboards stacked with KPIs, HR summaries piled with metrics, quarterly reports overflowing with numbers, training evaluations that look like a maze.
We all have the data. What we don’t always have is the time or the design skills to turn it into a story that looks great.
But what if all of that could change instantly?
Imagine taking a raw CSV file and turning it into a complete infographic video with charts, maps, visuals, transitions, animations, and even voiceover in just minutes.
No design experience. No fiddling with templates. No long nights cleaning charts.
Sounds too good to be true? Not anymore.
Introducing Animaker’s AI Infographics Video Generator, the world’s first AI-powered infographic video creator! 🏆
There’s AI for text, AI for images, AI for emails, but AI that transforms your reports into visually stunning infographic videos is a first.
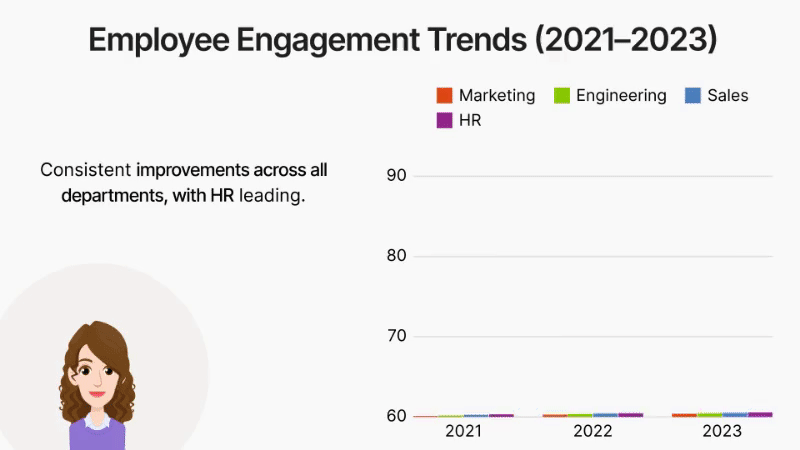
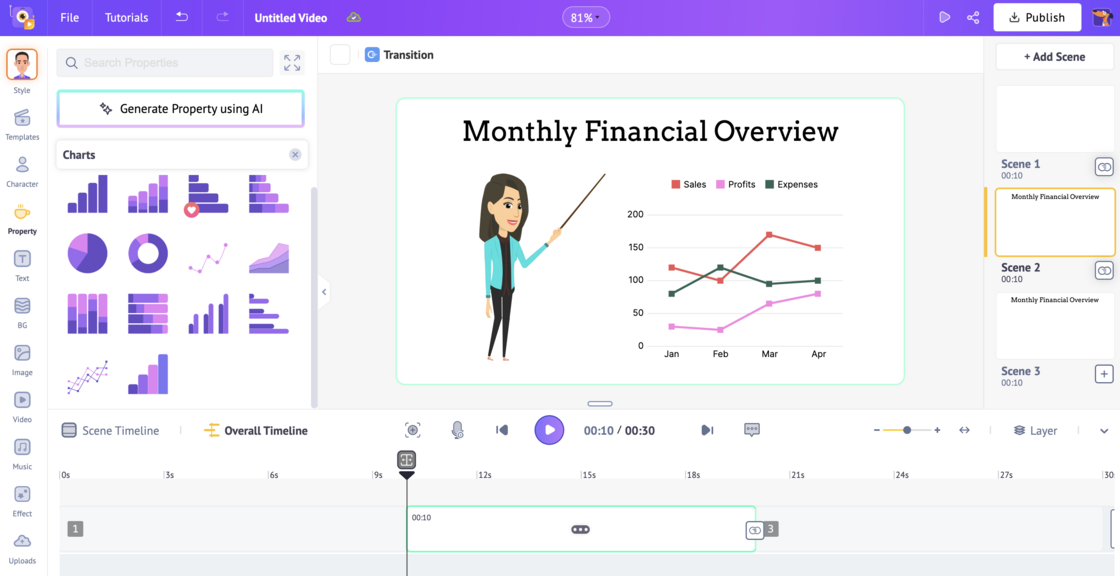
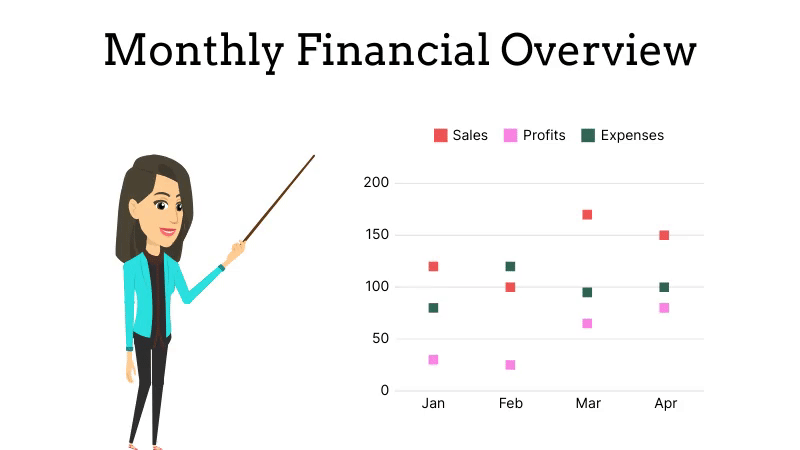
Whether it’s campaign analytics 📈, business updates 🧭, product performance 📊, or HR insights 👥, infographic videos make information both beautiful and memorable.
Why Animaker’s AI Infographics Generator changes everything:
📊 Complete infographic video generated from a simple prompt
📈 Statistical, timeline, comparison, process, and map-based infographics
🗂️ Hierarchical and mixed-media infographic video styles
📁 Auto-visualization from your CSV data
🎙️ Optional AI voiceover in your preferred language
🎼 Background music that matches your theme
⚡ All scenes and transitions generated automatically
🔥 No other tool in the market does all of this automatically
Now that you know what it can do, let’s see how to use it.
🎬 How to Create an Infographic Video with Animaker AI
Turning your data into a visual story is now easier than making a spreadsheet. Here’s how it works:
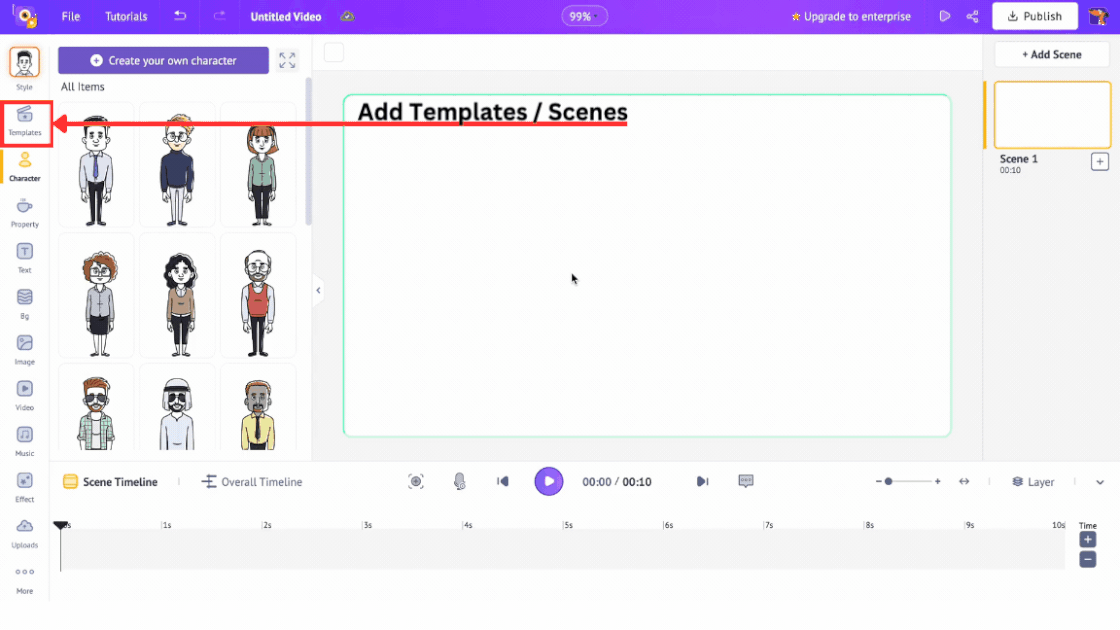
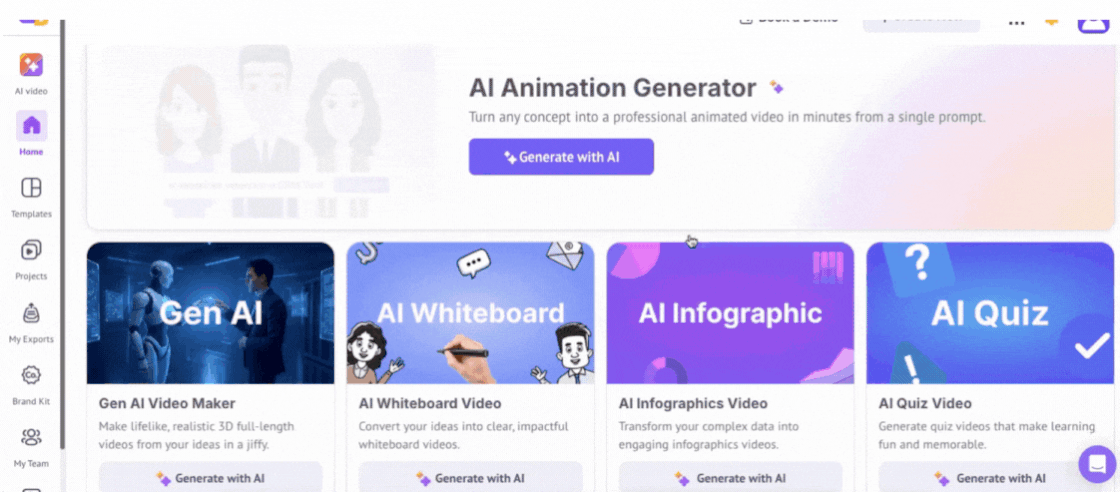
Step 1: Open the AI Infographics Generator
Log into your Animaker dashboard and click the AI Infographics Generator tile. This tells the system you’re ready to convert a report into an infographic video.
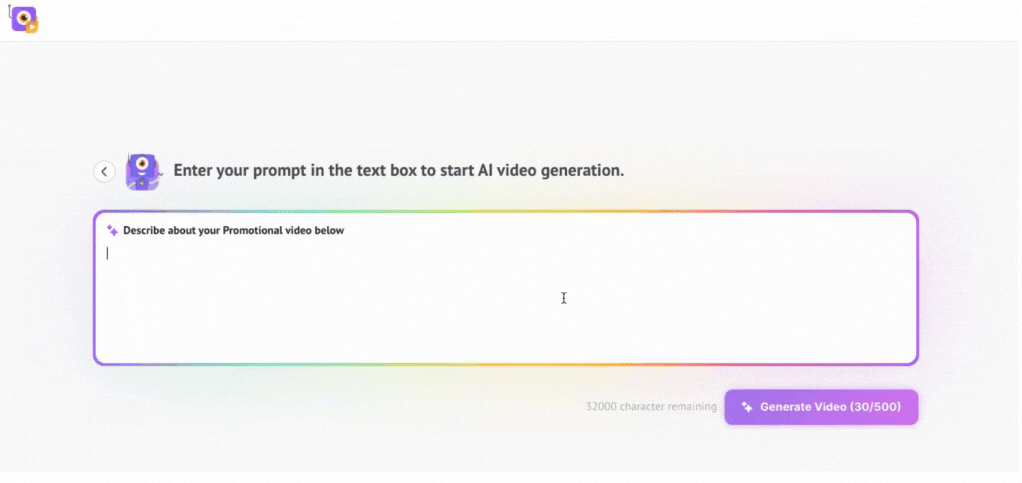
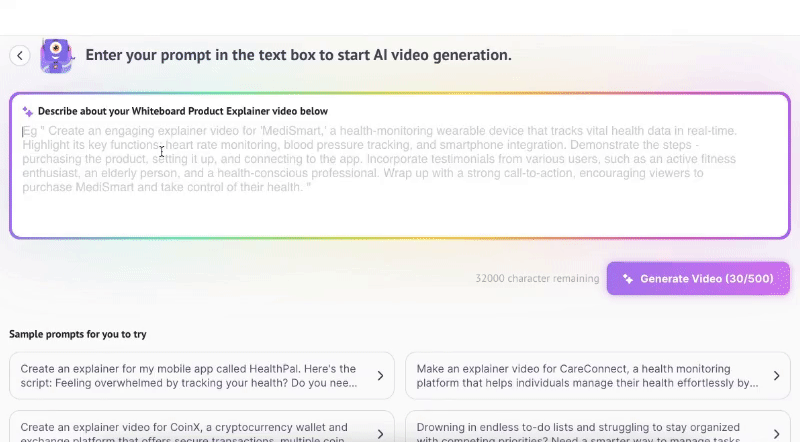
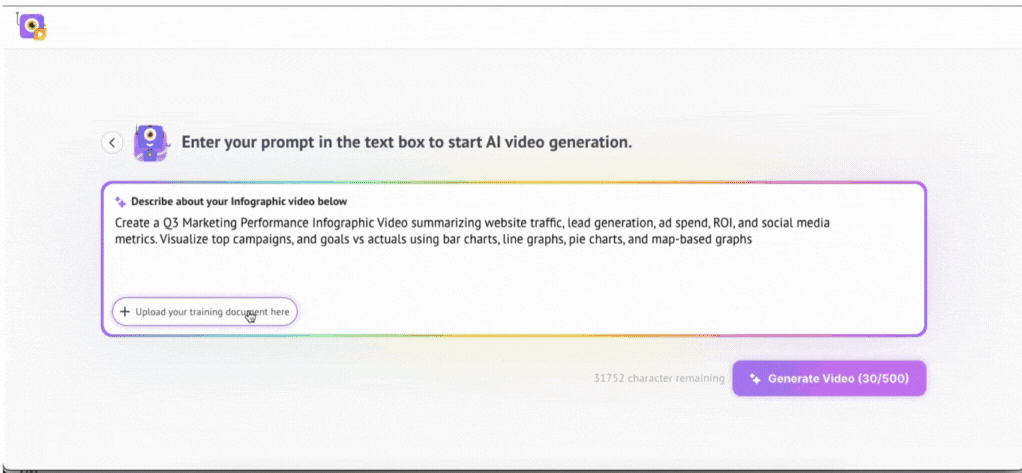
Step 2: Describe Your Report
In the prompt box, type what you want the infographic video to show.
For example: “Create a Q3 Marketing Performance Infographic Video summarizing website traffic, lead generation, ad spend, ROI, and social media metrics. Visualize top campaigns, and goals vs actuals using bar charts, line graphs, pie charts, and map-based graphs.”
This helps the AI understand the story behind your data.
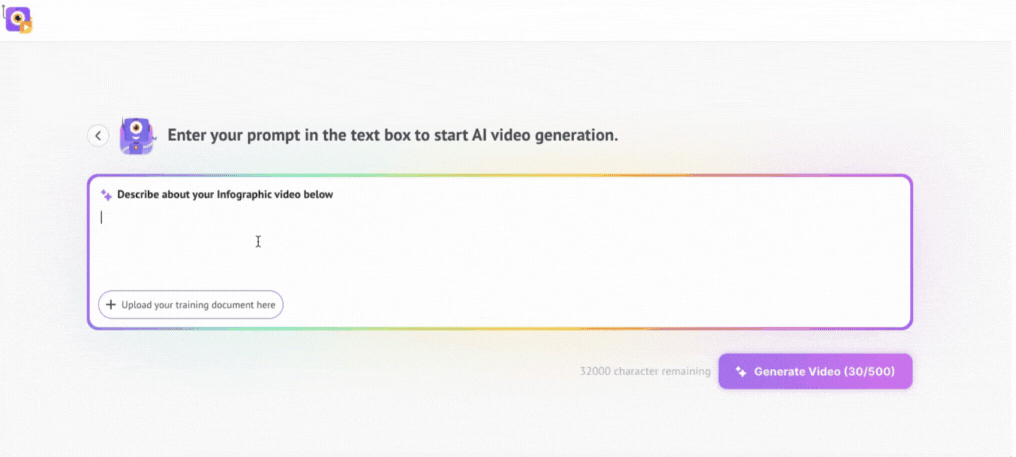
Step 3: Upload Your CSV Data
Upload the dataset you want visualized, whether it is marketing, HR, operations, training, or anything else.
The AI will instantly scan the CSV and match it to the visuals your prompt describes.
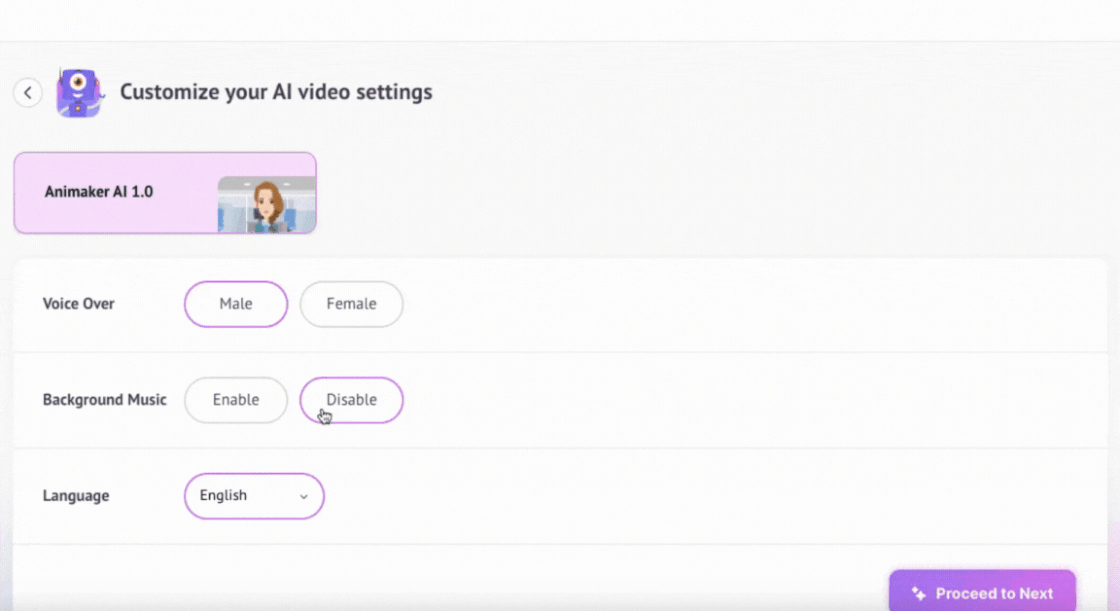
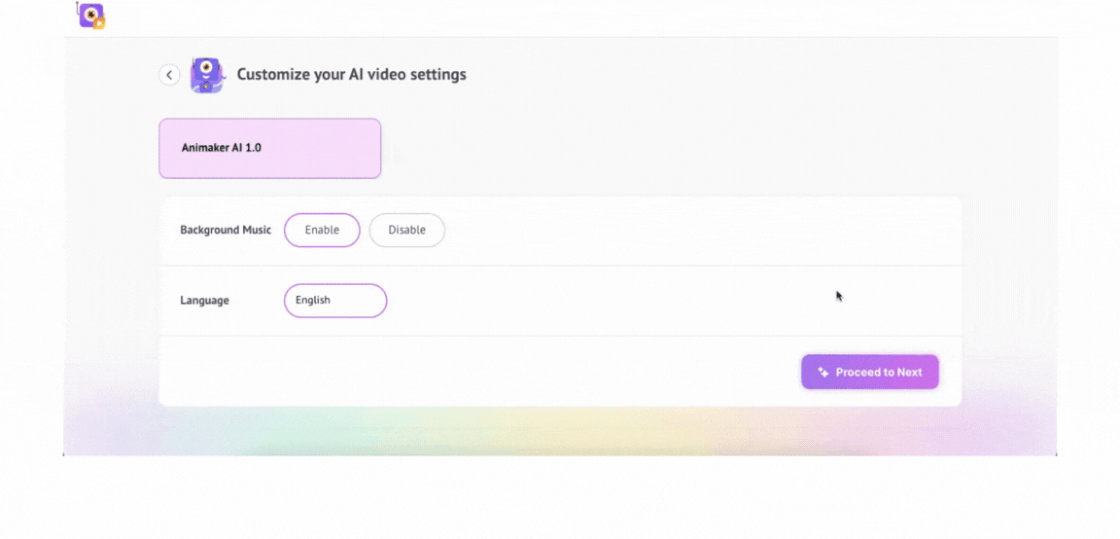
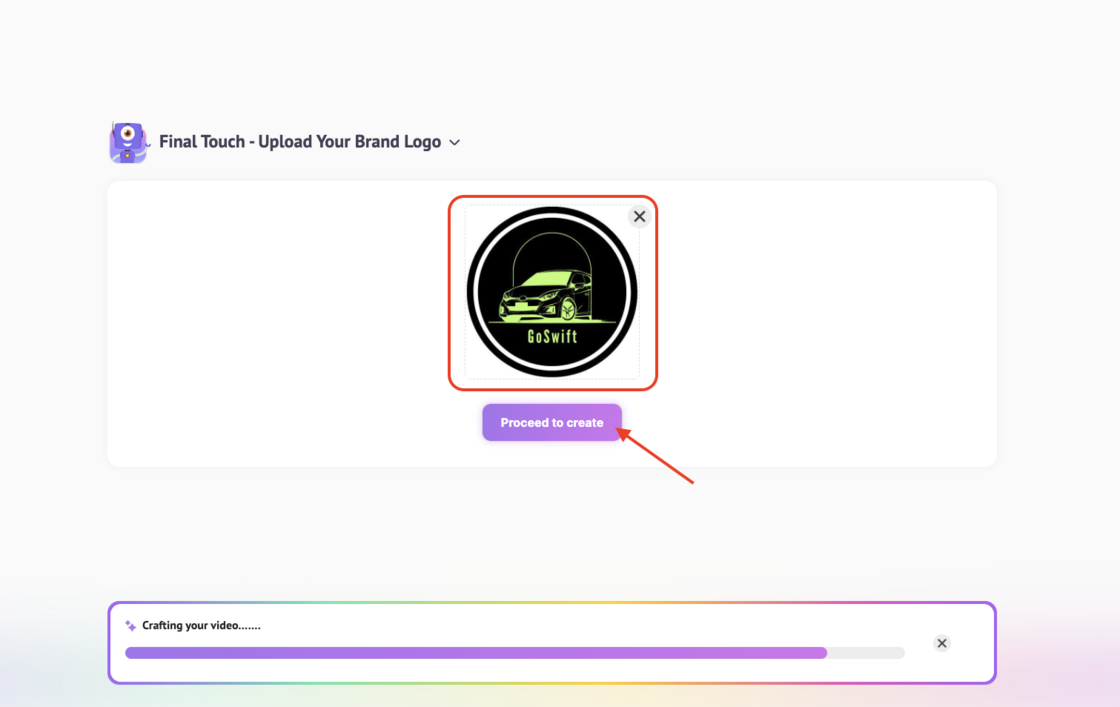
Step 4: Choose Your Settings
Customize your output effortlessly:
Select your preferred language
Toggle voiceover on or off
Add background music if needed
Step 5: Hit Generate and Watch Your Infographic Video Come Alive
The AI processes your prompt and your CSV and builds a complete infographic video.
Charts. Maps. Icons. Layouts. Animations. All generated automatically.
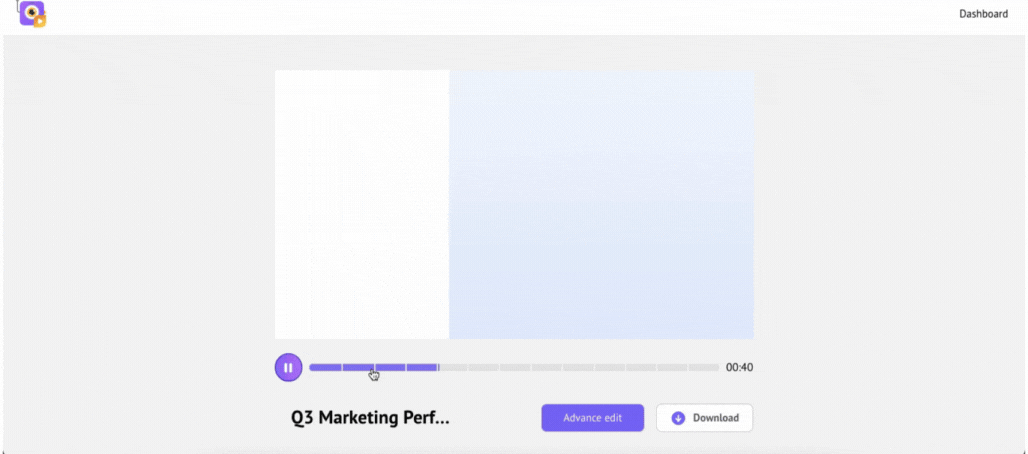
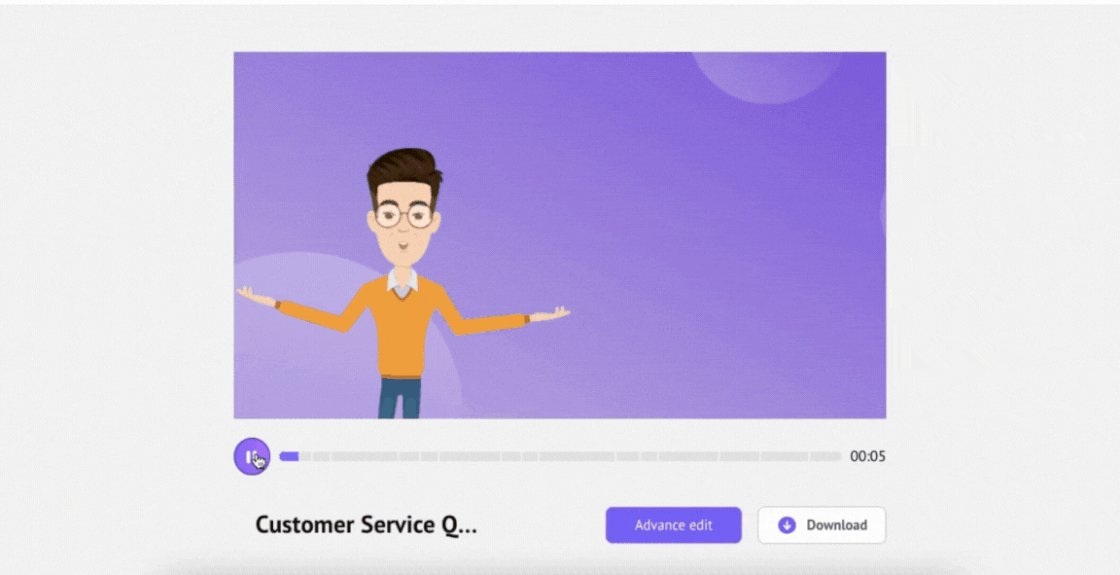
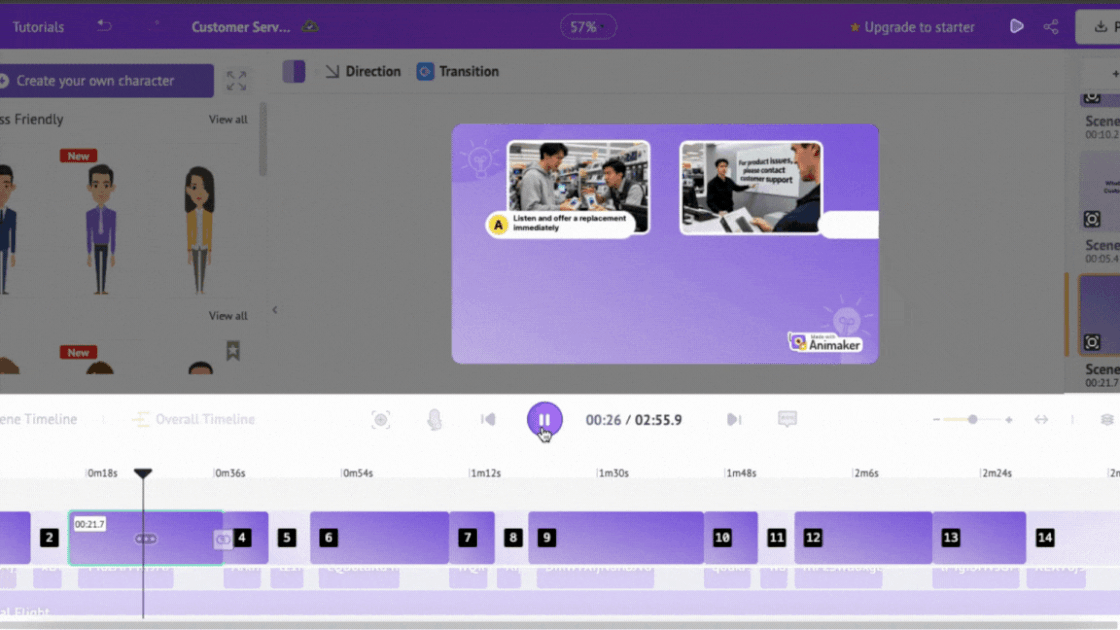
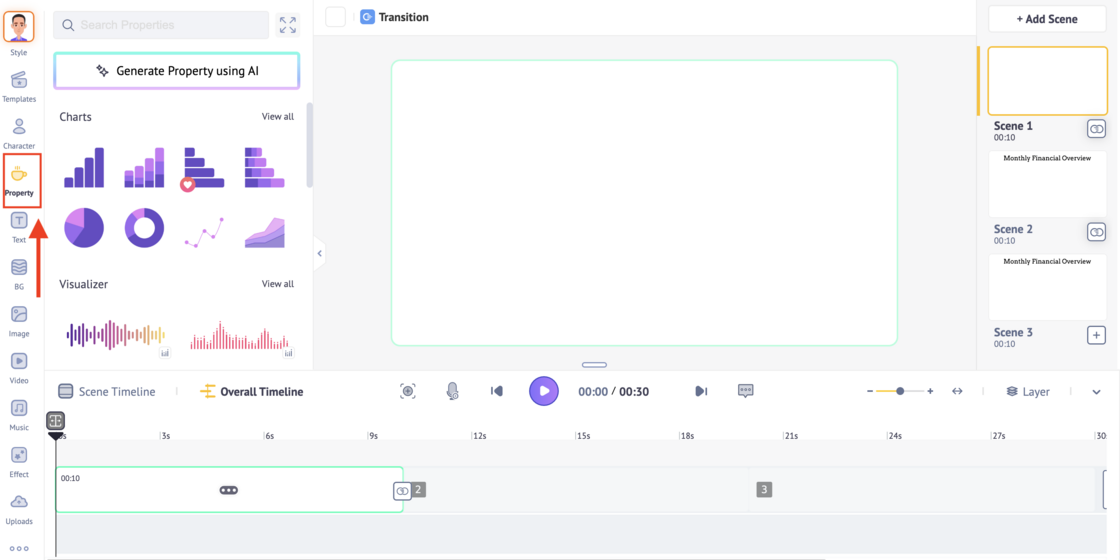
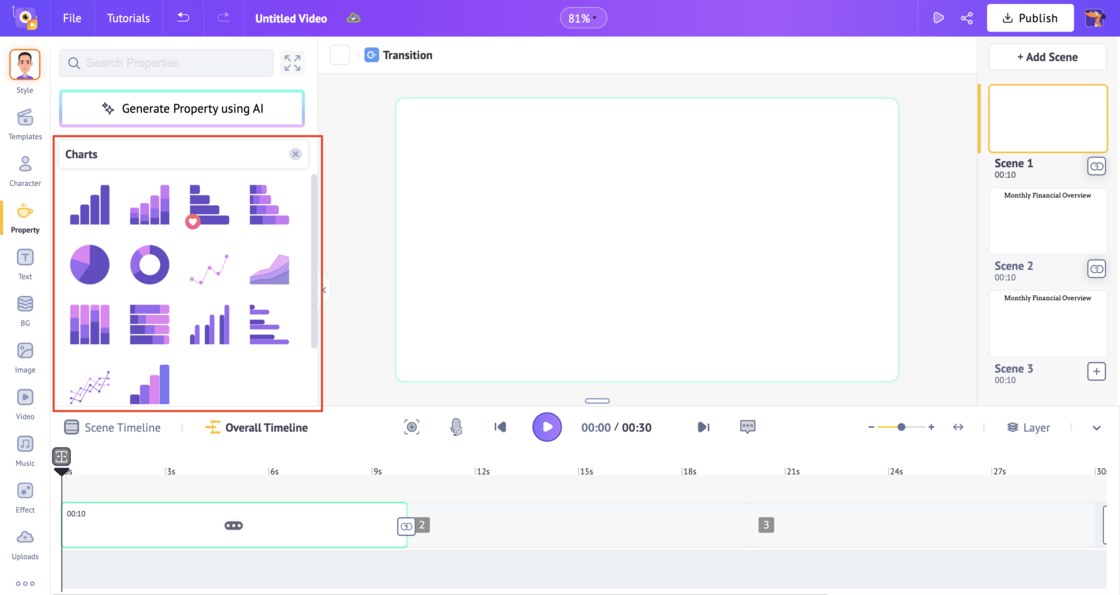
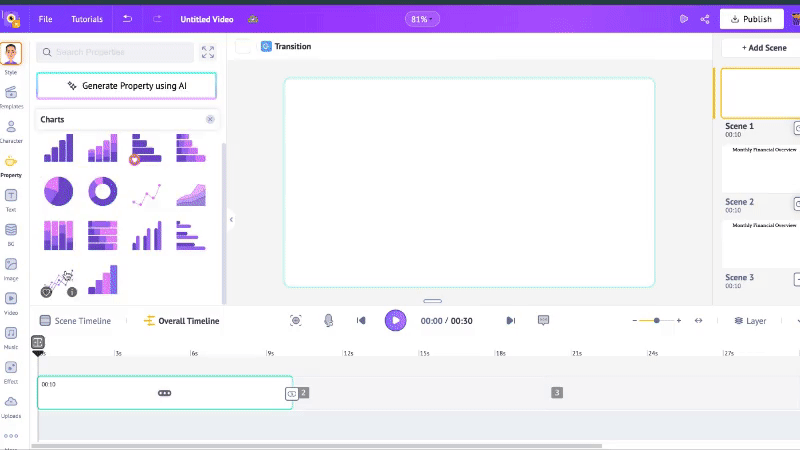
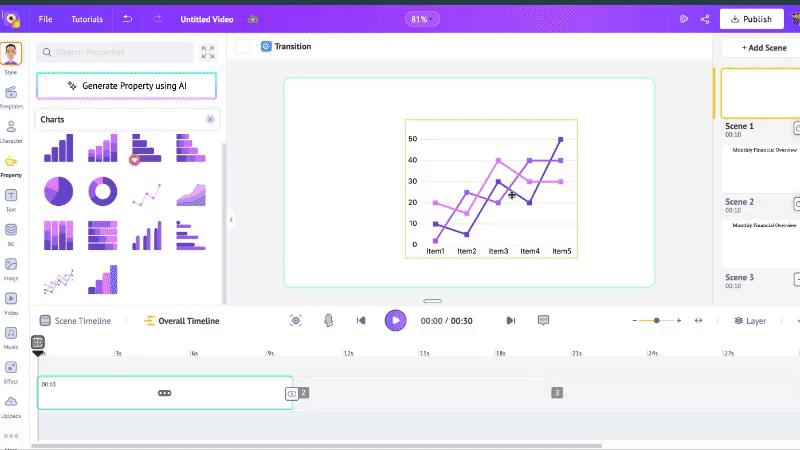
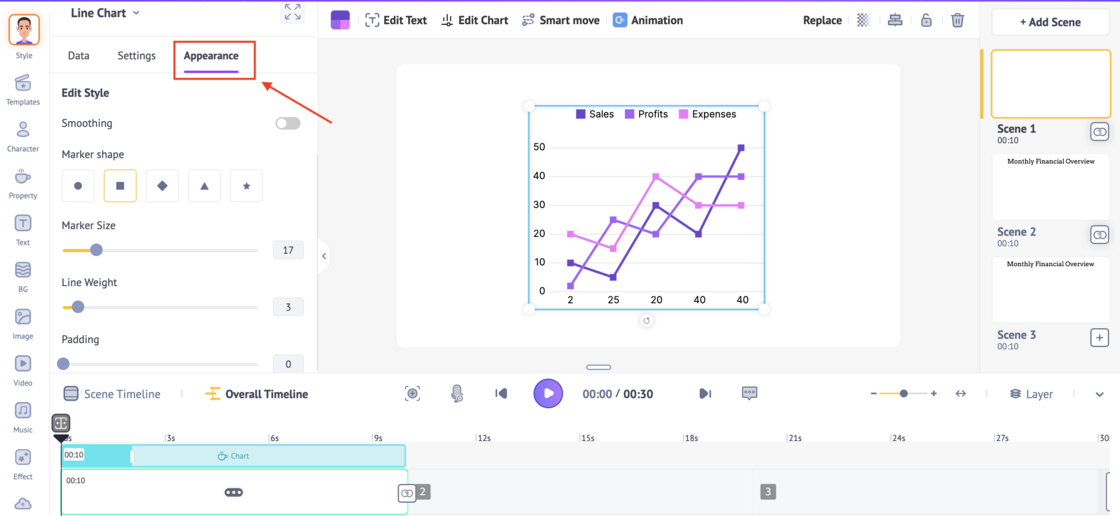
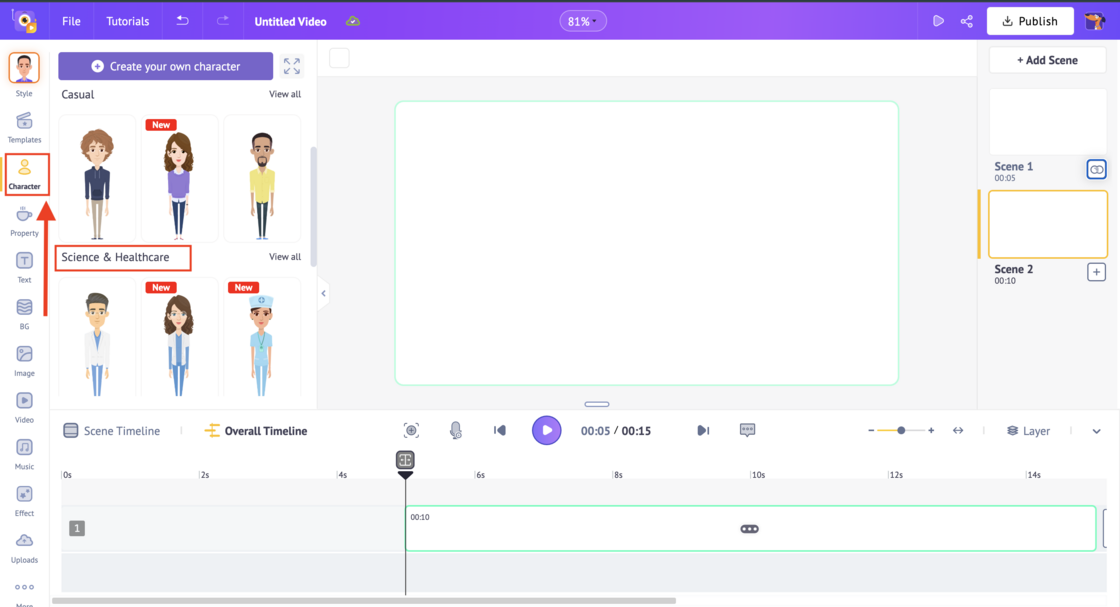
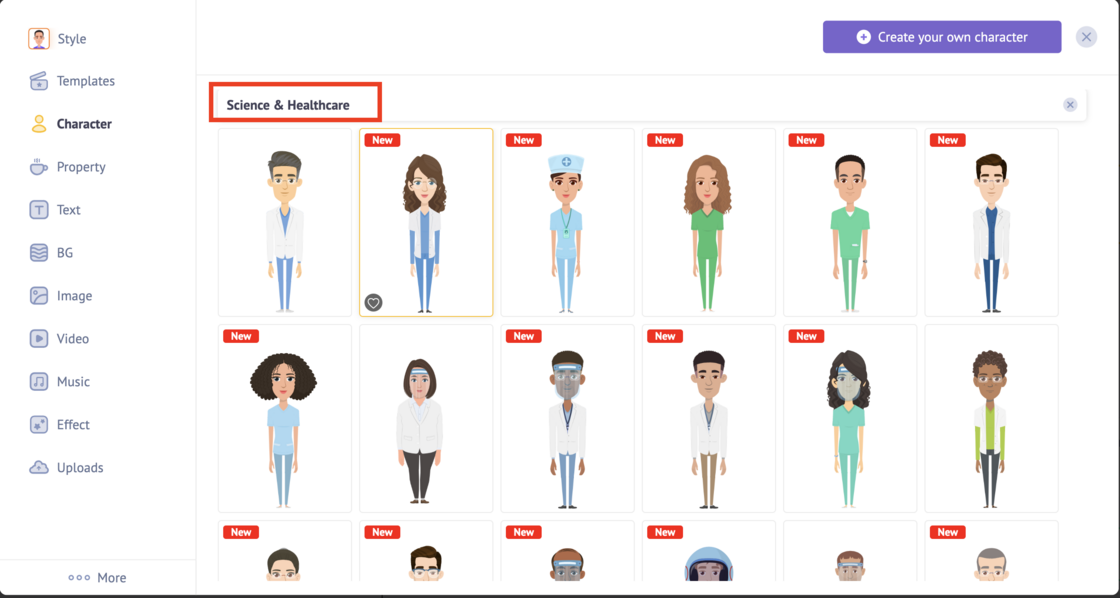
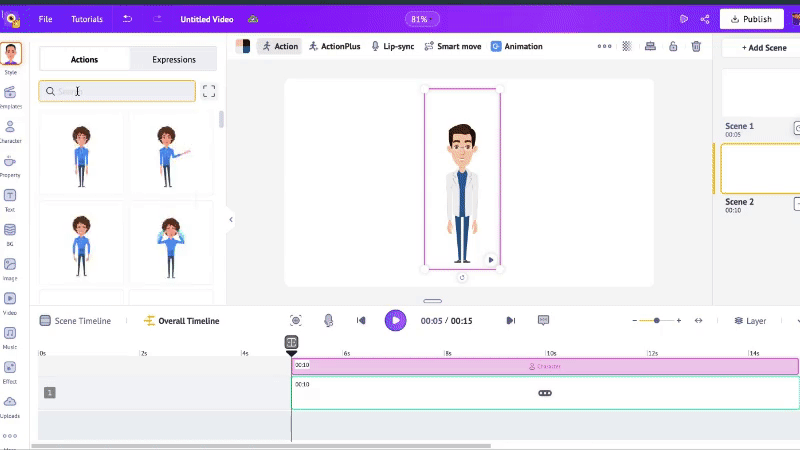
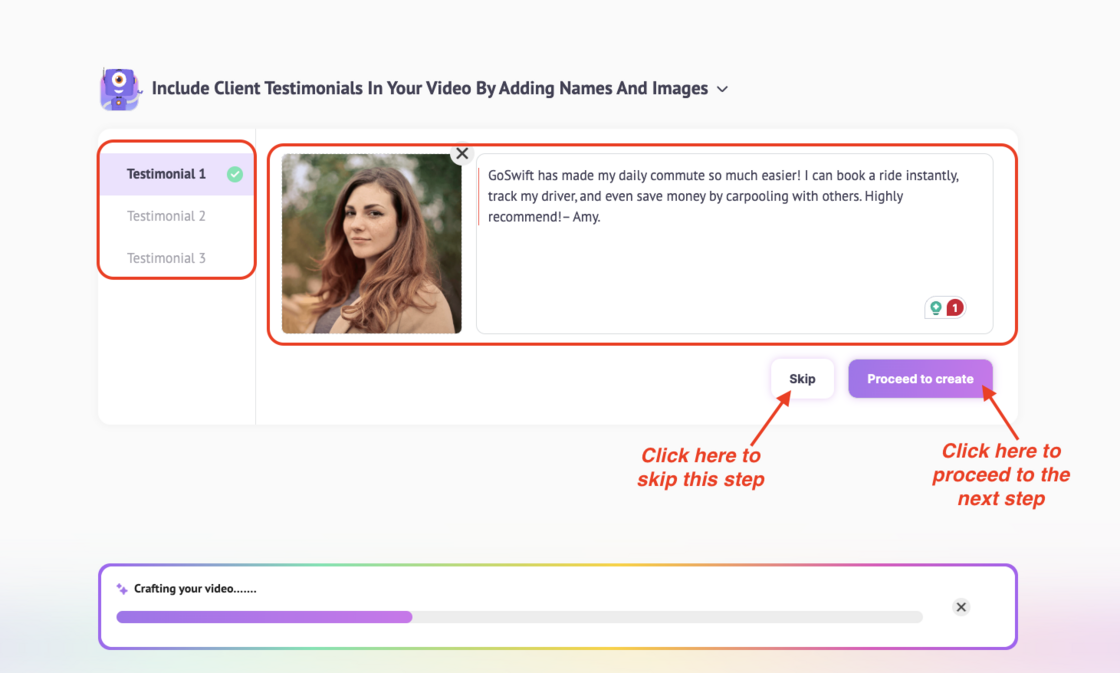
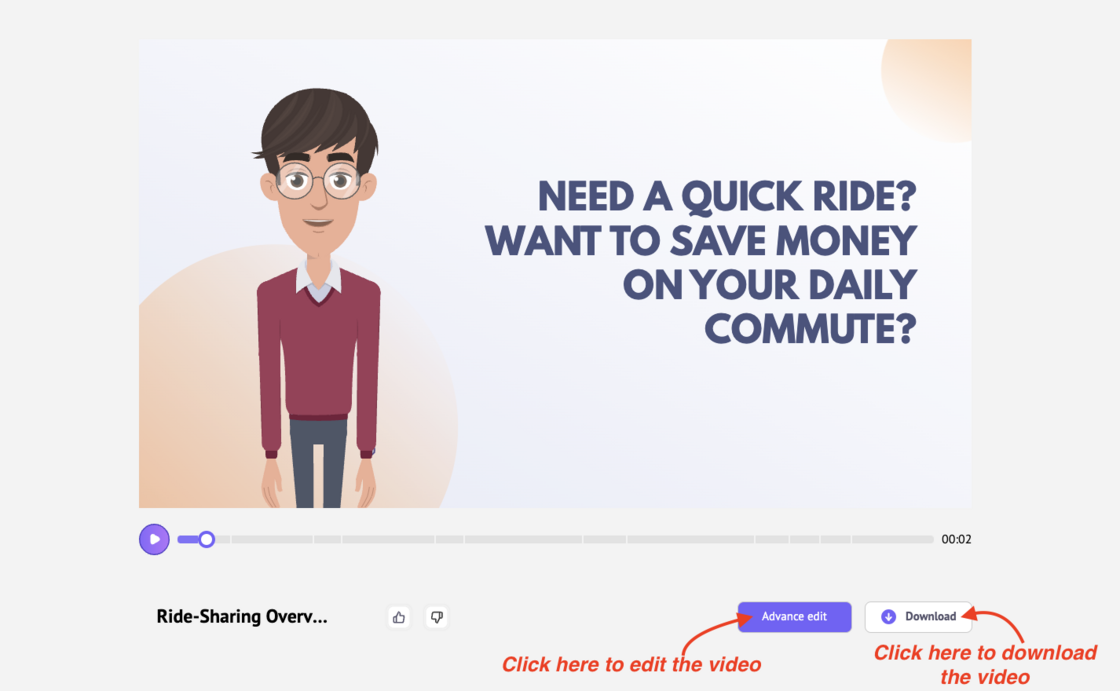
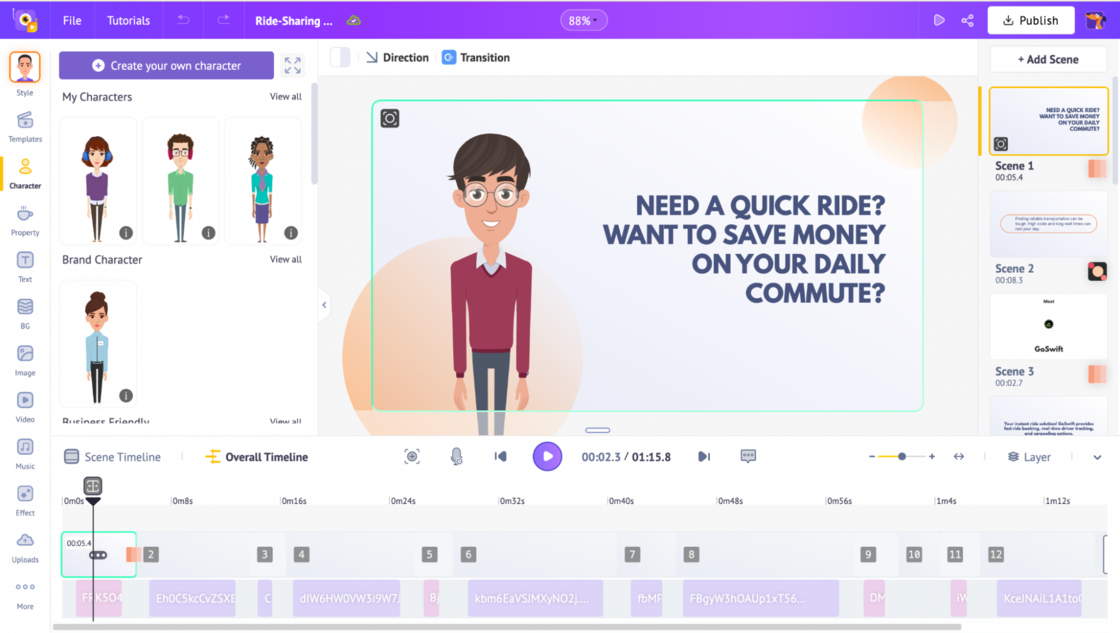
When the video is ready, click Download to save it, or choose Advanced Edit to fine-tune scenes, charts, colors, characters, animations, or timing.
In Advanced Edit, the project opens in Animaker’s workspace and gives you full freedom to tweak or extend the video.
And just like that, in only a few steps, you’ve created a polished infographic video from raw data.
Pretty incredible, right?
Animaker’s AI Infographics Generator isn’t just a faster tool. It is a completely new way to turn data into stories. Beautiful, automated, and unbelievably simple.
The future of reporting is here, and it looks stunning.
Start creating your first AI Infographic Video today! 🚀