- English (USA)
- English (UK)
- English (India)
- English (Canada)
- English (Australia)
- English (South Africa)
- English (Nigeria)
- Deutsch
- Español (España)
- Español (México)
- Français
- Italiano
- Nederlands
- Polski
- Português (Portugal)
- Português (Brasil)
- Русский
- Türkçe
- العربية
- Ελληνικά
- Svenska
- Suomi
- עברית
- 日本語
- 한국어
- 简体中文
- 繁體中文
- Bahasa Indonesia
- Bahasa Melayu
- ไทย
- Tiếng Việt
- हिंदी


Name | Last | High | Low | Chg. | Chg. % | Time |
|---|---|---|---|---|---|---|
| 6,135.06 | 6,135.06 | 6,063.50 | +82.14 | +1.36% | ||
| 3,517.05 | 3,517.05 | 3,476.62 | +43.81 | +1.26% | ||
| 48,239.83 | 48,275.63 | 47,853.04 | +176.54 | +0.37% | ||
| 6,847.73 | 6,894.86 | 6,825.35 | +2.23 | +0.03% | ||
| 23,236.82 | 23,585.96 | 23,134.69 | -5.17 | -0.02% | ||
| 2,498.30 | 2,501.92 | 2,476.97 | +16.39 | +0.66% | ||
| 14.58 | 15.42 | 14.57 | -0.37 | -2.47% | ||
| 31,794.42 | 31,882.97 | 31,688.17 | +81.66 | +0.26% | ||
| 160,376 | 161,957 | 160,225 | -750 | -0.47% | ||
| 63,992.37 | 65,090.03 | 63,954.21 | -315.92 | -0.49% |
| Aa Aa | 7.1100 | +35.85% | 9.6589 | Great | Great | Great | Good | Strong Buy | 5.05 | 4.07 | 49.14B | 0.08 |
| Aaaaaa Aa Aaa | 299.800 | +30.21% | 390.370 | Great | Excellent | Great | Excellent | - | 10.35 | 6.35 | 84.47B | 0.36 |
| Aaaaaaaaaaaa A | 1,600.00 | +28.62% | 2,057.92 | Good | Fair | Fair | Great | Buy | 11.44 | 6.86 | 228.84B | 0.02 |
| Aaaaaa Aa | 1.400 | +25.70% | 1.760 | Excellent | Great | Excellent | Excellent | - | 5.26 | 3.84 | 13.36B | 0.72 |
| Aaa Aaaaaaaaaaaaa | 4.000 | +20.75% | 4.830 | Fair | Weak | Fair | Great | Buy | 11.08 | 10.39 | 27.5B | 0.04 |
| Aa Aaaaa Aa | 2.110 | +20.57% | 2.544 | Great | Great | Great | Great | Buy | 3.23 | 5.22 | 67.6B | 0.11 |
| A Aaaaaaaaaa | 4.440 | +20.52% | 5.351 | Good | Fair | Good | Good | Buy | 7.02 | 11.03 | 8.21B | 10.94 |
| Aaaaaaaaaa Aaaaaa | 8.250 | +17.41% | 9.686 | Great | Good | Good | Good | Buy | 3.31 | 7.16 | 71.99B | 0.16 |
| Aaaaaa Aa Aa Aa | 10.680 | +12.87% | 12.055 | Great | Good | Fair | Great | Strong Buy | 8.95 | 6.08 | 139.94B | 0.40 |
| Aaa Aaaa Aa Aaa | 41.750 | +11.29% | 46.464 | Good | Weak | Great | Great | Buy | 9.12 | 8.16 | 119.2B | 0.21 |
Economic
Earnings
Key Economic Events | |||||||
USD | |||||||
USD | |||||||
CNY | Caixin Services PMI (Dec) Cons: 52 Prev.: 52.1 | ||||||
CHF | procure.ch Manufacturing PMI (Dec) Prev.: 49.7 | ||||||
EUR | Spanish Unemployment Change (Dec) Prev.: -18.8K | ||||||
USD | Construction Spending (MoM) (Oct) Cons: -0.10% Prev.: 0.20% | ||||||
Recently Released Key Economic Events | |||||||
USD | S&P Global Manufacturing PMI (Dec) Act: 51.8 Cons: 51.8 Prev.: 52.2 | ||||||
Momentum Masters
PH3 Month Return+40.7%
RiskMed
Insider Favorites
PH3 Month Return+21.9%
RiskLow
Bullish Stocks
PH3 Month Return+10.1%
RiskLow
Small-Cap Growth Rockets
PH3 Month Return+8.6%
RiskLow
Free Cash Flow Champions
PH3 Month Return+8.4%
RiskLow
Micro Cap Stocks
PH3 Month Return+8.3%
RiskLow
Earnings Quality Stars
PH3 Month Return+7.7%
RiskLow
Piotroski's Picks
PH3 Month Return+7.1%
RiskLow
Near 52-Week High
PH3 Month Return+6.4%
RiskLow
Financial Fortresses
PH3 Month Return+5.1%
RiskLow

Tech Titans
Stay ahead of the latest tech trends with our algorithmically-selected portfolio of the 15 top tech stocks each month.
S&P 500 Outperformance+2,329.1%
Annualized Return+29.3%
Stocks in this strategy
AAA:AAAA
aaa aaaaaaa aaaa aaaaaaaaaaa
AAA:AAAA
aaa aaaaaaa aaaa aaaaaaaaaaa
AAA:AAAA
aaa aaaaaaa aaaa aaaaaaaaaaa
AAA:AAAA
aaa aaaaaaa aaaa aaaaaaaaaaa
World Indices
Name | Last | Chg. | Chg. % | |
|---|---|---|---|---|
| 48,239.83 | +176.54 | +0.37% | ||
S&P 500derived | 6,847.73 | +2.23 | +0.03% | |
DAXderived | 24,523.83 | +33.42 | +0.14% | |
| 8,727.80 | +13.50 | +0.15% | ||
Hang Sengderived | 26,338.47 | +707.93 | +2.76% | |
| 3,968.84 | +3.72 | +0.09% | ||
Nikkei 225derived | 50,339.48 | -187.44 | -0.37% |
Indices Futures
Name | Month | Last | Chg. % | |
|---|---|---|---|---|
| Mar 26 | 48,483.00 | +0.30% | ||
| Mar 26 | 6,892.50 | 0.00% | ||
| Mar 26 | 25,386.00 | -0.28% | ||
Nikkei 225derived | Mar 26 | 50,852.5 | +0.58% | |
China A50derived | Jan 26 | 15,450.0 | +1.09% | |
Singapore MSCIderived | Jan 26 | 447.75 | +0.56% |
Commodities
Name | Month | Last | Chg. % | |
|---|---|---|---|---|
Crude Oil WTIderived | Feb 26 | 57.10 | -0.56% | |
Brent Oilderived | Mar 26 | 60.50 | -0.58% | |
Natural Gasderived | Feb 26 | 3.693 | +0.19% | |
Goldderived | Feb 26 | 4,338.90 | -0.05% | |
Copperderived | Mar 26 | 5.7155 | +0.59% | |
US Cotton #2derived | Mar 26 | 63.91 | -0.56% |
Leading Stocks
Name | Last | Chg. | Chg. % | |
|---|---|---|---|---|
| 122.13 | +1.79 | +1.48% | ||
| 156.51 | +9.93 | +6.77% | ||
| 441.74 | -7.98 | -1.77% | ||
| 651.36 | -8.73 | -1.32% | ||
| 313.54 | +0.54 | +0.17% | ||
| 269.97 | -1.89 | -0.70% |
ETFs
Name | Last | Chg. | Chg. % | |
|---|---|---|---|---|
| 682.20 | +0.28 | +0.04% | ||
| 612.82 | -1.49 | -0.24% | ||
| 685.29 | +0.35 | +0.05% | ||
| 9.31 | +0.20 | +2.20% | ||
| 32.18 | +0.41 | +1.29% | ||
| 34.88 | +0.46 | +1.34% |
Financial Futures
Name | Month | Last | Chg. % | |
|---|---|---|---|---|
| Mar 26 | 112.25 | -0.17% | ||
| Mar 26 | 115.03 | -0.49% | ||
UK Giltderived | Mar 26 | 90.73 | -0.70% | |
Euro Bundderived | Mar 26 | 127.11 | -0.38% | |
Euro BTPderived | Mar 26 | 119.66 | -0.41% | |
Japan Govt. Bondderived | Mar 26 | 132.05 | -0.34% |
Philippines Stocks
Name | Last | Chg. | Chg. % | |
|---|---|---|---|---|
| 22.550 | +0.100 | +0.45% | ||
| 55.30 | +0.30 | +0.55% | ||
| 139.00 | +4.40 | +3.27% | ||
| 183.40 | +3.40 | +1.89% | ||
| 118.60 | +2.50 | +2.15% | ||
| 24.700 | +1.050 | +4.44% |
Philippines Indices
Name | Last | Chg. | Chg. % | |
|---|---|---|---|---|
| 6,135.06 | +82.14 | +1.36% | ||
| 3,517.05 | +43.81 | +1.26% | ||
| 2,095.59 | +47.12 | +2.30% | ||
| 8,773.06 | +152.47 | +1.77% | ||
| 2,354.53 | -24.01 | -1.01% |
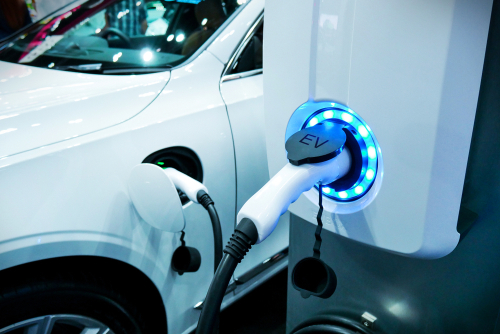
Find the top EV stocks. Assess the performance across a wide range of electric vehicle stocks, including the top performing EV charging and battery stocks.

Discover the top AI stocks for 2024, compare the stock prices. Invest in the future of technology today.

Discover the newly approved Bitcoin ETFs. Assess the performance across the various ETFs and stay informed about the latest options for investing in bitcoin.
Install Our App
Risk Disclosure: Trading in financial instruments and/or cryptocurrencies involves high risks including the risk of losing some, or all, of your investment amount, and may not be suitable for all investors. Prices of cryptocurrencies are extremely volatile and may be affected by external factors such as financial, regulatory or political events. Trading on margin increases the financial risks.
Before deciding to trade in financial instrument or cryptocurrencies you should be fully informed of the risks and costs associated with trading the financial markets, carefully consider your investment objectives, level of experience, and risk appetite, and seek professional advice where needed.
Fusion Media would like to remind you that the data contained in this website is not necessarily real-time nor accurate. The data and prices on the website are not necessarily provided by any market or exchange, but may be provided by market makers, and so prices may not be accurate and may differ from the actual price at any given market, meaning prices are indicative and not appropriate for trading purposes. Fusion Media and any provider of the data contained in this website will not accept liability for any loss or damage as a result of your trading, or your reliance on the information contained within this website.
It is prohibited to use, store, reproduce, display, modify, transmit or distribute the data contained in this website without the explicit prior written permission of Fusion Media and/or the data provider. All intellectual property rights are reserved by the providers and/or the exchange providing the data contained in this website.
Fusion Media may be compensated by the advertisers that appear on the website, based on your interaction with the advertisements or advertisers.
© 2007-2026 - Fusion Media Limited. All Rights Reserved.