Mô tả
This plugin can represent tabular numeric data, functions or some kinds of quality structure and provides different info.
Features
- Fully Customizable: All the options you need to arrange the showcase to your liking are available here.
- Different Types: Chart block comes with different types, you can easily switch the type of chart.
How to use
- First, install the Chart Block plugin
- Add the Chart Block from the block category called “Widgets” in the Gutenberg editor.
- You can change block settings from the right-side settings sidebar.
-
Enjoy!
-
For Installation help click on Installation Tab
Feedback
- Did you like this plugin? Dislike it? Do you have a feature request? Please share your feedback with us
Check out the Parent Plugin of this plugin-
B Blocks – A blocks collection and page building tool for Gutenberg.
Check out our other WordPress Plugins-
Html5 Video Player – Display videos as single and playlist in multiple skins.
PDF Poster – Display/Embed PDF files with different styles.
Html5 Audio Player – Listen audios with awesome visuals.
StreamCast – Customizable radio player with different skins.
3D Viewer – Embed 3D models and 3D products with interaction.
Advanced Post Block – Show posts and custom posts in different layouts.
Ảnh màn hình
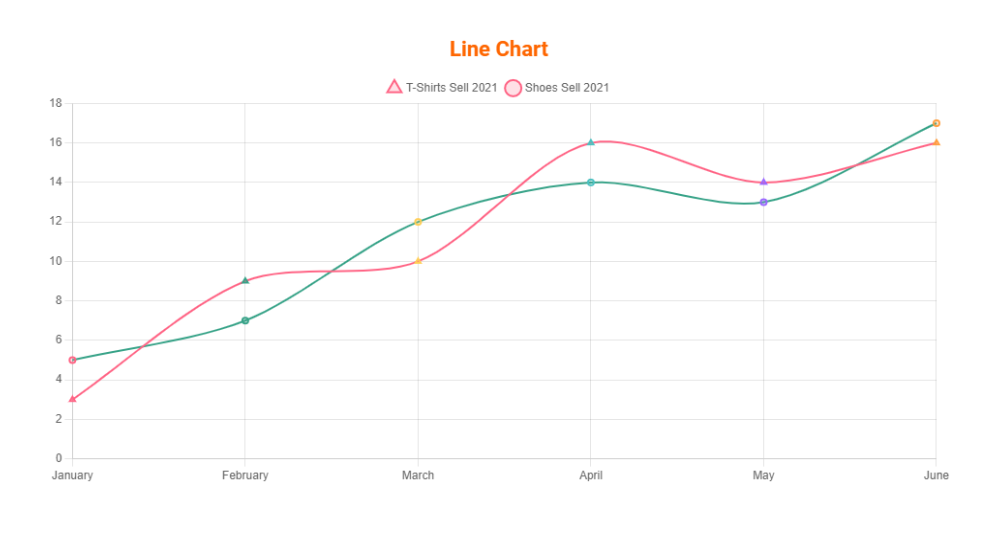
Line Chart 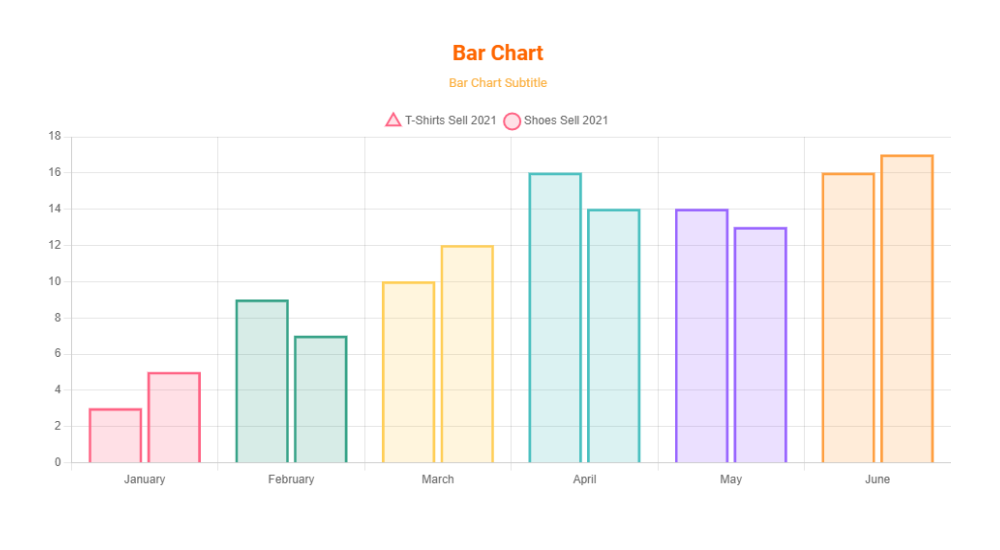
Bar Chart with Subtitle 
Pie Chart with Text, Background and Grid line color 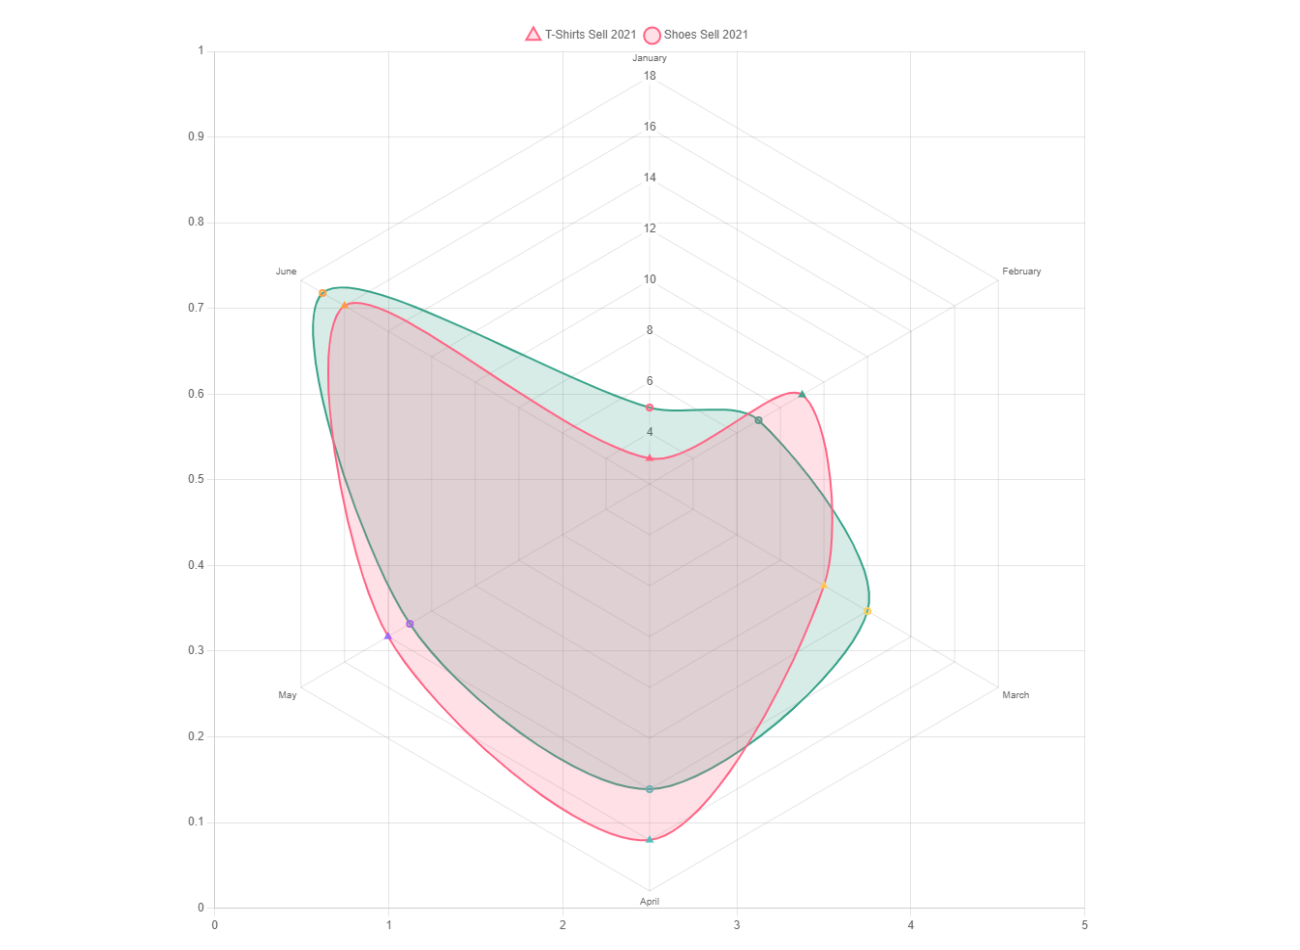
Rader Chart without Title 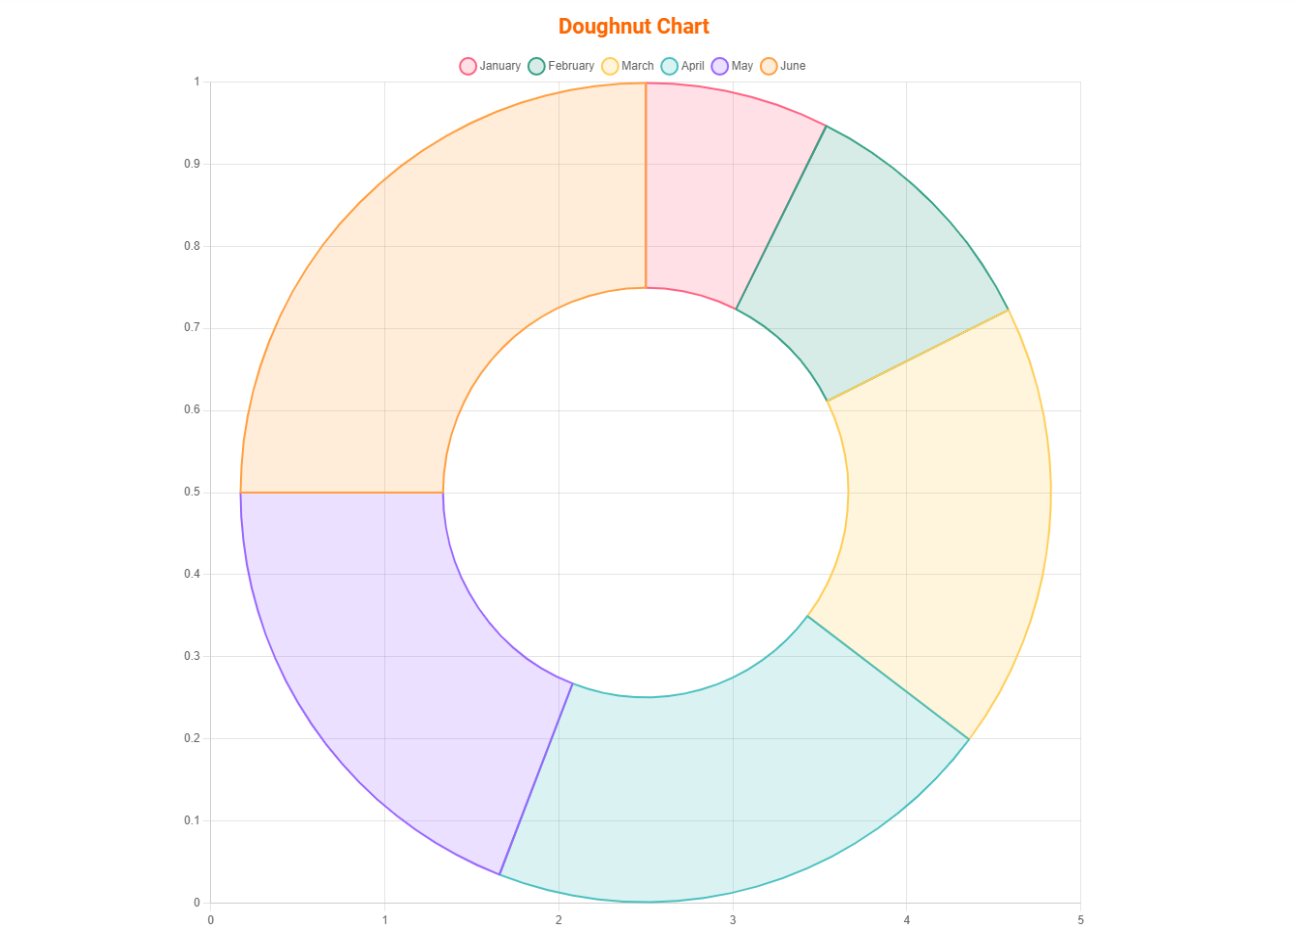
Doughnut Chart 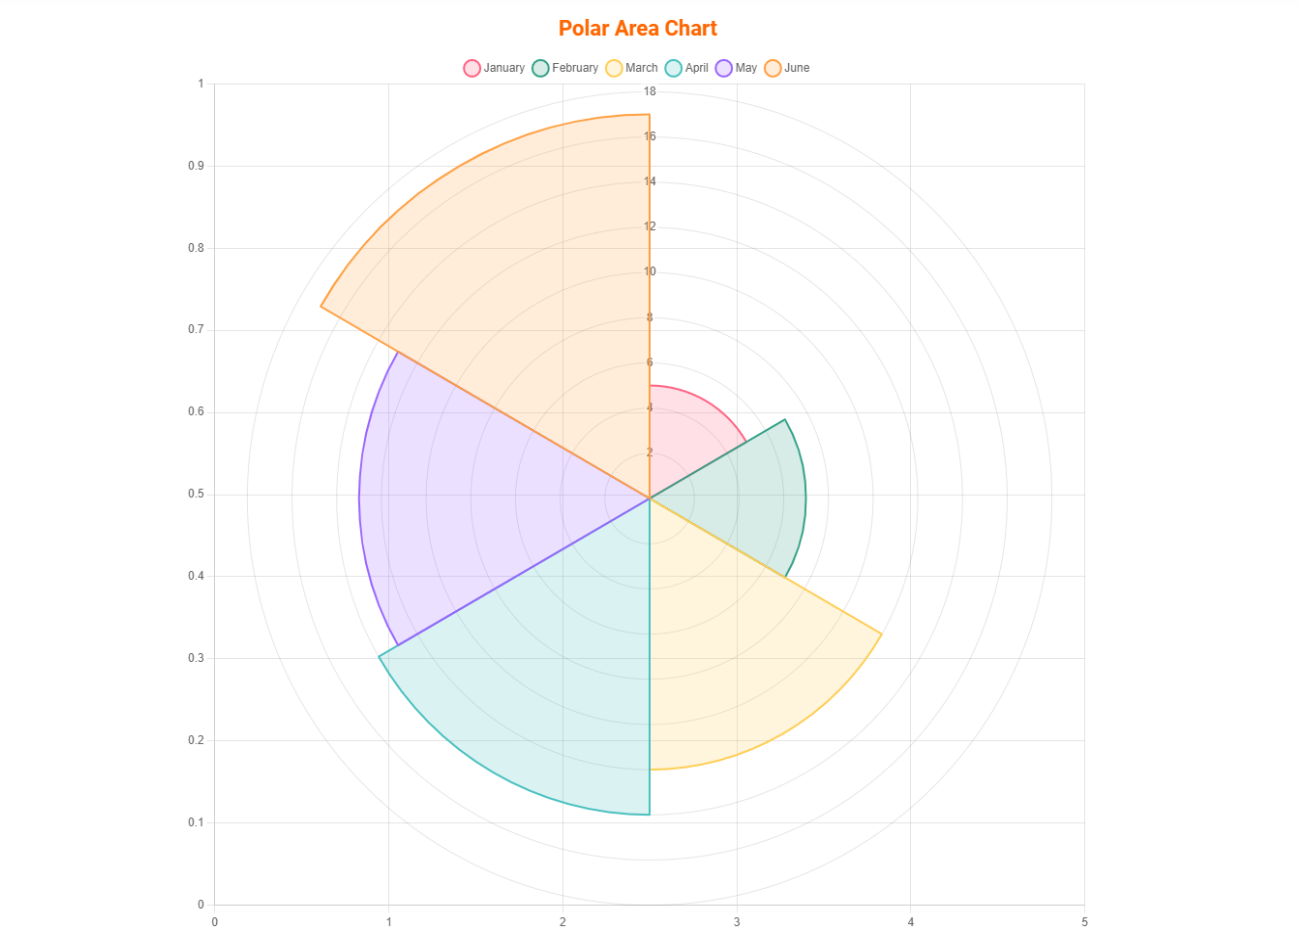
Polar Area Chart


Khối
Plugin này cung cấp 1 khối.
- Chart Graphical representation for data visualization.
Cài đặt
From Gutenberg Editor:
- Go to the WordPress Block/Gutenberg Editor
- Search For Chart Block
- Click on the Chart Block to add the block
Download & Upload:
- Download the Chart Block plugin (.zip file)
- In your admin area, go to the Plugins menu and click on Add New
- Click on Upload Plugin and choose the
chart-block.zipfile and click on Install Now - Activate the plugin and Enjoy!
Manually:
- Download and upload the Chart Block plugin to the
/wp-content/plugins/directory - Activate the plugin through the Plugins menu in WordPress
Hỏi đáp
-
Is Chart Block free?
-
Yes, Chart Block is a free Gutenberg block plugin.
-
Does it work with any WordPress theme?
-
Yes, it will work with any standard WordPress theme.
-
Can I change block settings?
-
Yes, you can change block settings from the Gutenberg block editor’s right sidebar.
-
How many times can I reuse a block?
-
You can use unlimited times as you want.
-
Where can I get support?
-
You can post your questions on the support forum here
Đánh giá
Người đóng góp & Lập trình viên
“Chart Block – Visualize Data with Bar, Line, Pie Charts” là mã nguồn mở. Những người sau đã đóng góp vào plugin này.
Những người đóng góp“Chart Block – Visualize Data with Bar, Line, Pie Charts” đã được dịch qua 1 ngôn ngữ. Cảm ơn những người tham gia dịch vì đóng góp của họ.
Dịch “Chart Block – Visualize Data with Bar, Line, Pie Charts” sang ngôn ngữ của bạn.
Muốn tham gia phát triển?
Duyệt code, check out SVN repository, hoặc theo dõi nhật ký phát triển qua RSS.
Nhật ký thay đổi
1.1.6
- Fix Border Issue
1.1.5
- Performance Improvement
1.1.4
- Add translate feature
1.1.3
- Reduce PHP Code
- Performance Improvement
1.1.2
- Add option for height
1.1.1
- Reduce PHP Code
1.1.0
- Add option for show hide X or Y scales
1.0.5
- Add option for showing hide grid lines
1.0.4
- Add the download option for the chart
1.0.3
- Performance upgrade
1.0.2
- Update theme and Colors
1.0.1
- Add an option to change the point size.
- Fix border size when hovering.
1.0.0
- Initial Release.