Sitemap


AnyChart
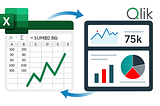
Cross-platform data visualization solutions: Award-winning JavaScript chart library, Qlik Sense extensions & more for all your data viz needs: www.anychart.com
Cross-platform data visualization solutions: Award-winning JavaScript chart library, Qlik Sense extensions & more for all your data viz needs: www.anychart.com