Code for combining a Raspberry Pi Zero 2 WH computer with an Adafruit MCP9808 temperature sensor to measure ambient air temperatures. The files in this repo are related to the following Hackaday.io project.
The Python script communicates with the MCP9808 using the I2C interface and logs temperature readings once per second. Each reading is timestamped and appended to a CSV file, creating a dataset of environmental temperature measurements. The program runs indefinitely until manually stopped, allowing the device to act as a lightweight temperature monitoring system.
After sufficient data has been collected, the CSV file can be transferred from the Raspberry Pi to another computer for analysis and visualization. The project includes frontend files which load the temperature dataset and generate several charts to help explore patterns in the data. Because the script records a reading every second, the dataset can grow quickly which may require additional processing time and memory when generating the visualizations.
Below are the required software programs and instructions for using this application on a Raspberry Pi computer.
-
Install the above programs
-
Open a terminal
-
Clone this repository:
git clone git@github.com:devbret/mcp9808-sensor-project.git -
Navigate to the repo's directory:
cd mcp9808-sensor-project -
Create a virtual environment:
python3 -m venv venv -
Activate your virtual environment:
source venv/bin/activate -
Install the needed dependencies:
pip install -r requirements.txt -
Run the primary script:
python3 app.py -
Start a
screensession:screen -S temp-logger -
Detatch:
Ctrl+A, then D -
To later reattach:
screen -r temp-logger
This project repo is intended to demonstrate an ability to do the following:
-
Collect temperature readings from an
MCP9808sensor connected to a Raspberry Pi over I2C -
Log timestamped temperature data every second into a CSV file for later analysis
-
Create a lightweight environmental monitoring system
If you have any questions or would like to collaborate, please reach out either on GitHub or via my website.
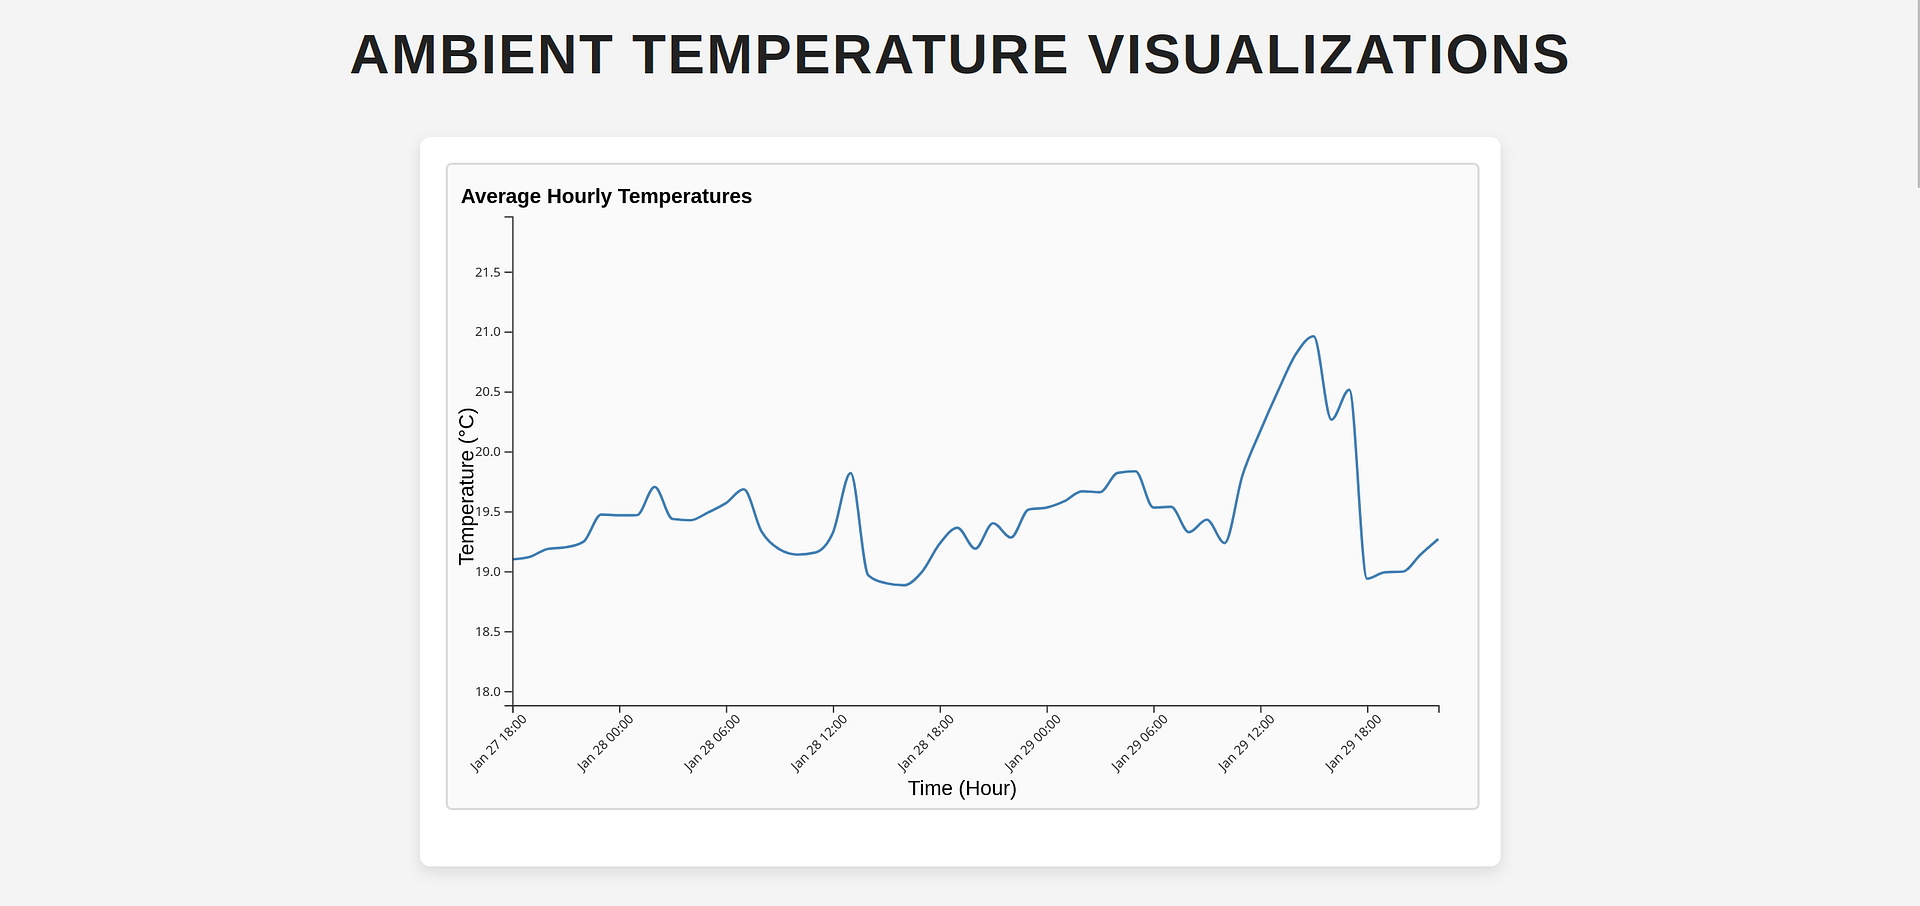
There are three types of graphs available for exploring your temperature measurements. The first visualization displays average hourly temperatures as a line graph. The second (type of) chart displays an average twenty four hour period based on all of your readings. Whereas the third variety of charts displays each day's readings from when measurements began until their ending.
In my experience, the Python file will generate between two and three megabytes of data every twenty four hours. Although your results may vary.
When attempting to load visualizations of your data, the process may take several minutes to complete. As well, you will likely consume more RAM than expected by doing so. Please take these points into consideration when launching your HTML, CSS and JavaScript files.