Pinned
CoinAnk
4,651 posts


CoinAnk
@CoinAnk
🔍 A platform for cryptocurrency order flow and futures contract data analysis. App download: coinank.com/download | Linktree: linktr.ee/coinank
 $M just flash crashed. From $2.88 to $0.678 — down over 76%. BOS confirmed. CVD Perp at -1.62M. Delta -173K. Every bounce attempt has been sold into. Pattern Recognition flagged two Bat Harmonic Reversal structures at 90% match. Potential reversal signal — but structure is still
- Today's $BTC Footprint Chart BOS confirmed at $63,331. Structure broke to the downside. EMA50 and EMA200 both sitting at $64,111–$64,119 — flipped to resistance overhead. CVD Perp at -5.39K. Delta -197. Sellers haven't let up. CoinAnk AI flagged a SHORT at $63,371. Confidence:

- $SPCX 151.17 — the chart is answering CVD Perp at -1.92M. Sell delta -103K. The structure broke. FVG between $180–$186 left untested on the way down. AI flags bear a probability at 50%. Key trigger: a clean break below $150 with volume confirmation. The structural break level

- CoinAnk reposted
 Ich bin immer wieder überrascht wie die Situation bei #Bitcoin einen täuschen kann. Wenn man sich die Meinungen auf X anhört, dann verfolgt nahezu jeder hier Bitcoin zu tieferen Preisen zu akkumulieren. Eigentlich müsste dies suggerieren, dass in diesem Fall, niemand long
- $ZHIPU | CoinAnk AI Analysis — Footprint Current Structure: Dominant path: Neutral 35%. CVD Perp +614.92, Delta +55.68 — buy pressure present but not decisive. Footprint shows 15K lot cluster at current price zone, with heavy sell-side absorption visible above 320. Key zones

- If you've ever spent 20 minutes staring at a chart trying to figure out what pattern you're looking at Pattern Recognition on CoinAnk was built for that moment. 👉coinank.com/proChart?excha…
 00:00Replying to @CoinAnkSwitch to Visual and it runs a historical match against the current chart structure. Similarity, volume match, clarity, completeness — all scored separately. A Gartley Harmonic at 90% similarity isn't a guess, it's a reference point you can actually trade around.
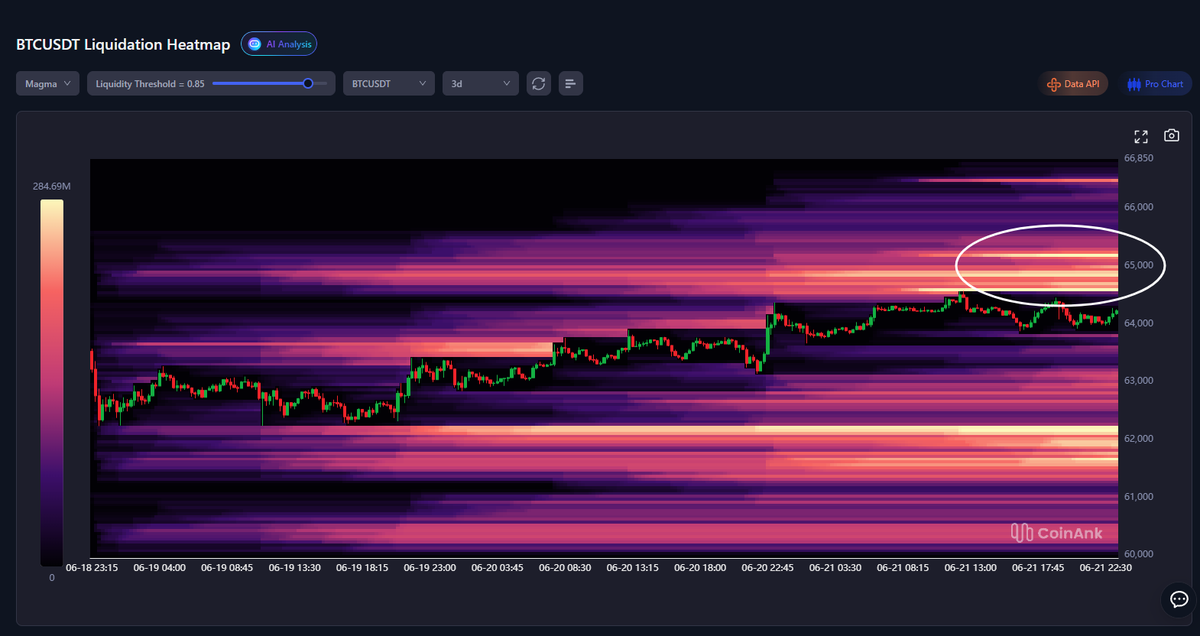
 - CoinAnk $BTC Liquidation Heatmap Price is consolidating directly beneath a concentrated liquidation cluster at $64,500–$65,500. Peak liquidity density in the zone: $284.69M. This level represents accumulated long stop-losses and short liquidation triggers. A sustained move