Log inSign up
Felix Geisendörfer
15.4K posts
Image
user avatar
Felix Geisendörfer
@felixge
Software Engineer @datadoghq working on Go Profiling, Performance, OpenTelemetry and more. Before: @Apple, Co-founder @transloadit, @nodejs core dev
Berlin
github.com/felixge
Joined October 2007
1,848
Following
13.8K
Followers
  • Pinned
    user avatar
    Felix Geisendörfer
    @felixge
    Aug 11, 2023
    🚀 Would you like to improve the latency of your Go apps? 
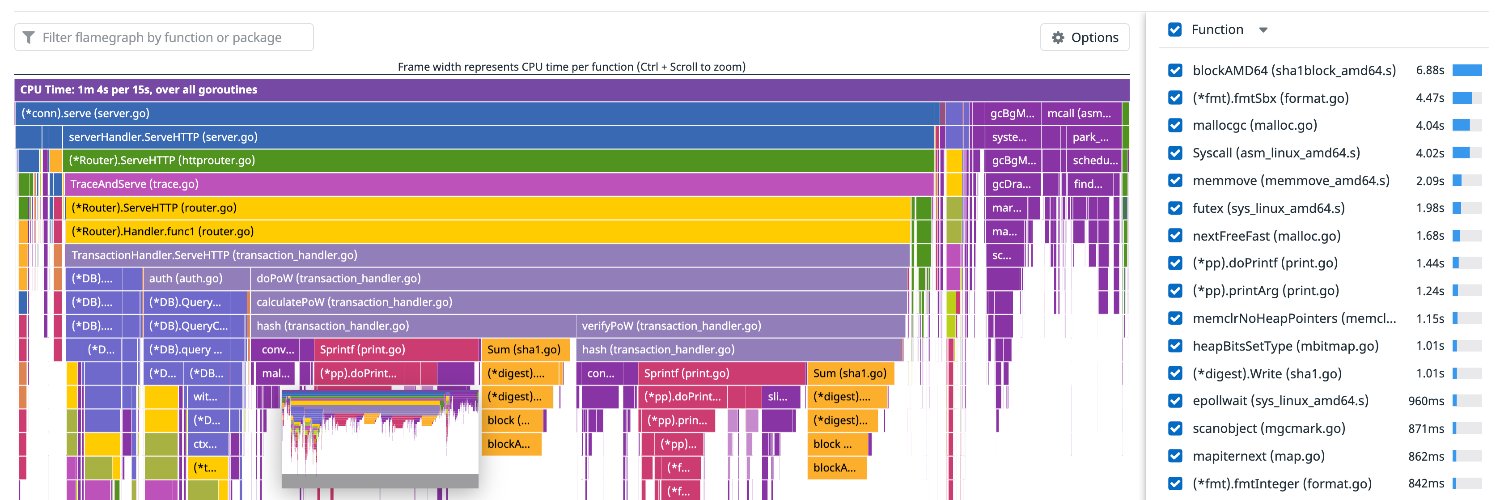
In the video below I'll walk you through 5 optimizations using @datadoghq's new profiling timeline feature. Finding and fixing those problems would have been really hard with other tools ✨.
    19K
  • user avatar
    Felix Geisendörfer
    @felixge
    Feb 8, 2019
    I herby start a new #blockchain consulting business: 1. You ask me if X will be revolutionized by blockchain technology. 2. I charge you $100k. 3. I say no. 4. You save millions of dollars. First customer gets 10% discount. Contact me now 🤙🏻
    This Post is from an account that no longer exists. Learn more
  • user avatar
    Felix Geisendörfer
    @felixge
    Dec 7, 2021
    Pro Tip: Are you tired of reviewing GitHub PR diff chunks out of context? Replace github.com with github.dev in the URL to enjoy a much better reviewing experience. via @__jakub_g
    Image
    00:00
  • user avatar
    Felix Geisendörfer
    @felixge
    Jan 18, 2022
    What happens when you make an http request in #go? res, _ := http.Get("example.org") io.Copy(io.Discard, res.Body) Below is a sneak peak my new function call tracer for Go🕵🏻‍♂️. Note time spent on TLS / Cert Loading. Visualizer is Perfetto UI.
    Image
    00:00
  • user avatar
    Felix Geisendörfer
    @felixge
    Jan 26, 2020
    1) Are you using #postgres via #docker for mac? Have you ever noticed `EXPLAIN ANALYZE` slowing down your queries by like 60x? Let's dig into some #postgres and #linux internals to figure out what's going on!
    An accessible version of this thread is available at https://github.com/felixge/tweets/tree/master/postgres-docker-explain-analyze
  • user avatar
    Felix Geisendörfer
    @felixge
    Sep 8, 2021
    📢 New project: The Busy Developers's Guide to Go Profiling, Tracing and Observability. It's early days, but I'd love to get some feedback on my simplified models for understanding the Goroutine Scheduler and Garbage Collector. PTAL github.com/DataDog/go-pro…
    Image
  • user avatar
    Felix Geisendörfer
    @felixge
    May 25, 2021
    📢 Announcing: Stack Traces in Go In-depth research explaining Go's stack layout, various unwinding techniques (frame pointers, gopclntab, DWARF), etc. and how it all related to profiling. Please let me know what you think! : ) github.com/DataDog/go-pro…
    Image
  • user avatar
    Felix Geisendörfer
    @felixge
    Sep 19, 2022
    🎉 Announcing fgtrace, a new profiler/tracer for #golang. It captures wallclock timeline views for each goroutine and it's really simple to use: defer fgtrace.Config{}.Start().Stop() Check it out & let me know what you think github.com/felixge/fgtrace
    Image
  • user avatar
    Felix Geisendörfer
    @felixge
    Jun 24, 2020
    🚀🧵 I'm herby releasing a new #golang profiler called fgprof that allows you to analyze On-CPU as well as Off-CPU (e.g. I/O) time together. AFAIK, this is impossible with the builtin Go profilers 🙈. github.com/felixge/fgprof Please RT or comment on the thread : )
    Image
    GitHub - felixge/fgprof: 🚀 fgprof is a sampling Go profiler that allows you to analyze On-CPU as...
    From github.com
  • user avatar
    Felix Geisendörfer
    @felixge
    May 7, 2024
    Nothing cures you of ideas like this than co-founding your own company, creating your own tech debt, and a few years later concluding that: no, it's not the right business move to clean it up. It's hard to express how humbling of an experience this was for me at the time.
    user avatar
    Jay Phelps
    @jayphelps
    May 7, 2024
    If I was in charge at a big tech company I would have a team whose entire job was to refactor and clean up code. They'd add the original authors as reviewers, make custom lint rules, etc.
    39K
  • user avatar
    Felix Geisendörfer
    @felixge
    Jan 31, 2021
    Turns out you can reduce the memory usage of a #golang by ~1.4MiB (on 64bit) by simply calling this at the beginning of your main: runtime.MemProfileRate = 0
    Image
  • user avatar
    Felix Geisendörfer
    @felixge
    Sep 16, 2021
    Join my #P99CONF presentation on Oct 6th to learn about: - Go Profiling - Go's unique runtime, calling convention - Using eBPF with Go - Why you should never use uretprobes with Go - Using Linux perf with Go - Go's builtin tracer - How I managed to fit all of this in 20min
    Image
  • user avatar
    Felix Geisendörfer
    @felixge
    Feb 5, 2024
    Profile-guided optimization for Go is great, and we have already used it to save significant amounts of money at Datadog. However, as part of a wider rollout, we noticed that one service saw an 18% increase in memory usage from pgo until we performed a rollback.
    Image
    35K
  • user avatar
    Felix Geisendörfer
    @felixge
    Mar 10, 2023
    Austin Clements from the Go team just landed a series of 17 patches. If everything goes well, you'll never notice that anything changed. That being said, watching this come together has been mind blowing. This is serious engineering (TM). 🧵 Thread ... go-review.googlesource.com/c/go/+/472956/5
    Image
    48K

New to X?

Sign up now to get your own personalized timeline!

Create account

By signing up, you agree to the Terms of Service and Privacy Policy, including Cookie Use.

Terms·Privacy·Cookies·Accessibility·Ads Info·© 2026 X Corp.
Don't miss what's happening
People on X are the first to know.
Log inSign up
Advertisement
Advertisement