-
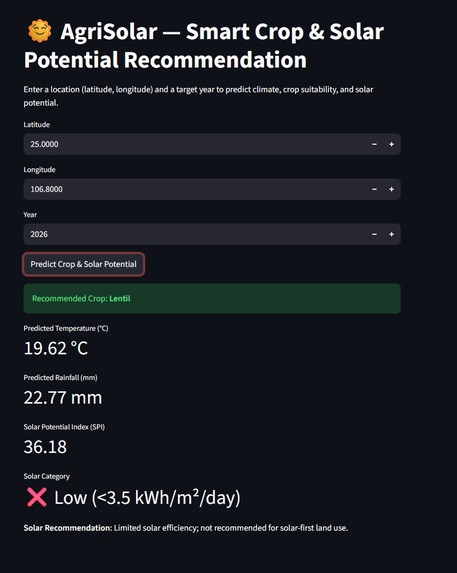
Demo of GUI
-
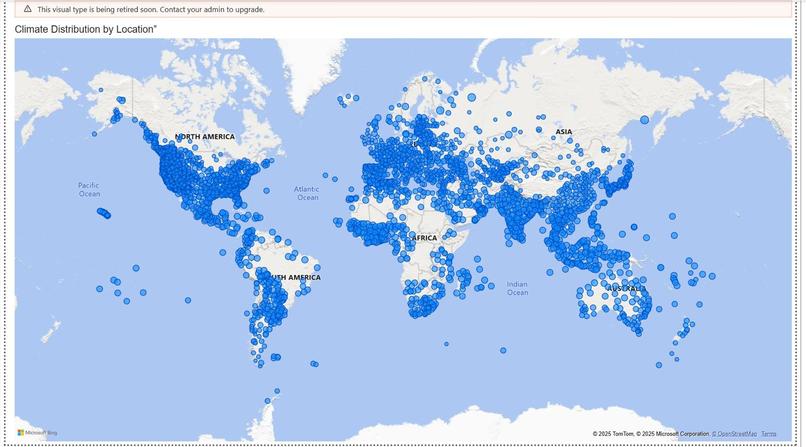
Demo from Power BI
-
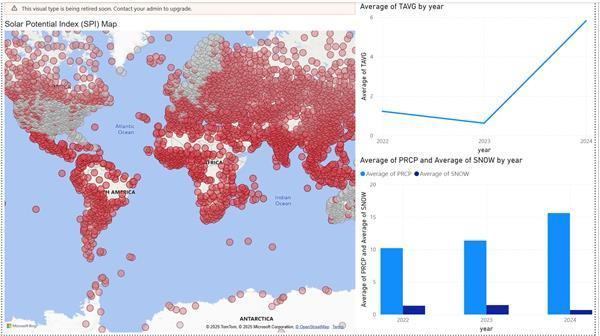
Demo from Power BI


AgriSolar Project Overview
Inspiration
The inspiration for AgriSolar came from the need to address two critical global challenges: food security and renewable energy production. As climate change accelerates, agriculture faces increasing difficulties such as unpredictable weather, droughts, and rising temperatures, while the world seeks sustainable energy sources. Our team envisioned a solution that combines solar energy and agriculture in a mutually beneficial way, where both can coexist on the same land. The concept of Agrovoltaics, or co-farming with solar energy, drives the core of AgriSolar, making land use more efficient while promoting sustainability.
What it does
AgriSolar is a data-driven dashboard that analyzes historical climate data to assess the synergy between solar energy production and crop farming. By calculating indices such as the Solar Potential Index (SPI), Drought Stress Index (DSI), and Crop Suitability Score (CS), AgriSolar identifies regions where solar panels and agriculture can coexist efficiently. The AgriSolar Synergy Score (ASS) is then computed, representing how well food production and clean energy generation can share the same land.
Key Features:
- Solar Potential: Measures how suitable a region is for solar generation.
- Drought Stress: Analyzes climate conditions that impact sustainable crop growth.
- Crop Suitability: Determines which crops are best suited to specific climates.
- AgriSolar Synergy Score (ASS): A composite score showing how effectively solar energy and crops can co-exist.
How we built it
We built AgriSolar using a combination of data aggregation, analysis, and visualization tools:
Data Aggregation: We merged and cleaned large datasets from the Global Historical Climatology Network (GHCN), focusing on daily temperature, precipitation, snow, and wind data. We used Python (with Pandas and NumPy) for data cleaning and transformation, and DuckDB for handling multi-million-row datasets efficiently.
Analysis & Modeling: We calculated several indices:
- Solar Potential Index (SPI): [ \text{SPI} = 0.5 \times (\text{TAVG}{scaled}) - 0.3 \times (\text{PRCP}{scaled}) - 0.2 \times (\text{SNOW}_{scaled}) ] where higher SPI indicates better solar potential.
Drought Stress Index (DSI): [ \text{DSI} = 100 \times \left(1 - \frac{\text{PRCP}{current}}{\text{PRCP}{historical_mean}}\right) ] A high DSI indicates higher drought stress.
Crop Suitability Score (CS): Based on ideal crop temperatures and rainfall needs, we used simple formulae to score crops like wheat, corn, and canola for specific regions.
AgriSolar Synergy Score (ASS): [ \text{ASS} = 0.5 \times \text{SPI} + 0.3 \times (100 - \text{DSI}) + 0.2 \times \text{CS} ]
- Visualization:
Using Power BI (or Tableau), we built interactive dashboards that visualize:
- AgriSolar Synergy Scores across regions.
- Trends in temperature, rainfall, and drought over decades.
- Top 10 Regions for Sustainable Co-Farming based on the calculated scores.
Challenges we ran into
Data Quality: The large-scale weather data from GHCN was messy and required significant cleaning. Missing values, duplicates, and inconsistent formats were common obstacles. We had to use various techniques to handle missing data and ensure consistency.
Complexity in Modeling: Calculating indices like SPI and DSI involved complex scaling and transformations of raw data. We also needed to develop reliable models to predict crop suitability for diverse climates.
Performance Issues: Working with multi-million-row datasets posed performance challenges. We utilized DuckDB for efficient querying and aggregation, but the volume of data still required careful management to avoid bottlenecks.
Visualization: Turning our calculated indices into meaningful visual insights was a creative challenge. Presenting multiple variables and trends in a digestible way required constant iteration to get the visuals just right.
Accomplishments that we're proud of
AgriSolar Synergy Score (ASS): We successfully created a robust index that combines solar potential, drought stress, and crop suitability into a single measure, offering insights into land productivity.
Impactful Dashboard: The Power BI dashboard allows stakeholders to visualize the results of our analysis, helping farmers, policymakers, and renewable developers make informed decisions about co-farming opportunities.
Data-Driven Insights: We identified key regions where solar farms and crop farming can thrive together, offering actionable insights to improve land-use efficiency.
What we learned
Agrovoltaics: We learned how solar energy and agriculture can complement each other when combined thoughtfully. This concept has a massive potential to improve sustainability and food security.
Data Processing at Scale: Handling large datasets and performing high-performance queries on millions of rows taught us the importance of efficient data management and processing techniques.
Multi-Disciplinary Collaboration: Combining expertise in data science, renewable energy, and agriculture was essential for creating an integrated solution. We realized that working across domains can lead to powerful, innovative solutions.
Visualization Design: Designing meaningful, actionable visualizations for a multi-faceted problem like this is not straightforward. We learned the importance of user-centric design to present complex data in a simple, actionable way.
What's next for AgriSolar
Expand Dataset: We plan to incorporate more diverse climate datasets to improve the accuracy and applicability of our models across different global regions.
Integrate Machine Learning: By leveraging machine learning, we aim to make predictive models that can forecast future climate patterns, helping to further optimize co-farming strategies.
Policy Recommendations: We hope to collaborate with policymakers to integrate the AgriSolar Synergy Score into land-use and energy policies, encouraging sustainable farming practices globally.
Public Platform: We plan to turn the AgriSolar dashboard into a public-facing tool, enabling farmers and developers to access real-time insights and optimize land-use decisions.

Log in or sign up for Devpost to join the conversation.