-
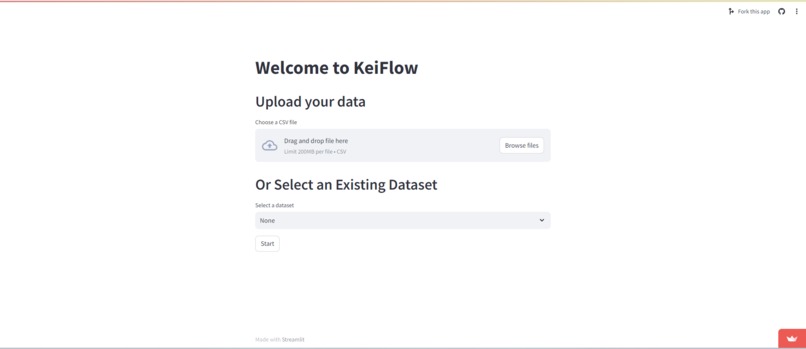
Home
-
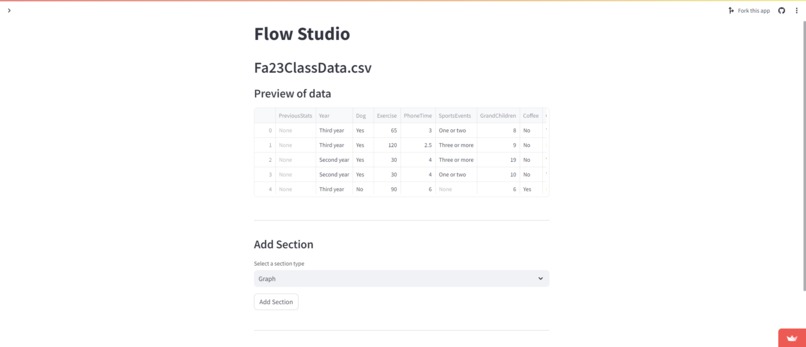
FlowStudio Display
-
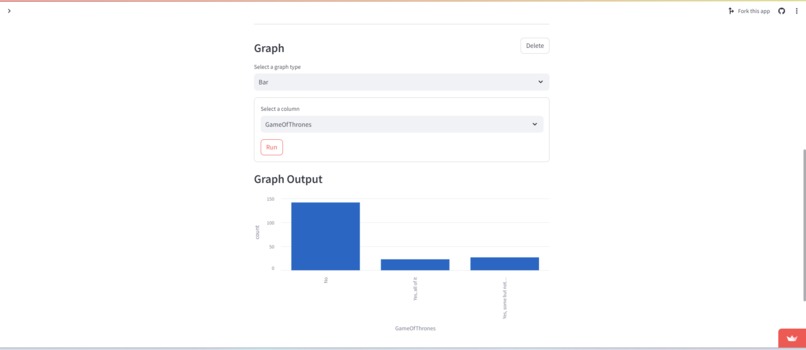
Bar Graph
-
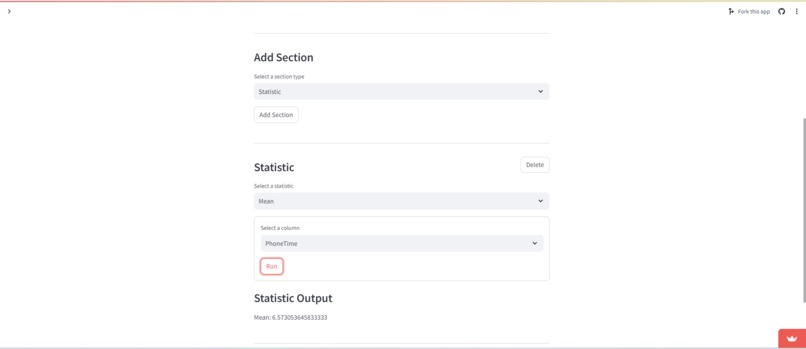
Mean Statistic
-
Model
-
Model.1
-
Model.2
-
Neural Network
-
Neural Network.1
-
Neural Network.2


Inspiration
In the past, creating machine learning models and neural networks has been a complex and code heavy process. We wanted to find a seamless solution that allows non-technical users to customize and create these models without code. We were also interested in implementing Streamlit as we wanted to learn a new interfacing tool and Streamlit seemed like just the right tool for our project.
One other interesting bit about KeiFlow is in the name. Kei is the short hand way of saying calculate in Japanese. In other words, our project is Calculate Flow, but obviously we think KeiFlow is more interesting and fun!
What it does
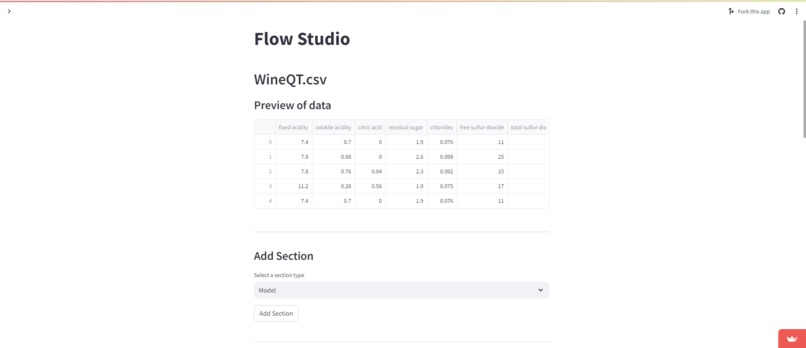
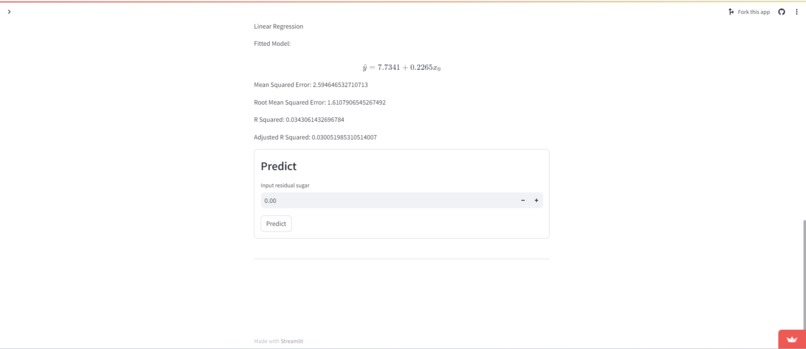
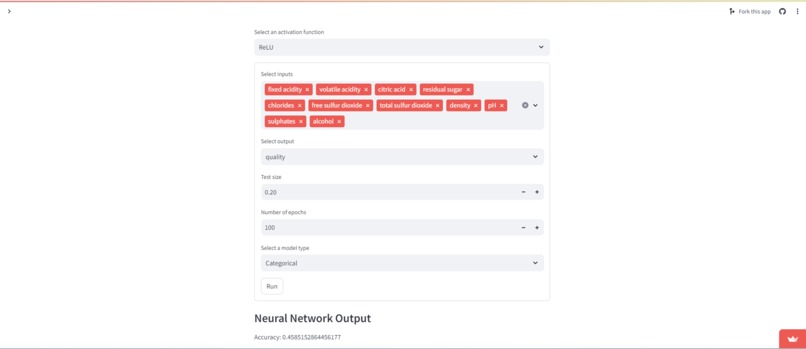
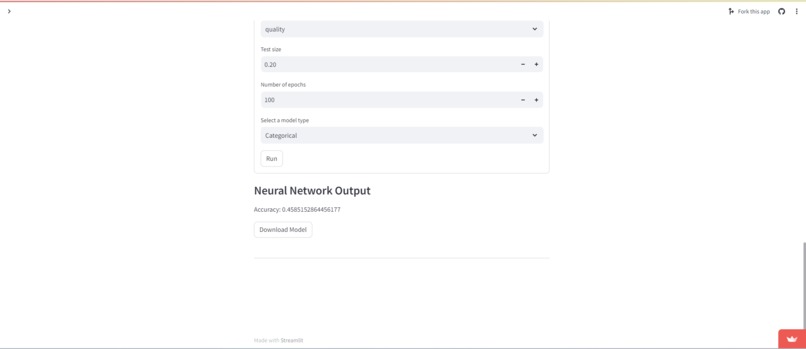
KeiFlow can be used in various applications in fields such as finance and medicine. The web app allows users to choose a dataset that has been previously uploaded or upload their own CSV file. Then the user can build flows to do exploratory data analysis numerically and visually, create machine learning models, and build customized neural networks from the data.
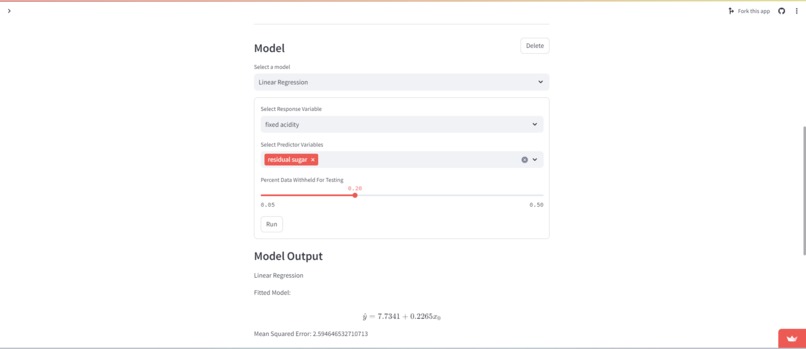
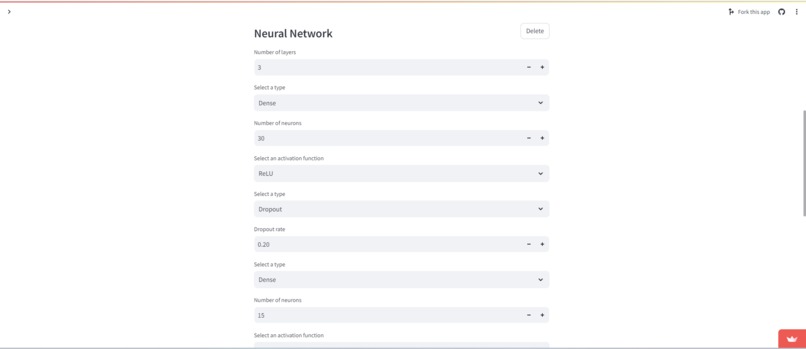
Users can choose from a variety of models such as Linear and Logistic Regression, KNN, Decision Tree, and Random Forest. Users are currently restricted to Dense and Dropout layers for the neural network.
How we built it
Our web interface is built entirely in Streamlit, utilizing some of its companion libraries to enhance its functionality. To wrangle our data, we are utilizing Pandas to read in csv files. We are doing calcuations to provide information about data and models using Numpy. We are creating our models with SciKit-Learn. To build the neural network we are utilizing Keras from Tensorflow.
Challenges we ran into
One of the largest problems we ran into was form components reporting their values incorrectly. It turned out that, we didn't understand the state management system in Streamlit, and once we saw how the state of inputs is supposed to be used, we quickly fixed our problems.
We also had some weird issues with the rendering cycle in Streamlit. Sometimes we would have components not show up and other times we couldn't make them go away. This also was partially related to state management and how we kept track of everything that needs to be rendered, but it also has to do with Streamlits update listener. Once we understood what the update listener was looking for and then subsequently doing when it found changes, we were able to modify our code to fit the intended patterns.
The last major issue we ran into regarding Streamlit was multipage applications. Streamlit doesn't support multipage applications all too well, and we needed a specific flow from the data upload or select screen to the flow studio. Once we found the Streamlit Extras library switching pages wasn't a worry, but there still was a problem: there was a side that bypassed any navigation restrictions. We found that the only way to get rid of it was by injecting custom CSS, which is less than ideal but we are thankful it was an option.
As far as the math side of things, we struggled to make guarantees about passing the correct type, categorical or quantitative, to a given function. Similarly when building the neural network, getting the input and output sizes correct proved to be a challenge. Our solution is more of temporary option as eventually we would love to build a bridging layer that auto converts categorical to quantitative and vise versa. The neural network shape issues were resolved by forcibly adding a final layer to the neural network the corrects the shape, and setting the input shape variable on the first layer in the neural network.
Accomplishments that we're proud of
We are proud of our implementation of Streamlit to create a sleek UI. Integrating the different components in one place has helped us create many functionalities that would be much more difficult without Streamlit.
We are also proud of the simplicity of KeiFlow. We think it reduces the barrier to creating models and neural networks significantly by taking out all the complexities that come with coding it.
We are thrilled that our project is deployed and available to be used by anyone! Click here to check it out!
What we learned
We learned a ton about Streamlit! We learned all about its state management and control flow systems, and what state management is in general! We also learned about deployments with Streamlit.
We also learned about the process of coding machine learning models and neural networks, and even further see the benefit of KeiFlow now that we've had to manually create the models for it.
We also learned about graphs and visuals for an easier to interpret output. We decided to make a heat map like visualization for the confusion matrices we generate for some of the machine learning models. We tried to strike a balance on the visuals because the code to create graphs is somewhat tedious, so we only created visuals for the items with most gain from visualization.
What's next for KeiFlow
There are so many more things to do to make KeiFlow the best data flow tool on the planet.
Add more visualization options! We have the basics, but we would love to offer more graph types such as box plots, and variations of our existing graphs such as side by side bar charts or stacked bar charts.
Add more statistics! While we have a lot of statistics, it would be nice to have correlation, amongst a handful of other less common but still useful estimators for population parameters.
Add more machine learning / statistical models! We have 5 models to choose from right now, but there are so many more we could add. We would love to add support for State Vector Machines and especially more options for modeling quantitative response variables.
Add more layer types for our neural network! The neural network is arguably the most complicated part of our application, and with our limited knowledge and time, we only got to add Dense and Dropout layers, which are super powerful, but there are so many more layer types that could be added in the future.
Add more control over hyperparameters in general! For example, we would love to add more activation functions, provide access to the elastic net penalty term for the logistic regression, and more, but in the time we had there simply wasn't time.
Create a variable translation layer. We really wanted time to get to do this because we wouldn't have to limit the variables for models and neural networks nearly as much, but it turns out creating a layer to convert quantitative to categorical and vise versa is quite challenging.
Create a data transformation flow item. We would like allow there to be options like simple transforms of scaling or applying functions to very complex transformations like Principle Component Analysis.
A note about the git log
Due to changes in time zone from travelling, the commit times on our GitHub repository are not accurate. The first ~15 commits show start times before the hackathon but interwoven are commits from the "future" (It shows "committed 1 hour ago" followed by "committed 7 hours ago"). We have already talked with MLH staff and they said it is fine.
Built With
- keras
- numpy
- pandas
- python
- scikit-learn
- streamlit
- tensorflow


Log in or sign up for Devpost to join the conversation.