-
-
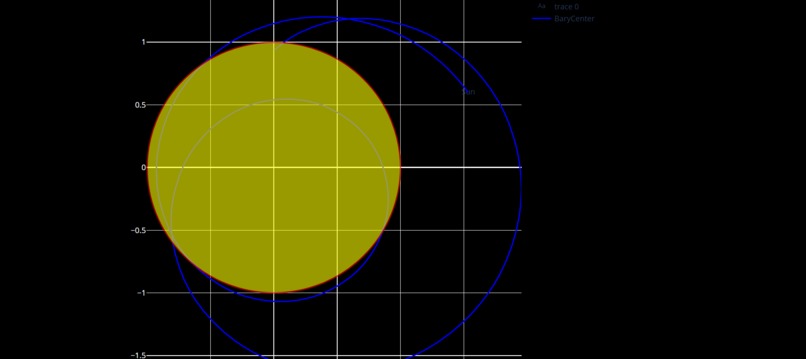
2D SSB path
-
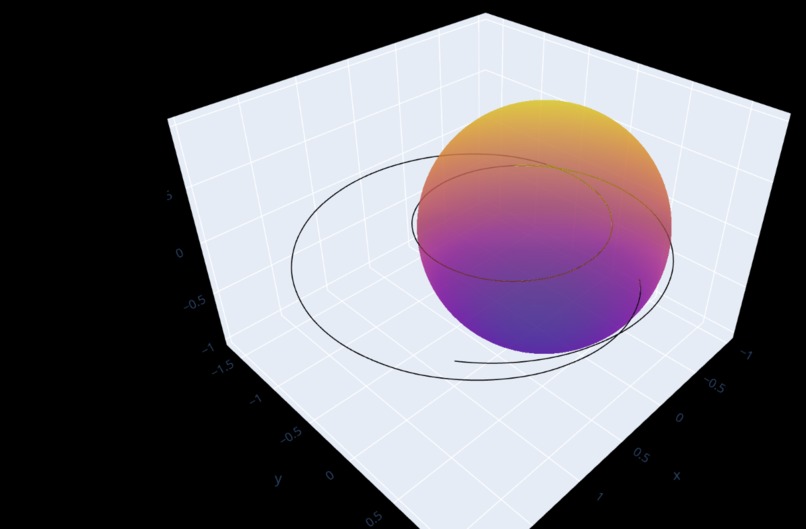
3D SSB path


Inspiration
I have always been interested in Space science and Physics concepts which I can do practically to observe the reality of this vast universe. But, I was limited and wanted a telescope to see other celestial objects.
My admiration of all possibilities happing in space led me to make this project where I combine my Programming and Astronomy knowledge to work with the concept of Solar System Barycenter. We are taught in primary schools that all planets in our solar system revolve around the Sun and the Sun itself is stationary at one place.
But the Sun is actually not stationary even in the Solar system. It does move around something inside the solar system itself.
What it does
This project is made to calculate and visualize the center of gravity of our solar system in reference to an observer observing from Earth and plotting the path of the center of gravity with respect to our Sun.
The Sun moves around the center of gravity of the Solar system. The Center of gravity is the point at which you can balance the whole solar system on a tip, considering the mass of all the celestial objects in our solar system.
That point of the center of gravity of our solar system is called Solar System Barycenter (SSB). All planets and even the Sun revolves around the SSB. We calculate the scaled coordinates and plot the path of SSB around which the Sun revolves.
There are 3 types of plots in this project.
- Showing the distance between the SSB and Center of Sun, scatter plot as compared with time. The time period is given by the user.
- A 2D plot visualizing the SSB path around the Sun in a reference frame ECLIPJ2000, which considered Earth and the Sun on a Single plane for straightforward observation. (If not used then we need to consider that the Earth, in reality, is tilted by 23.5 degrees in orbit which might complicate the observations) 3 A 3D interactive plot that gives an immense experience to observe the path of SSB when inside the Sun's surface but not coinciding with the Center.
How we built it
This project makes extensive use of SpiceyPy, which is a Python wrapper of SPICE toolkit provided by NASA Navigation and Ancillary Information Facility (NAIF). Technologies used are-
- Django web framework
- Python Programming language
- Frontend in HTML, CSS and Jinja templating
- Plotly is used to make interactive plots.
- SPICE kernels for orbital, SSB calculations, time conversions, unit conversions, dimensions of celestial bodies, and calculations with respect to the desired object of reference are done using naif0012.tls, de440.bsp and pck00010.tpc
- Heroku
Challenges we ran into
- Unit conversions between kilometers and astronomical units for very large distances.
- Considering the leap year seconds in calculating the end period for SSB location.
- Rendering the interactive plots on the frontend
- Paths issue while deploying on heroku.
All these issues and challenges are resolved,
Accomplishments that we're proud of
All the challenges were resolved quickly with the help of documentation and extensive research on the topic in a very short period of time.
What we learned
Sun moves in the Solar system too. Not every object in the solar system moves around the Sun. Using Ajax can be a really great alternative for rendering interactive plots asynchronously in the frontend and some clever tweaks can reduce redundant function calls and speed up. 3D plots with plotly are amazing and have a huge potential for such analysis.
What's next for CodeSpacehack
This project can be continued further by making a better UI. Also, other areas of research and exploration such as elliptical coordinate system also opens up. A generalized dashboard can be developed for enthusiasts to explore Space with SPICE and analyze in real world rather than just theoritically.

Log in or sign up for Devpost to join the conversation.