-
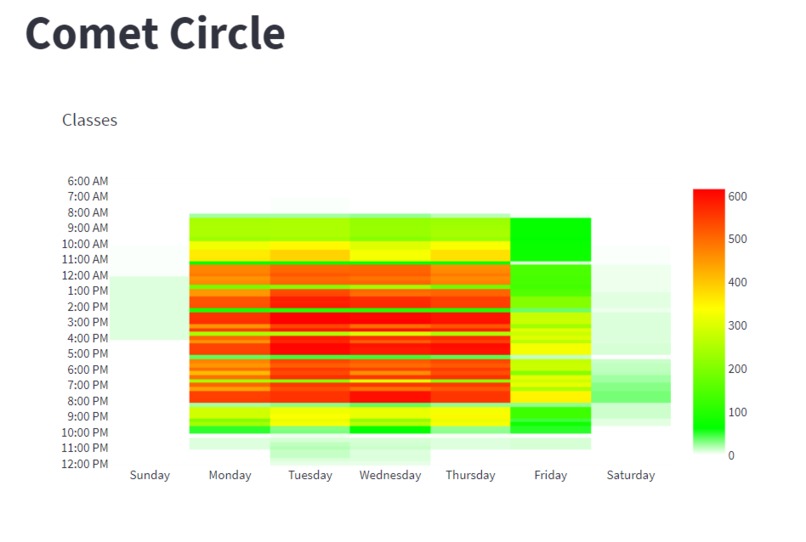
Heatmap for class density
-
Heatmap for events


Inspiration
Most student organizations on campus have difficulty with member retention and member attendance at events. By creating a planning tool that allows student organization leaders to choose the most optimal time for events, we hope to boost engagement and increase member retention.
What it does
CometCircle uses the Nebula API to generate a calendar "heat map" of when most students are in class. The tool filters by classes of a certain school (ECS, JSOM, AH, etc) and by the events by other organizations. By filtering based on school, the tool allows organizations to establish a target audience. For example, a computer science organization would mostly be interested in the ECS student demographic.
By filtering based on events, the tool allows organizations to choose event times that have the least overlap with other organization events. Moreover, being able to view when other organizations are scheduling their events would allow organizers to avoid conflict and allow students to attend more events instead of giving one up in favor of the other. On the calendar, the times that are more densely populated are displayed in red and the least densely populated times are green. The student organization should schedule during "green" times or spaces to avoid the most overlap between classes and prospective events.
How we built it
We employed Streamlit, an open-source framework that visualizes data to create a frontend and backend without any knowledge of JavaScript frameworks. We used Streamlit's built-in UI features to create a sidebar for filtering class data and to create events that populate the heatmap generated in Plotly.
Challenges we ran into
It was difficult to set time intervals on the heatmap and we went through numerous iterations to best mimic a calendar. As a whole, it was difficult to interpret the data, display the data (parsing the data into a table), and optimize run-time.
Accomplishments that we're proud of
We processed hundreds of thousands of course data to filter by specific tags and terms, generate a heat map for class density, and create events.
What we learned
We learned that using Streamlit is great for quick prototypes and data interpretation on the web.
What's next for CometCircle
This tool could easily be improved upon to increase mapping accuracy. By adding more filters such as by year, the organization can further narrow down its target demographic. Ideally, CometCircle would also be able to predict or estimate the number of attendees for each time and student organizers would be able to "lock" times and monitor how the projection changes leading up to the event.
Another goal we have for CometCircle is to have an authentication system, wherein registered student organizations are given credentials to sign in and compare prospective times/projections for a planned event. An authentication system would also allow us to expand this service to students as well.
Student organizations would have access to the predictive analysis and the class density heatmaps while students would be able to import their class schedules and have planned events autofill in the gaps between their schedules. The students could then register for events that align best with their schedules.
The number of students registered at certain times given their specific majors could be stored and used to better predict the ideal time and number of attendees for a certain day and time. We were unable to do this during the hackathon because the Nebula API did not include the information.
Built With
- api
- github
- nebula
- plotly
- python
- streamlit
- visual-studio


Log in or sign up for Devpost to join the conversation.