-
-
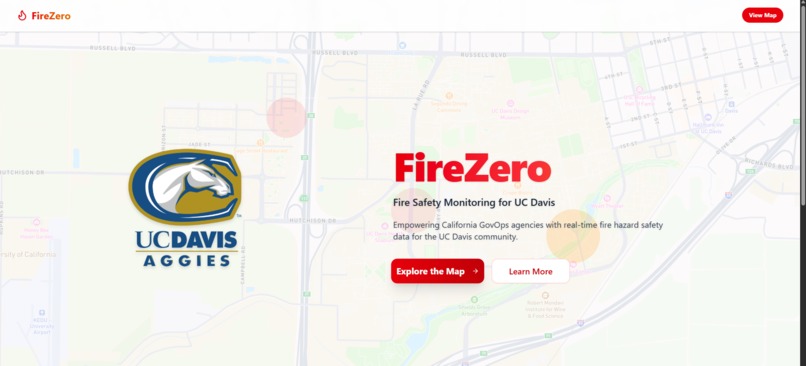
FireZero landing page
-
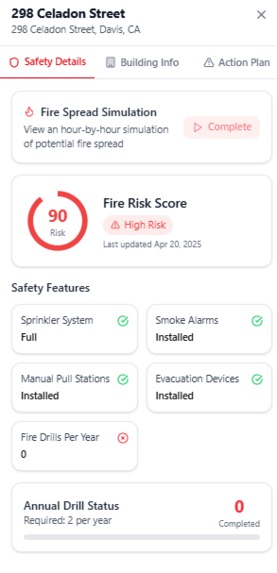
FireZero risk assessment
-
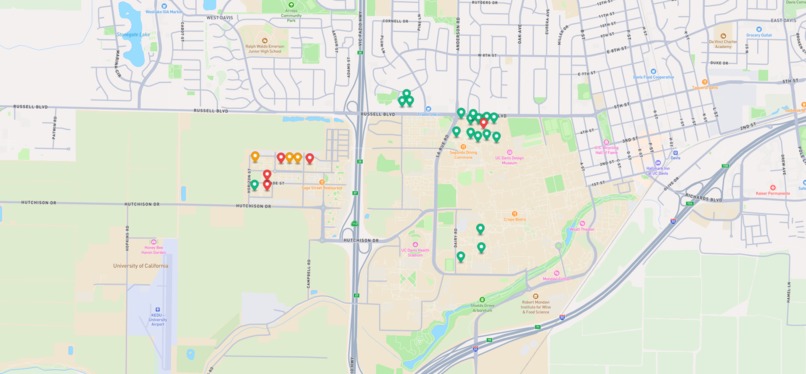
FireZero map
-
Static visualization (1): fire risk score assessment
-
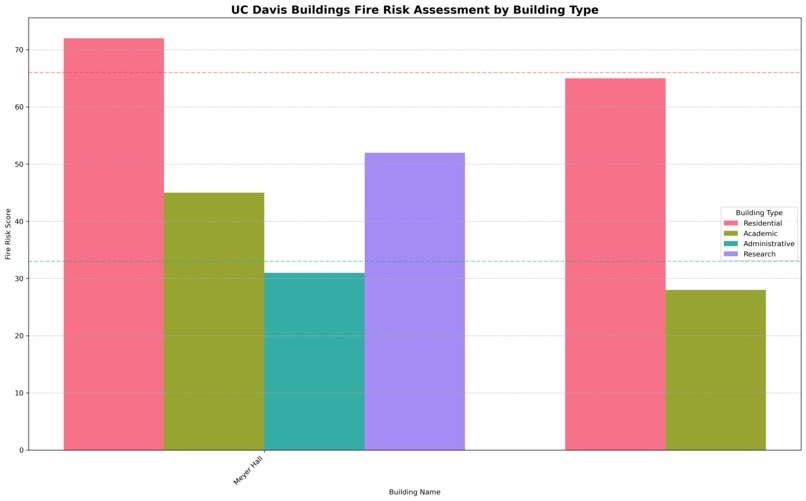
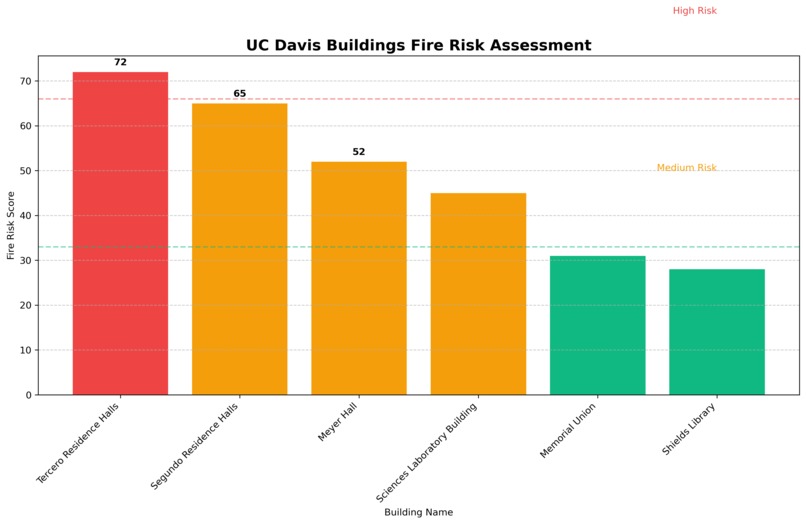
Static visualization (2): risk score by building type


Inspiration
California faces increasingly severe wildfires, but many public buildings lack centralized risk assessments. The CalGovOps challenge inspired us to build a planning tool that identifies infrastructure vulnerabilities before disaster strikes. We wanted to combine open data, AI, and equity-driven insights into a tool that could scale statewide.
What it does
FireZero is a fire risk planning and visualization tool designed for government operations and infrastructure planners. It maps UC Davis buildings using Mapbox and overlays risk scores derived from utility and safety data. Each building is assigned a composite fire risk score based on public data like gas usage, water consumption, energy intensity, and historical fire incidents. These scores are then enhanced with natural language summaries and planning recommendations via the Google Gemini API. The result is an interactive dashboard where users can explore each building's fire resilience, view concise risk descriptions, and receive actionable, steps to improve safety.
How we built it
We built FireZero using Next.js, leveraging Mapbox GL for map visualization and the Google Gemini API to generate insights.
The foundation of our system comes from two key datasets: the UC Davis CEED portal, which provides real-time and historical utility usage per building (including electricity, water, and gas), and the official UC Davis 2024 Clery fire safety report, which lists fire incidents, alarm system statuses, and fire drills counts across campus buildings. We cleaned and parsed these datasets into a unified JSON file which holds all relevant building-level information. Each building’s data is then sent to Gemini with a custom prompt, and the LLM responds with a natural language summary, a numeric risk score (0–100), and actionable steps for improving fire resilience. These insights are displayed in real-time on the map as tooltips and side panels.
Challenges we ran into
Managing marker rendering, popup logic, and dynamic styling based on risk scores led to a surprising number of bugs and state issues. At one point, markers weren’t updating correctly after score generation, and popups wouldn’t close properly due to conflicts with React's re-rendering behavior. It took several frustrating iterations to stabilize that part of the UI.
Accomplishments that we're proud of
We are proud that FireZero is a fully working product that ties together open data, AI, and intuitive visualization into something that feels meaningful and usable. It is not just a prototype or a concept. It actually runs, shows real data, and presents real insights that could help decision-makers. We believe this tool could be used by government agencies to prioritize retrofits, identify risk in vulnerable communities, and inform resilience planning at scale. It brings together complex datasets into a clean, interpretable interface and adds AI-generated planning steps that make the insights actionable. FireZero is not only technically complete but also designed with a clear use case and user in mind, and we believe it has the potential for real-world impact.
What we learned
We learned how to work with publicly available datasets and turn them into something structured, meaningful, and usable. Most importantly, we saw how raw data can become a tool for real-world planning when paired with clear design and smart automation.
What's next for FireZero
- Expand the dataset beyond UC Davis — bring in city and state buildings using public CEED-like infrastructure data.
- Add a policy report builder that outputs summaries for grant applications or retrofit funding requests.
- Collaborate with CalGovOps or local fire agencies to pilot this in the real world
Built With
- gemini
- mapbox
- matplotlib
- nextjs
- python
- typescript


Log in or sign up for Devpost to join the conversation.