-
-
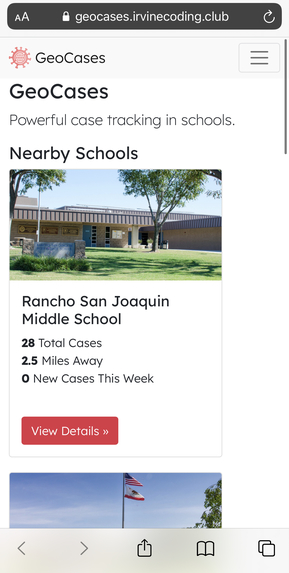
The mobile version of our web app GeoCases.
-
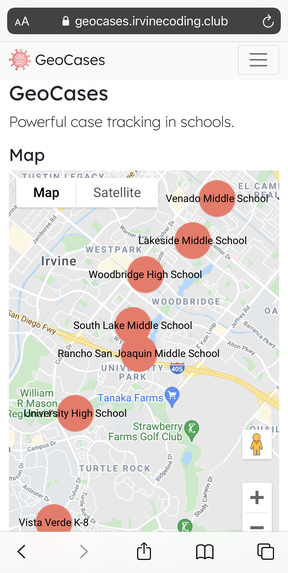
The mobile page of the GeoCases map.
-
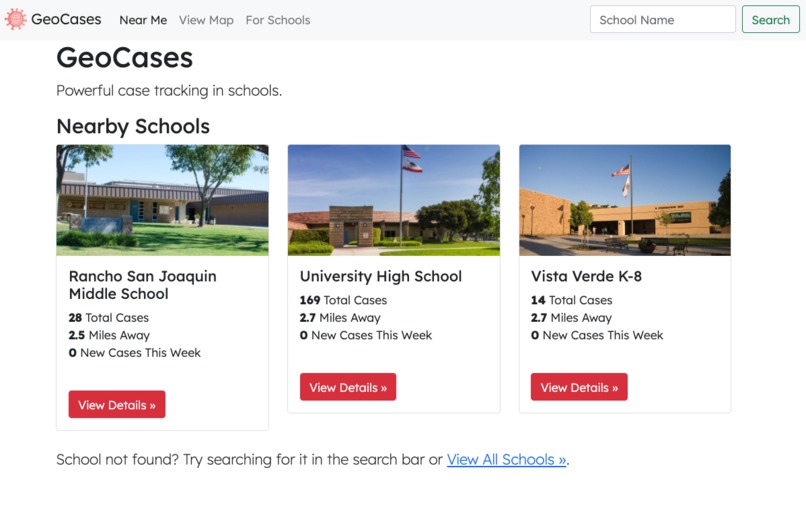
The desktop page of "Nearby Schools" on our GeoCases website.
-
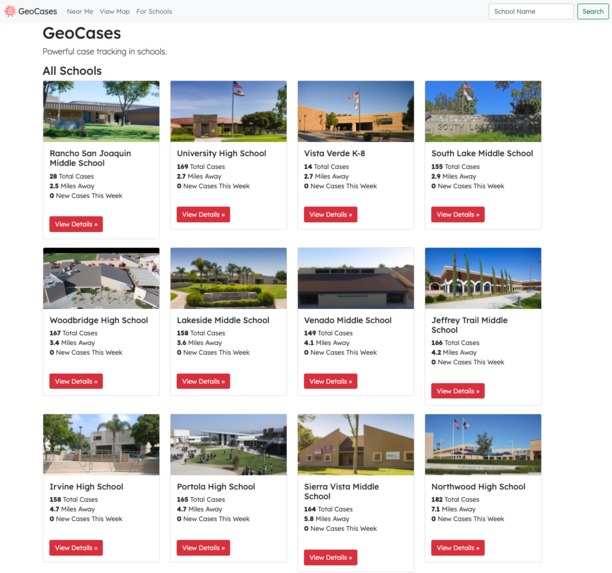
The desktop page of "All Schools" on our GeoCases website.
-
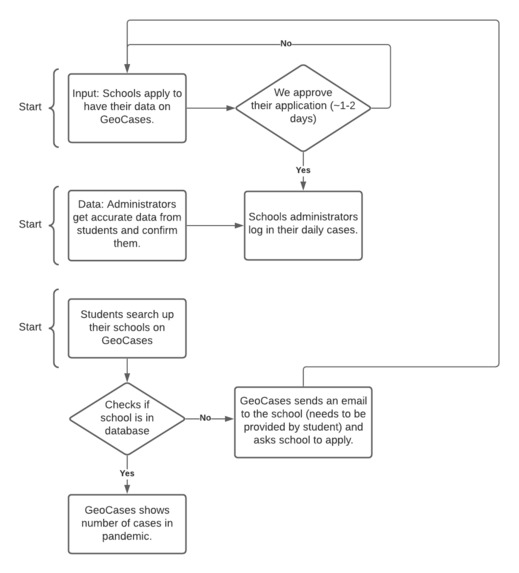
GeoCases program flowchart, displaying the process from administrator to student.
-
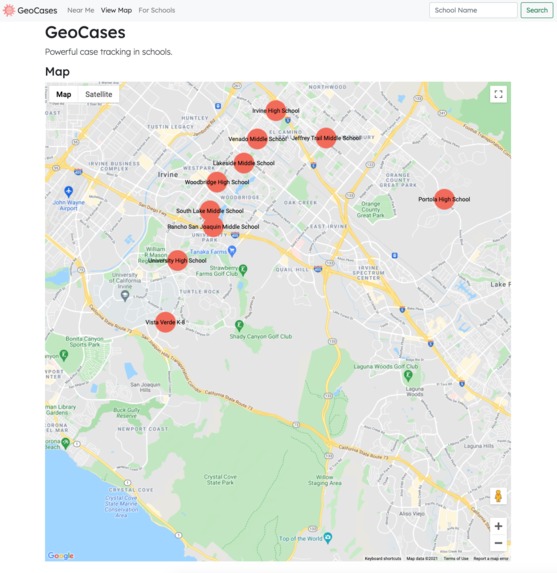
The desktop page containing the map version of our website.


Inspiration
As students that went to the same middle school and will be heading to the same high school, COVID-19 has affected us all, especially at school. We wanted to build an application that can help our communities by providing information to students of all different ages at all different schools.
What it does
GeoCases aims to inform a niche area with better technology: schools. People need to know how safe their schools are during a pandemic. The web app allows school admins to register their schools and report case numbers, accurately and almost daily. Students can find their school on GeoCases and see all the data combined together on a clean user interface. This is to ensure parents, students, and teachers all know the status of safety at their school. Students can use their mobile phone and open the GeoCases website, allowing GeoCases to know which school they're in or near so students can view the cases and information right where they are.
How we built it
We used Javascript, HTML, CSS, and the Bootstrap library to build the website. Chart.js helped with making charts. Our backend server is powered by Node.js. We held the school data in MongoDB, and one of our members wrote a Python program to upload the data. We also used Google Cloud APIs for getting the location, in order to find the "Nearby Schools" within a certain radius, and for displaying the map with schools. Our prototype is fully functional and we have real data from a database, not just hardcoded into the website.
Challenges we ran into
A teammate in our group didn't know how to code with Javascript, so another teammate had to teach them the basics in order for the project to run smoother and quicker. We were also insistent on making a fully working project, so the time restrictions and sheer knowledge levels created a bit of time. There was also a problem in a few stages in debugging. More specifically, a problem that set us back a few hours was the missing data. The charts for the hypothetical pandemic cases weren’t rendering correctly so we worked on debugging and adding to our program to fix and render them correctly.
Accomplishments that we're proud of
Building the project as a whole was something we were extremely proud of. But throughout the process, we agreed we wanted to make something that would work as an actual project, and in the end, we did! The charts and data all worked with no hardcoding whatsoever, and seeing our project work was something we were greatly proud of.
What we learned
We were too ambitious at the beginning, with some very far-fetched ideas that invaded into privacy, so we had to settle on a much easier solution, like GeoCases. We learned about our limits, both restricting but also showing us what we could and have accomplished, and about the benefits of teamwork in how we were able to successfully create something together. As we got together as fellow Irvine Coding Club members, we didn't know each other well. But the whole experience allowed us to learn more about each other and form closer friendships.
What's next for GeoCases
We want to team up with real school administrators to use our project and bring it into the real world. We also have more features we want to implement, including adding more schools and storing more information for GeoCases to become more useful.


Log in or sign up for Devpost to join the conversation.