-
-
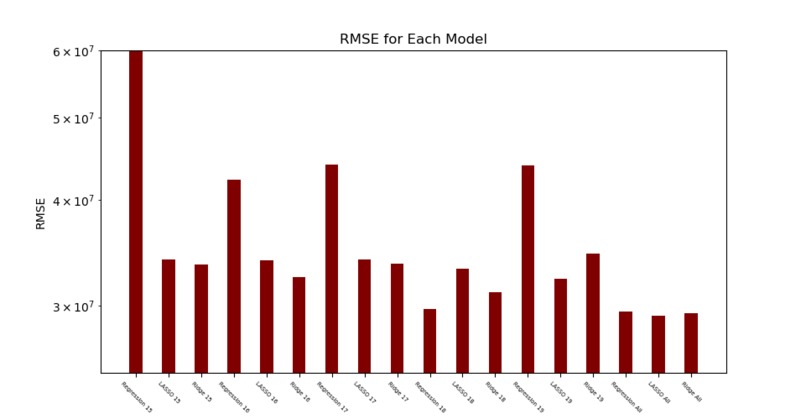
RMSE Graph

Inspiration
Our project is part of the Rice Datathon 2023 Chevron data track.
What it does
Our models predict the amount of government assistance received by states each year based on their energy production and usage statistics.
How we built it
We used a number of python modules such as pandas, scikit-learn, numpy, and seaborn to manipulate data and train our models. We used matplotlib to create graphs and charts of our results.
Challenges we ran into
We had very little experience in data science coming into the competition.
Accomplishments that we're proud of
We have learned a lot about useful python modules like pandas. Our models predicted amount of assistance with reasonable efficacy.
What we learned
We've learned about the strengths and weaknesses of different linear regression techniques.
What's next for Predicting State Energy Investments for 2020
In the future we may explore more sophisticated modeling techniques such as non-linear models and neural networks.

Log in or sign up for Devpost to join the conversation.