-
-
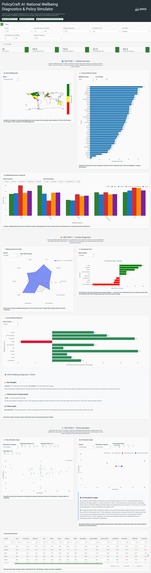
full captured the app page

PolicyCraft AI: National Wellbeing Diagnostics & Policy Simulator
Inspiration: Beyond the Static Dashboard
The world is awash in data, yet true understanding remains elusive. When I first explored the OECD’s Better Life Index dataset, I saw a familiar challenge: valuable information trapped in tables and static charts. Traditional dashboards can show what is happening, but they rarely explain why or explore what could be.
This inspired me to build an application that goes beyond presenting data to guide the user through a journey of discovery. This vision shaped the app as an agentic co-pilot—one that takes users from a global overview, to a specific diagnosis, and finally to an actionable simulation. It's a tool designed to answer the question most dashboards can't:
“Now what?”
What it does
The app guides users through a three-act narrative, revealing complexity progressively:
Act 1: 🌍 Global Overview - Users start with a high-level view, exploring a world map of composite wellbeing scores. This allows for quick comparisons and identification of interesting countries, setting the stage for a deeper dive.
Act 2: 🧭 Country Diagnosis - After selecting a country, a radar chart and gap analysis reveal its unique profile across 10 dimensions. AI-generated text identifies the top 2 strengths and weaknesses relative to the OECD average, providing a clear, narrative-based diagnosis of what these patterns mean for citizen wellbeing.
Act 3: ⚙️ Policy Simulation - This is where analysis turns to action. Interactive sliders let users test "what-if" scenarios. As a user adjusts a dimension (e.g., "improve education score by 10 points"), a scatter plot updates in real-time, showing the country's current position moving toward a simulated one. AI-generated insights explain the projected impact on life satisfaction, contextualized by comparisons to top-performing nations like Finland and Denmark.
How I built it
The project was developed in two main phases: offline data processing and online app development within Plotly Studio.
Phase 1: Data Engineering (Offline)
The foundation is a robust data transformation pipeline (oecd_transform.py) that processes the raw 97,916-row OECD dataset. This script was run locally to produce a clean, analysis-ready CSV file. It performs several key steps:
- Filtering & Pivoting: Isolates country-level data and transforms it from a long to a wide format.
- Normalization: Standardizes all 10 dimensions to a common 0-100 scale. This was critical for fair comparison and involved two methods:
- For standard metrics (higher is better): $$ \text{Score} = \frac{\text{value} - \text{min}}{\text{max} - \text{min}} \times 100 $$
- For inverted metrics like 'Homicides' (lower is better), I used percentile ranking to prevent outliers from skewing the scale: $$ \text{Score} = (1 - \text{rank}_{\text{pct}}) \times 100 $$
- Feature Creation: Calculates a
composite_indexfor overall ranking and[dimension]_gapcolumns to show performance relative to the OECD average.
Phase 2: App Development in Plotly Studio
Once the clean data was uploaded, the entire interactive application was built within the Plotly Studio environment. This involved a hybrid approach:
- AI-Powered Scaffolding: I used natural language prompts to generate the app's visual skeleton. Prompts like “Create a choropleth map of the composite_index” and “Build a bar chart comparing wellbeing dimensions” allowed me to quickly iterate on the layout.
- Custom Python Logic: The "agentic" intelligence was implemented by writing custom Python code directly in Plotly Studio. The key modules,
diagonosis.pyandsimulator.py, contain the Dash callbacks that listen for user interactions (like selecting a country or moving a slider) and dynamically generate the AI-powered text narratives.
Architecture Overview
OECD Raw Data (97,916 rows)
           ↓
Python Data Cleaning & Normalization (oecd_transform.py)
           ↓
Processed CSV (41 countries × 20 columns)
           ↓
Plotly Dash / DDK Layout (layout.py)
           ↓
User Interactions (Dropdowns, Sliders)
           ↓
AI-Enhanced Narrative Generation (diagnosis.py, simulator.py)
           ↓
Real-Time Visualization & Text Updates
Challenges I ran into
- The Mixed-Years Problem: Different OECD indicators are updated on different schedules (e.g., environment data from 2018, education from 2023). I chose to use the most recent data available for each measure to prioritize relevance over temporal uniformity, and noted this in the app.
- The "Agentic" Paradox: Dashboards are typically static. Making the data feel "alive" required a deliberate design of progressive disclosure (map → diagnostic → simulator), real-time visual feedback (the moving dot in the simulator), and contextual AI text that guides the user.
- Fair Normalization: Simply inverting a scale for negative indicators (like
max - value) was sensitive to outliers. Switching to a percentile rank for these metrics provided a more robust and statistically sound score, which was a key technical learning. - Narrative Generation Complexity: Generating rich, contextual text required more than just filling in a template. The logic had to identify performance gaps, select top/bottom performers, find relevant comparators (like Finland), and assemble the results into coherent prose.
Accomplishments that I'm proud of
- The Simulator Works: The core feature—a real-time policy simulator with dynamic visual and narrative feedback—is fully functional. This was the most technically challenging part and it performs as envisioned.
- Rigorous Data Engineering: The data pipeline is sound. The normalization logic, especially the handling of inverted indicators, ensures that the comparisons between dimensions are statistically valid.
- A Story-Driven Design: The app successfully implements the "three-act" narrative. Users don't just see charts; they are guided through a process of discovery that leads to actionable insights.
- Evidence-Based Insights: The AI narratives are not generic. They reference actual top-performing countries and use real data points to ground the recommendations, making them more credible.
What I learned
- Data Patterns: The OECD data revealed fascinating insights. Nordic countries achieve top rankings not by dominating every dimension, but through balance—they have no catastrophic weaknesses. The United States, in contrast, shows a stark "wealthy but stressed" profile: high scores on income but very low scores on work-life balance and safety.
- Correlation vs. Causation: While income and life satisfaction have a moderate correlation ($\rho = 0.52$), I found that work-life balance ($\rho = 0.64$) and safety had even stronger relationships. This reinforces that wellbeing is multi-faceted.
- Technical Skills: I deepened my skills in data normalization, building reactive Dash callbacks, and structuring a modular application. I learned that even gold-standard data requires extensive cleaning and thoughtful preparation.
- UX for Data Apps: I learned that for a data tool to be truly useful, interactivity must be immediate and the narrative context is just as important as the visualization itself. The AI text boxes were crucial in transforming this from a dashboard into an analytical tool.
What's next for PolicyCraft AI
The current app is a strong foundation. Future development would focus on adding more layers of analysis and utility for its target users: policymakers, journalists, researchers, and citizens.
- Time-Series View: Show how a country's rankings have evolved from 2010-2024.
- Inequality Dimension: Integrate Gini coefficients or other distributional data to show whether a country's wellbeing is broadly shared or concentrated among the wealthy.
- Custom Weighting: Allow users to adjust the importance of each dimension based on their own values and see how the composite rankings change.
- Policy Cost Estimation: Connect the simulator to real-world data to provide rough estimates of the investment required to achieve a certain improvement (e.g., "Improving the education score by 10 points has historically cost peer countries X% of GDP"). -**Multilingual Support: Translate interface and narratives to reach non-English speaking policymakers and citizens. The long-term vision is to make this tool a standard reference for evidence-based policy discussions—moving conversations from "we need to improve" to "here's how much improvement in X could affect Y, based on what worked in countries A, B, and C."


Log in or sign up for Devpost to join the conversation.