-
-
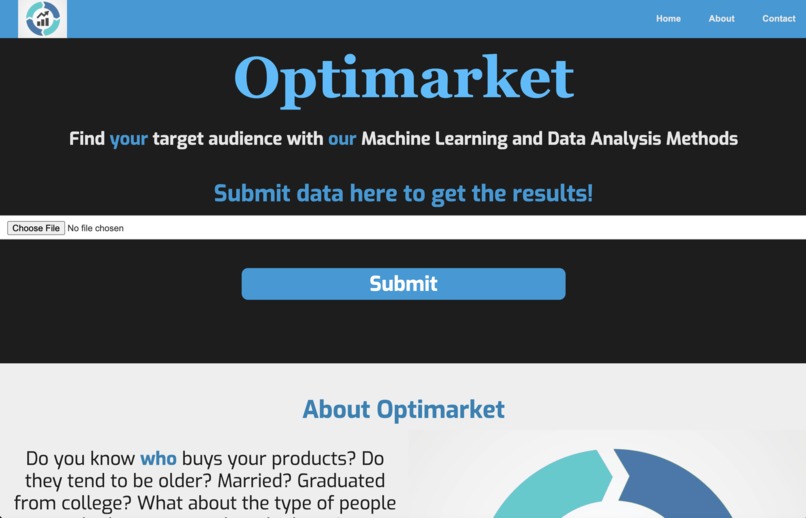
Optimarket Homepage
-
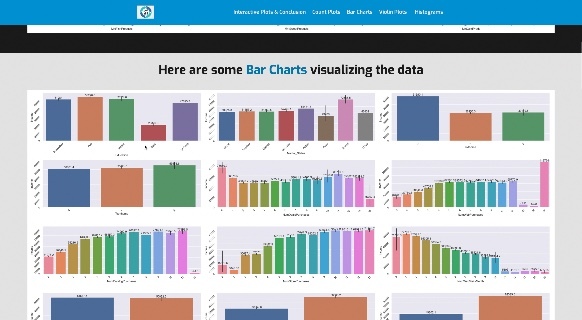
Optimarket Bar Graphs


Inspiration
In a camp I did over the summer, we were asked to analyze the sales of certain products and companies, and give a brief presentation on how we would continue marketing if we ran the company. We had access to customer type data for this project, but we had no way to find our main and infrequent buyers to know who to market towards.
What it does
Optimarket is a website that uses data analysis and machine learning to tell you who’s buying and who’s not buying. By uploading a file of customer data, it will display dozens of graphs visualizing sales vs. customer, then generate an interactive chart for your to test out. Furthermore, Optimarket uses Unsupervised Learning to draw conclusions from the data so you know who to market more or less towards.
How we built it
I built the frontend of this product with HTML, CSS, and Javascript, the backend with Python, and used Flask to integrate the two. For the machine learning and graphs, I first coded them on Google Colaboratory. I used unsupervised PCA Machine Learning to find patterns in the data, then displayed the results on the page.
Challenges we ran into
Generating the graphs from the data was a very tricky and complicated process. Based on what was imputed, I had to generate a bunch of different graphs that would often not output what I wanted or simply broke. Furthermore, integration using Flask was very difficult. The module I used to create the graphs was not supported in Flask, so I had to convert all the graphs to images first. The interactive charts also had this problem, however I couldn’t convert them to an image, but I know there’s a way to get them on the page. The unsupervised learning was also pretty hard to code, since I had a lot of variables to take into account, and finding the information I wanted was a lengthy process. Unsupervised learning is not as straightforward as supervised, since of course, you're not sure what you're looking for, so it was a lengthy and intuitive process.
Accomplishments that we're proud of
Hands down, drawing conclusions with the unsupervised PCA machine learning was the most interesting and in my opinion, the best part of this project. It was a little tricky to code, but there are real applications of Optimarket with the machine learning. Additionally, the graphs and interactive charts are beautiful, easy to read, and tell you a lot about the data. And the UI for the website is great. I think it looks like an actual product website.
What we learned
I definitely learned a ton about data visualization and the many ways you can represent the data. I had not used violin plots before this project, and they were very interesting to code. I also learned a lot about integration of frontend and backend using Flask, along with how to do unsupervised machine learning.
What's next for Optimarket
A big next step for Optimarket is getting the interactive charts on the webpage. As I described above, I was unable to do so in the hackathon timespan, but I know it’s possible. I could also possibly work on getting more conclusions from the unsupervised machine learning, and improving the UI.


Log in or sign up for Devpost to join the conversation.