-
Output

Inspiration
For this project, our goal was to utilize data science practices to analyze data given to us regarding educational data. As tasked, we did so under the premise of data scientists performing analytics to deliver insights to an unnamed congressional person.
What it does
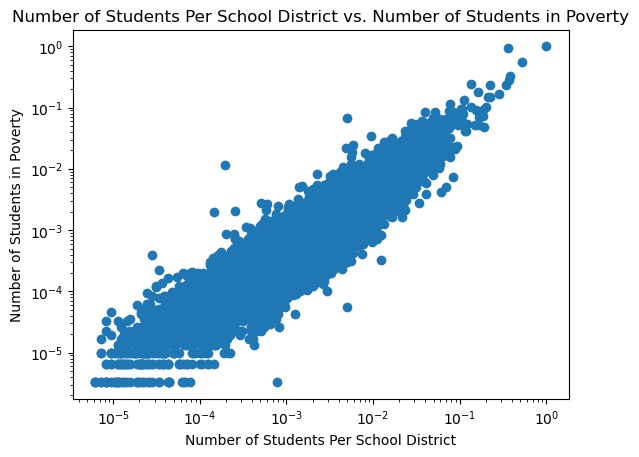
Our project analyzes data to find the relationship between the number of students per school district to the number of students in poverty.
We explored the issues with data reproducibility by demonstrating how one dataset can have differing outcomes based on factors like software, which we demonstrated by viewing the same dataset into Excel and Python, yielding a different number of school districts in the two examples.
Similarly, we looked at the discrepancies between the number of school districts between two government datasets to show that even data collected by the federal government can have significant differences.
How we built it
Most of this project was done in Python in Jupyter notebook files. Doing so allows us to use machine learning algorithms and showcase our data and visualization in an easy to read format. We utilized Pandas, NumPy, MatPlotlib, sklearn for Linear Regression and MinMaxScaler (normalization), and mean_squared_error and r2 for validating the model’s accuracy. Using these tools, we managed to produce a linear regression model that shows a correlation between two features we were asked to analyze.
In addition, we utilized Excel to compare its importing of data to Python. We attempted to utilize Postgresql to handle a large dataset, but after hours of attempting, we were not able to complete this portion of the project due to time limitations.
Challenges we ran into
The primary issue we encountered was time limitations. Unfortunately, we were not able to successfully access a large dataset that required significant RAM or SQL to use. We also had issues regarding hardware since none of our team members had hardware strong enough to read a 10 GB file, which limited our options..
Accomplishments that we're proud of
Tackling the issues with loading the data for Task 1 of the Advanced track was really hard, but we’re glad because we managed to do it and also produce a linear regression model. Even though more can be done to clean it up and produce a more accurate model, it was really nice to finally get the data merged together so we could work with it and display something that a person could easily recognize as some sort of correlation.
What we learned
Working with big data for the first time, we realized the difficult challenges of working with not-so-great hardware. We expected to work with large datasets, but not ones that would be essentially impossible for all of us to work with just due to us having laptops with low RAM. We realize that this is a great reason to dive more into SQL and Postgres in the future, because this was frustrating to deal with.
Also, for the first task of the Advanced track, we learned about how to merge different datasets by combining columns (similar to a SQL inner join), and how to better clean up the data beyond just applying feature scaling (such as using a boxplot to check outliers, and then remove said outliers). We also learned about how segmenting the data plots could be really useful for analyzing the data (and reduce the effect of outliers), but we struggled a bit with the implementation.

Log in or sign up for Devpost to join the conversation.