-
-
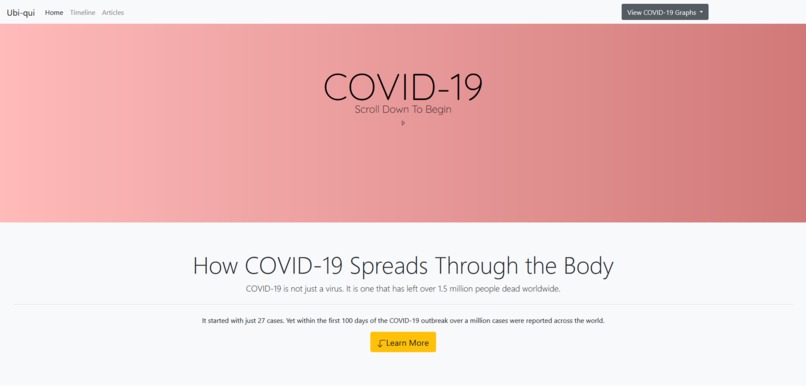
The landing page of our project. It includes the timeline and its navigation bar links to our graphs.
-
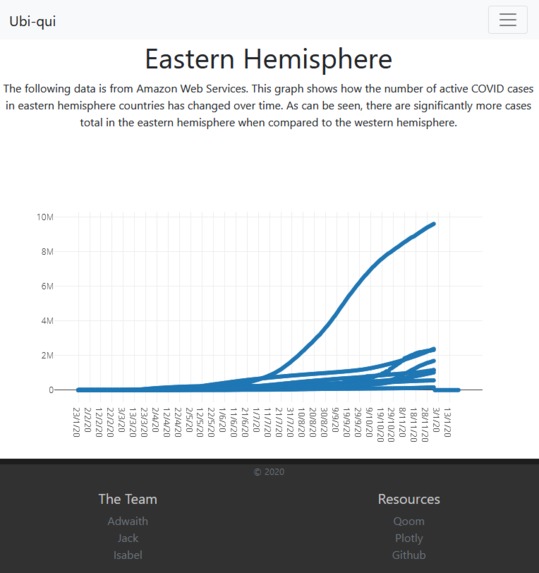
A graph showing how active COVID-19 cases have changed over time in countries in the eastern hemisphere.
-
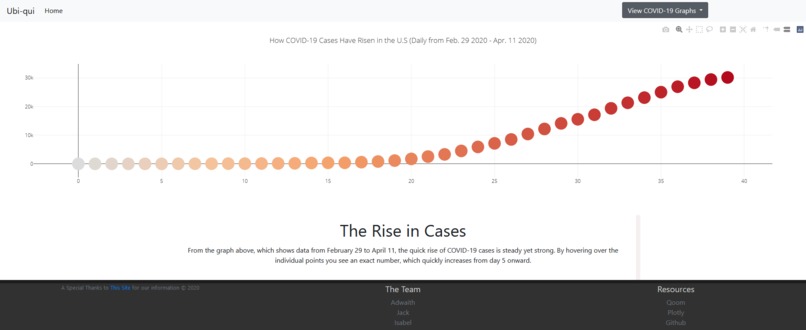
A graph that shows a small window of time where COVID-19 cases first began to spike in the U.S.
-
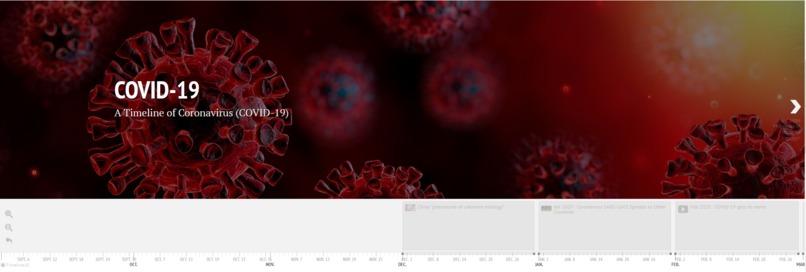
The timeline we included that discusses important events relating to COVID-19 since it was first reported in China on Dec. 31, 2019.


Inspiration
Considering we've all been stuck indoors since early 2020, we are fully aware of the dangers of COVID-19. We see the worldwide heartbreak and turmoil whenever we switch on the news. Yet we are also aware of the rampant misinformation about COVID-19 appearing in media that people are seeing all too often. With our project we hope to grab users' attention and impart the true scope and deadliness of this new coronavirus. We've added in interactive graphs to help accomplish this, as well as a timeline of dates revolving around COVID-19 developments.
What it does
There are several layers to the project, with the landing page being the start of everything. It contains a timeline concerning major dates relating to COVID-19, small snippets of information detailing infection and the virus' effects on organs, and a navigation bar that leads to our interactive graphs. It is meant to address the theme of Science Education through the visualizations and info we included.
How we built it
We used Qoom to collaborate on our documents, which were built from HTML, CSS, Javascript, and Python. We used graph libraries from Plotly to illustrate our data in an interactive format and have displayed the project on Github for people to demo. Since the page displays much better through Github we have hosted it on there, but the Qoom code is provided as well.
Challenges we ran into
We ran into quite a challenge when we started inputting our graphs. There was a long wait time for one graph to load onto the screen, and even then it was horridly slow to interact with. Two of our graphs that involved the most python would load fine when in Qoom, but not display at all when run through Github, which is why we've provided two demo links so it's possible to see the graphs independently. Thankfully one graph was fine in both Qoom and Github and displays well on the site as 'Daily U.S COVID-19 Cases.'
Accomplishments that we're proud of
We're proud of the timeline and graphs we were able to include, as well the fact we could collaborate so well over Qoom! It was our first time working with data and visualization in such a way, so even though we ran into quite a few mistakes we're quite pleased with it. We ended up including more than we thought we would include and are grateful that everything works in the way it is intended.
What we learned
By working with python and graph libraries to create our visualizations, we learned a lot about data as a whole. Additionally, we learned a lot about formatting web pages through our experience coding the landing page. We resorted to a very linear grid system to keep everything simple, and overall it was a joy to complete. Some of us had never worked with python that much beforehand, so learning about it as we went along was very insightful!
What's next for Ubi-qui
We hope to expand the interaction involved in Ubi-qui, perhaps by adding more countries to the list of graphs or by improving the graphs altogether. We had plenty of ideas for other visualizations but ran into the issue of time; the sheer amount of data we would be able to add to improve Ubi-qui is not lost on us.


Log in or sign up for Devpost to join the conversation.