-
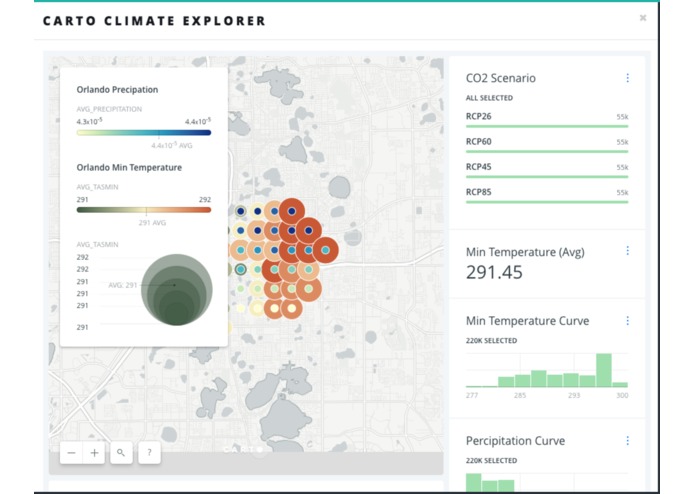
Mapped points of temperature and chance of precipitation
-
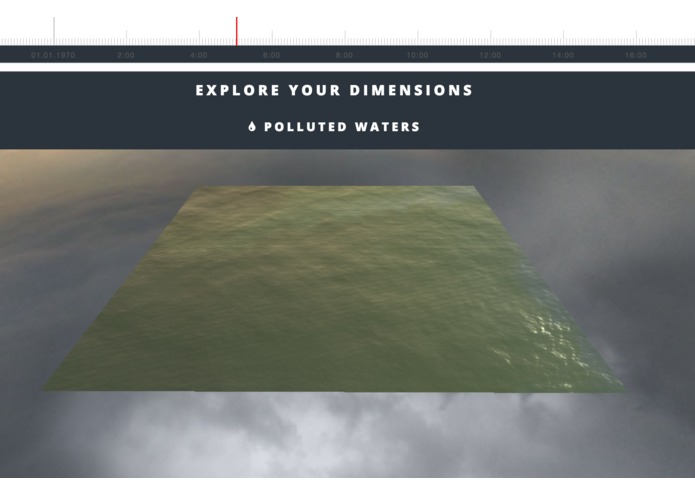
Water vizualization
-

Trend comparisons


Inspiration
Our planet is drastically changing but we do not notice these changes since they occur in small increments. Over time these changes in our environment will make our planet uninhabitable. We need to take action and preserve life on Earth which is where VIV comes to aid.
What it does
VIV is a data visualization tool which displays the changes in key variables that effect our climate. Time series viewing mode allows users to scroll through time and see how these variables change and make comparisons between data sets to view trends. With this data we can make decisions on energy conservation initiatives to reduce our carbon footprint and see the impact that is made.
How we built it
We pulled and cleaned data sets from many different databases (United Nations world health organization, United States census bureau, USGS) and formatted the datasets for Cartos. Some of the data that we pulled also came from planetos. The front end was built using webgl and d3 javascript libraries. The backend server was made using node.js and gulp. The front end called our custom made datasets directly from the cartodb api.
Challenges we ran into
-Finding the right data library
- Cleaning and formatting the large data
- Finding the right geographic shapes to overlay on the data for the cartos map and making the time series -3ds -Webgl -Understanding carto -Understanding how to deliver a product that is useful to a challenge of this type
Accomplishments that we're proud of
-Beautiful graphs and charts -Efficient loading of data
What we learned
What's next for VIV
We plan on adding:
-Supporting analytics to show the effects of environment change on indigenous people -Correlation charts and scatterplots with heat maps to represent data sets


Log in or sign up for Devpost to join the conversation.