-
-

web_log logo
-
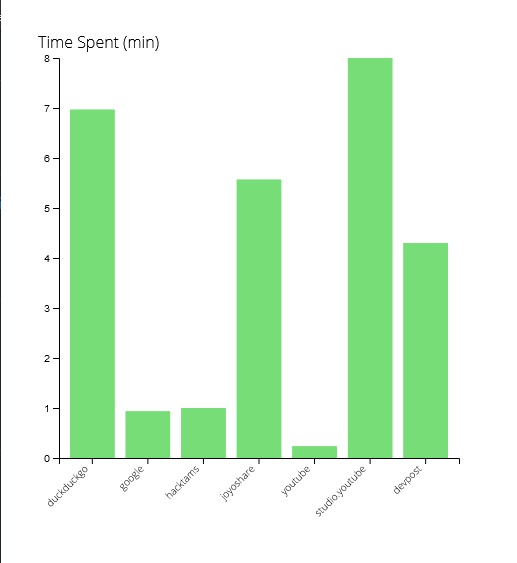
web_log in action!


Inspiration
While many of us spend a good portion of our time online, we do not keep track of its history nor how much time we spend browsing the web. For some, this may not be an issue, however others may want to implement time tracking to improve their work flow and understand how they use their time online. Web Log is a simple graphing extension that provides an easy to read graph that showcases which websites they view and for how long!
What it does
Web Log takes note of the website URL and the time loaded and unloaded to calculate the time spent on a particular website. Once the user requests to view the graph, Web Log quickly sums up the unique entries and displays the data as a bar graph.
How I built it
The entire project was done via HTML/CSS/JS with a graphing library used to display the data. The library is d3.js and is able to parse and interpret the data given.
Challenges I ran into
The way most websites interpret asynchronous events was a huge hassle and was the primary source of frustration. Other minor issues I ran into included web extensions not logging to console without a specific debugging site and general Javascript foolery.
Accomplishments that I'm proud of
This was the first extension that summed up most of what I learned in previous hackathons and projects with d3.js being the most fruitful. Being able to also refine and experiment with promises and content security policy was also something that I am proud of.
What I learned
The biggest thing I learned was that storage, promises, and d3.js are a lot less complicated than I initially thought. Once you learn the syntax, experimenting and customizing becomes a lot easier.
What's next for Web Log
Most likely the option to reset daily, weekly, and monthly. In addition, I would like more customization options including custom color and exporting the raw data as a CSV file.

Log in or sign up for Devpost to join the conversation.