ACC (NSE) | Weekly | Harmonic Reversal This chart highlights a high-probability bullish reversal on ACC (Weekly timeframe) based on Harmonic structure + Smart Money Context.
🔹 Pattern Insight
A well-formed XABCD harmonic structure has completed near the 0.886–0.918 PRZ
Price has respected the D-point demand zone, indicating smart money a

The best trades require research, then commitment.
Get started for free$0 forever, no credit card needed

Scott "Kidd" PoteetPolaris Dawn astronaut

Where the world does markets
Join 100 million traders and investors taking the future into their own hands.

RBL Bank Shows a Powerful Cup Pattern Breakout on Weekly ChartRBL Bank has completed a textbook Cup & Handle pattern on the weekly timeframe, signaling a meaningful shift from a long consolidation phase into a fresh bullish trend. The rounded base formation highlights a gradual transition from distribution to accumulation, indicating growing confidence among l

Tata Steel Ltd The chart exhibits a Cup and Handle pattern on Tata Steel’s daily timeframe.
1. Pattern structure:
Cup: Formed from Nov to early Jan, with a rounded decline and recovery, creating the “U” shape.
Handle: A tighter consolidation from mid‑Jan to Feb, retracing ~10–15% of the cup’s advance, w

PNB Ready to touch ATH 225+ in next 1.5-2 Years timeframePNB Ready to touch ATH 225+ in next 1.5-2 Years timeframe
Fundamentals:
Stock is trading at 1.07 times its book value
Company has delivered good profit growth of 111% CAGR over last 5 years
Company has been maintaining a healthy dividend payout of 19.2%
Technical:
Chart has been forming rounding

SBI Life: Double Top Signals Short-Term Downside RiskSBI Life Insurance is showing signs of a short-term trend reversal after forming a well-defined double top near the ₹2,105–2,110 zone on the hourly chart. The stock has slipped below its neckline support around ₹2,065, confirming bearish structure and indicating distribution at higher levels.
Mome

Policy Bazaar Cmp 1648 Hammer Candle @ SupportPolicy Bazaar Cmp 1648
1. Triple bottom @ support Line
2. Hammer Candle @ Support
2. RSI reversal
Buy above 1652 SL 1610 target 1675-1700-1725-1750
It is just a view, please trade at your own risk.

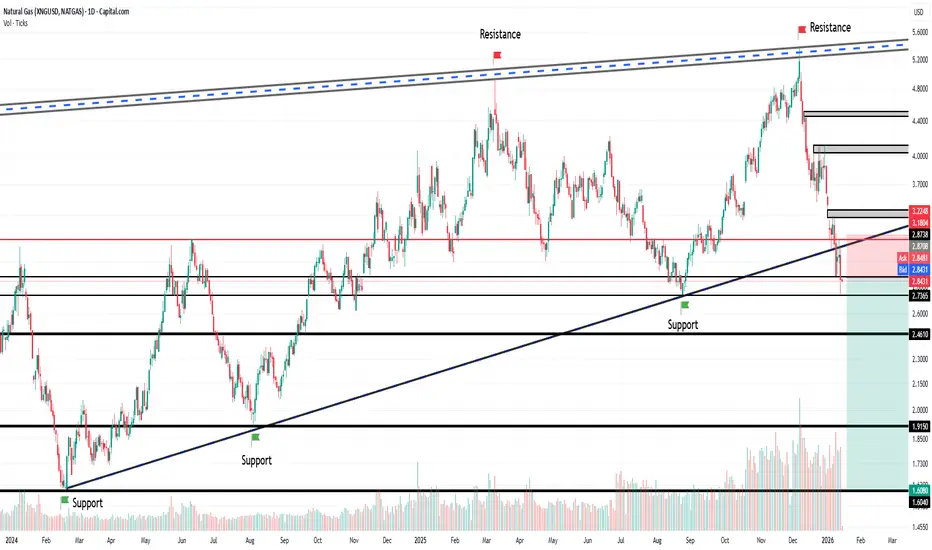
NG : Raising wedge breakdown• NG was trading in a wedge from Jan-2023.
• The wedge is clearly broken on 9th Jan
• Retest of the wedge is completed on14th Jan.
• SL and Target are mentioned in the chart.
• RR is 1:4.
• Educational purpose only. Happy learning
ASTRAL ltd ready to move higher?No strong breakout yet. Stock is consolidating.
above 1500 looks like a breakout level
sl 20-25%
tp 50-75%
rrr 1:2
Key levels to watch:
Support: ₹1,400–1,420
Major support: ₹1,300
Resistance: ₹1,520–1,550
Astral has the potential to move higher, but the ride may not be smooth, there are mixed si

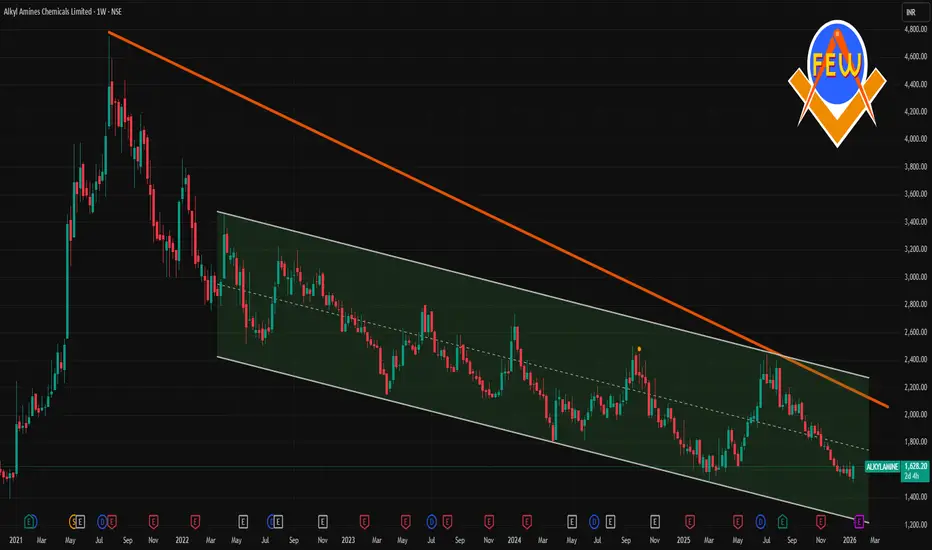
ALKYLAMINE 1 Week Time Frame 📌 Current Price (Latest Market Levels)
Approximate current trading price: ₹1,570 – ₹1,610 range on NSE (mid‑January 2026) — slightly below recent intraday highs/lows around this zone.
52‑week range: Low ~₹1,506 • High ~₹2,438.
Short‑term price action has been slightly bearish to neutral around th
Apollo Tyres Ltd – Chart Analysis (Daily)Price has respected the ₹495–500 support zone multiple times, indicating strong demand at lower levels.
A bullish pin bar has formed near this support, suggesting rejection of lower prices and potential upside continuation.
Current price is trading above support and near ₹525–530, showing improvin

See all editors' picks ideas
DeeptestDeeptest: Quantitative Backtesting Library for Pine Script
━━━━━━━━━━━━━━━━━━━━━━━━━━━━━━━━━━
█ OVERVIEW
Deeptest is a Pine Script library that provides quantitative analysis tools for strategy backtesting. It calculates over 100 statistical metrics including risk-adjusted return ratios (Sharpe

Arbitrage Detector [LuxAlgo]The Arbitrage Detector unveils hidden spreads in the crypto and forex markets. It compares the same asset on the main crypto exchanges and forex brokers and displays both prices and volumes on a dashboard, as well as the maximum spread detected on a histogram divided by four user-selected percenti

Multi-Distribution Volume Profile (Zeiierman)█ Overview
Multi-Distribution Volume Profile (Zeiierman) is a flexible, structure-first volume profile tool that lets you reshape how volume is distributed across price, from classic uniform profiles to advanced statistical curves like Gaussian, Lognormal, Student-t, and more.
Instead of forcin

Multi-Ticker Anchored CandlesMulti-Ticker Anchored Candles (MTAC) is a simple tool for overlaying up to 3 tickers onto the same chart. This is achieved by interpreting each symbol's OHLC data as percentages, then plotting their candle points relative to the main chart's open. This allows for a simple comparison of tickers to tr

Vdubus Divergence Wave Pattern Generator V1The Vdubus Divergence Wave Theory
10 years in the making & now finally thanks to AI I have attempted to put my Trading strategy & logic into a visual representation of how I analyse and project market using Core price action & MacD. Enjoy :)
A Proprietary Structural & Momentum Confluence System

Per Bak Self-Organized CriticalityTL;DR: This indicator measures market fragility. It measures the system's vulnerability to cascade failures and phase transitions. I've added four independent stress vectors: tail risk, volatility regime, credit stress, and positioning extremes. This allows us to quantify how susceptible markets are

Volatility Risk PremiumTHE INSURANCE PREMIUM OF THE STOCK MARKET
Every day, millions of investors face a fundamental question that has puzzled economists for decades: how much should protection against market crashes cost? The answer lies in a phenomenon called the Volatility Risk Premium, and understanding it may fundam

Volume Gaps & Imbalances (Zeiierman)█ Overview
Volume Gaps & Imbalances (Zeiierman) is an advanced market-structure and order-flow visualizer that maps where the market traded, where it did not, and how buyer-vs-seller pressure accumulated across the entire price range.
The core of the indicator is a price-by-price volume prof

Match Finder [theUltimator5]Match Finder is the dating app of indicators. It takes your current ticker and finds the most compatible match over a recent time period. The match may not be Mr. right, but it is Mr. right now. It doesn't forecast future connection, but it tells you current compatibility for today.
Jokes aside,

Trend Line Methods (TLM)Trend Line Methods (TLM)
Overview
Trend Line Methods (TLM) is a visual study designed to help traders explore trend structure using two complementary, auto-drawn trend channels. The script focuses on how price interacts with rising or falling boundaries over time. It does not generate trade sign

See all indicators and strategies
Community trends
ACC (NSE) | Weekly | Harmonic Reversal This chart highlights a high-probability bullish reversal on ACC (Weekly timeframe) based on Harmonic structure + Smart Money Context.
🔹 Pattern Insight
A well-formed XABCD harmonic structure has completed near the 0.886–0.918 PRZ
Price has respected the D-point demand zone, indicating smart money a
Infosys - Breakaway GapInfosys was trading sideways (consolidating) for several weeks between roughly ₹1,617 and ₹1,653. The "box" shows the price jumping completely over that resistance level. When a gap bypasses a major price barrier like this, it is "breaking away" from the old range to start a new trend.
This gap oc

Best Method to Trade Large Cap Stocks in 2026 ?Hello everyone, in this video I am explaining how to identify strategy locations - where exactly you need to look on the charts to create a better strategy in terms of Large cap stocks .
However the Mid and small ones do not follow these rules . I hope I was able to share my experience .
Charts us

How I use Water Element Zodiac in Time Cycle (Cipla)First of all, Lord Dhanvantari is considered the god of Ayurveda and medicine, not Brihaspati (Jupiter). but in astrology, the role of Jupiter is very important in the field of medicine and pharmaceuticals.
The 'Jiva' factor (the factor of life)
In astrology, Jupiter is called 'Jiva'. This mean

UJJIVANSFB – Cup & Handle at Multi-Year ResistanceThe stock has formed a well-defined long-term Cup & Handle structure after an extended base. Price is now testing a multi-year resistance zone, where repeated attempts suggest gradual absorption of supply. The rounded base reflects accumulation, while the handle shows controlled consolidation. This

PNB Ready to touch ATH 225+ in next 1.5-2 Years timeframePNB Ready to touch ATH 225+ in next 1.5-2 Years timeframe
Fundamentals:
Stock is trading at 1.07 times its book value
Company has delivered good profit growth of 111% CAGR over last 5 years
Company has been maintaining a healthy dividend payout of 19.2%
Technical:
Chart has been forming rounding
BANL OF INDIA ANALYSISTHIS IS MY CHART OF THE WEEK PICK
FOR LEARNING PURPOSE
BANK OF INDIA- The current price of BANK OF INDIA is 157.34 rupees
I am going to buy this stock because of the reasons as follows-
1. It has given a closing above last 8 year resistance with some good volume and looks great.
2. This stock h

UNION BANK OF INDIA | Monthly Chart – Breakout Confirmed UNION BANK OF INDIA | Monthly Chart – Breakout Confirmed 🚀
The Cup & Handle breakout is now clearly visible on the monthly chart, validating the setup discussed earlier.
🔹 Price has closed decisively above the handle resistance (~₹160–162 zone), confirming the breakout.
🔹 Monthly average volume h

Tata Steel Ltd The chart exhibits a Cup and Handle pattern on Tata Steel’s daily timeframe.
1. Pattern structure:
Cup: Formed from Nov to early Jan, with a rounded decline and recovery, creating the “U” shape.
Handle: A tighter consolidation from mid‑Jan to Feb, retracing ~10–15% of the cup’s advance, w
RBL Bank Shows a Powerful Cup Pattern Breakout on Weekly ChartRBL Bank has completed a textbook Cup & Handle pattern on the weekly timeframe, signaling a meaningful shift from a long consolidation phase into a fresh bullish trend. The rounded base formation highlights a gradual transition from distribution to accumulation, indicating growing confidence among l
See all stocks ideas
Tomorrow
AETHERAether Industries Ltd.
Actual
—
Estimate
4.10
INR
Tomorrow
TIPSMUSICTips Music Limited
Actual
—
Estimate
4.20
INR
Tomorrow
OBEROIRLTYOberoi Realty Limited
Actual
—
Estimate
20.30
INR
Tomorrow
BHELBharat Heavy Electricals Limited
Actual
—
Estimate
1.04
INR
Tomorrow
BIOCONBiocon Limited
Actual
—
Estimate
1.17
INR
Tomorrow
GNAGNA Axles Ltd
Actual
—
Estimate
—
Tomorrow
SUPRIYASupriya Lifescience Limited
Actual
—
Estimate
—
Tomorrow
KAJARIACERKajaria Ceramics Limited
Actual
—
Estimate
8.13
INR
See more events
Jan 20
3284Narmadesh Brass Industries Limited
Exchange
BSE
Offer price
0.166
USD
Jan 21
F
FUSEGre Renew Enertech Ltd.
Exchange
BSE
Offer price
1.11 - 1.16
USD
Jan 22
EMIArmour Security (India) Ltd.
Exchange
NSE
Offer price
0.61 - 0.63
USD
Jan 23
OHLAAritas Vinyl Limited
Exchange
BSE
Offer price
0.44 - 0.52
USD
Jan 28
B
BRSDigilogic Systems Ltd.
Exchange
BSE
Offer price
1.09 - 1.15
USD
See more events
Community trends
"Bitcoin: A calculated, long-term strategic asset, not a bubbleBitcoin is not a bubble, but a serious and strategic asset that has been created with careful consideration and a long-term vision.
The entire history of BTCUSD (Bitcoin price) is a fascinating journey – starting in 03/01/2009 and continuing to today (January 2026).
2009 → Bitcoin's inception (whi

$AXS Crashed 98% From Its ATH. Now It Just Pumped 65% In One DayNYSE:AXS Crashed 98% From Its ATH. Now It Just Pumped 65% In One Day. Here’s What Changed:
After A Brutal -99.67% Drop From Its $166 ATH to $0.55, NYSE:AXS Is Finally Showing Strength.
Price Surged 65%+, Reclaiming $2 With $1.18 Billion+ Volume And Is Up Over 190% In The Past Month
Driven By A

BTC Uptrend or Downtrend- 4 Hour Time FrameTechnical Structure Analysis
Fibonacci Retracement Analysis (Image 2)
0.5: ~$103,490 - Mid-level resistance
0.382: ~$98,177 - Current battle zone
0.236: ~$91,942 - Critical support
Current Formation: Descending Triangle/Wedge
Lower highs: $125k → $108k → $103k → $98k
Horizontal support: $92-93k r

BTCUSD – Daily Timeframe AnalysisBitcoin is currently trading near a critical horizontal resistance around 95,300, which has acted as a strong supply zone in the recent past. Price has formed a higher-low structure, respecting the rising trendline support, indicating a gradual shift from bearish to neutral–bullish momentum.
The on

Elliott Wave Structure - classic 5-wave impulse cycleWave 1
2016 → 2017 move (up to ~19k)
Wave 2
2018 crash (~3k)
Wave 3
2018 → 2021 rally (~69k)
Wave 4
2021 → 2022 bear market (~15.5k)
Wave 5 (current)
2023 → now (~115k+ structure)
Everything inside Wave 5 = lower timeframe waves, not new major waves.
Based on this count + Fibonacci relationships:
Co

BTCUSD Short Trade -
BTCUSD short trade executed and managed as planned.
Entry: 87,300
Stop Loss: 87,650
Target: 86,600
Risk defined. Trade managed without hesitation.
Sticking to the plan and letting the levels work.
#BTCUSD #Bitcoin #CryptoTrading #ShortTrade #TradeRecap #TradingView #PriceAction #RiskManagement #C

Retest of Support BTC1. Rest of the Support(Previous Resistance) Completed
2. Falling wage Wxyz Correction Completed
3. Hourly bulish Divergence is Visible
Next leg 98-99k Probability 60%

BTCUSD Bullish Structure: New Demand, Resistance & UpsideBTCUSD shows a continuation of the broader bullish trend after a strong impulsive move higher, followed by a healthy pullback and consolidation. Price previously respected the rising structure and confirmed bullish strength with a clear Break of Structure , indicating trend continuation rather than

ETHUSD Strategic Long: Waiting for Resistance-to-Support FlipTrade Strategy & Setup
The price is currently testing a major resistance zone. Rather than chasing the initial move, I am looking for a high-probability entry based on the following criteria:
Resistance Test: Price is currently trading near a key resistance level. I am monitoring for a clean bre

Bitcoin gearing for upmoveBitcoin has formed a base around its earlier resistance. Now, in the higher time frame, it has started up move while in lower time frame, it's showing a possible retracement. Either path '1' or '2' can be taken, where it will dip on its trendline first (removing weak hands) and rise.

See all crypto ideas
SILVER (XAGUSD) 1HRsWING TRADE
- EARN WITH ME DAILY 10K-20K –
SILVER (XAGUSD) Looking good for upside..
When it break level 93053 and sustain.. it will go upside...
BUY@ 93053
Target
1st 96004
2nd 98886
Enjoy trading traders.. Keep add this STOCK in your watch list..
Big Investor are welcome to join the ride ..
L

Gold weekly rotation between 4682 supply and 4420 demand🟡 XAUUSD – Weekly Smart Money Plan | by Ryan_TitanTrader (17/01)
📈 Market Context
Gold remains structurally bullish on the higher timeframe, but weekly price action has clearly transitioned into a controlled Smart Money rotation. After delivering buy-side liquidity into premium, continuation has

Silver is also reactingSame as Gold, reacting from an early but strong zone with pending liquidity and demand below.
Worth taking a small risk right now to rise the rally if it starts early
Otherwise can as well wait for the unmitigated area below for full size position.

XAUUSD – Rejection From Premium Zone Trade Idea Summary
Gold has tapped into a key premium zone, swept local liquidity, and is now showing early signs of rejection. Price has also broken below the short-term structure on the 15m chart, aligning with a corrective pullback setup toward discounted levels.
This setup offers a clean risk-

GOLD (XAUUSD): 4H Channel Top & 1H Consolidation BreakoutTechnical Analysis
4H Timeframe: Gold is currently trading within a well-defined ascending parallel channel. It has reached the upper boundary, which is a significant resistance zone.
4H Timeframe: Instead of a sharp rejection, the price is holding at the channel top, forming a rectangle box (

NEXT GOLD PEAK (XAUUSDFriends, this is the gold chart, and it's a monthly chart. Let's not beat around the bush and get straight to the point: when does gold reach its top and when does it hit its bottom? So, let me tell you.
The price of gold is highest when Jupiter is in a fire sign, that is, Aries, Leo, and Sagittari

“Liquidity Grab → Pivot Support Holds → Next Bullish Leg Loading🔍 Market Structure & Key Observations
Overall market structure remains bullish with clear higher highs & higher lows ✔️
Price is respecting the upward trendline, confirming ongoing bullish momentum 📈
The recent sharp drop was a liquidity sweep into the Pivot Point / Demand zone, followed by a str

Gold hadn't lost steam yetI feel gold hadn't lost al his steam and still room for higher prices is left. So after little correction i assume gold will continue it's journey upwards. Although I am not expecting any blast.

Long may be possible Expect this but need patient to follow the Trend. Pattern look like trying to make higher lower and Trent will be broken sooner.
See the trend movement carefully

MCX Silver: Healthy Dip Before Next RallyMCX Silver is in a strong long-term uptrend on the daily chart. The market has already completed wave 1, 2, and a strong wave 3 upward. After this big rise, price is now expected to make a normal correction (wave 4). This pullback can come toward the 236,000 area, which is an important support zon

See all futures ideas
USDJPY 4HR T/F ANALYSIS -----
usdjpy 4hr t/f ----- breakdown of curve support which name is black mind curve after breakdown we can measure previous pattern now current scenario previous supply can measure so we can go with trend into down side until supply will not complete /
after supply complete we can see any positive

EURUSD | KAALA TARGET Liquidity RespectEURUSD respected KAALA TARGET liquidity zone perfectly.
After a sharp sell-off, price came back and respected the OLD liquidity area again.
KAALA ENERGY also showed weakness before the drop.
Educational purpose only. Not financial advice.


EURUSD: PWH liquidity raid → reversal confirmed.Price grabbed stops above PWH, then dumped hard = classic smart money behavior.
Now the FVG zone becomes sell-side mitigation, with PWL as the next magnet.
✅ Sell retracement
🎯 Target: PWL
⚠️ Invalidation: strong reclaim above FVG
#forextrading #ict #smc #gbpusd #liquidity #fvg

GBPUSD SHOWING A GOOD UP MOVE WITH 1:8 RISK REWARD GBPUSD SHOWING A GOOD UP MOVE WITH 1:8 RISK REWARD
DUE TO THESE REASON
A. its following a rectangle pattern that stocked the market
which preventing the market to move any one direction now it trying to break the strong resistant lable
B. after the break of this rectangle it will boost the market

GBPUSD the range confirmed, can initiate the short trade .GBPUSD the range confirmed, can initiate the short trade with proper SL and target

Bullish Engulfing Pattern🔎 Overview
Overview
The Bullish Engulfing Pattern is a strong price-action formation that appears after a decline or extended consolidation. It occurs when a large bullish candle completely engulfs the previous bearish candle, signaling a decisive shift in control from sellers to buyers. This p

AUDUSD | Bullish SetupPrice action remains bullish, indicating continuation towards 0.6708.
Trend strength supports further upside

Mejor Forex Pair Scanning Session – 4Scanning multiple forex pairs to filter high-quality trade setups. No trades forced, only structure-based opportunities.

AUDUSD LONG SETUP — Bullish Reversal from DemandAUDUSD has tapped into a strong demand zone aligned perfectly with a long-term ascending trendline, showing signs of potential bullish reversal. Price swept the previous intraday liquidity and reacted strongly, indicating buyers are stepping in.
This confluence makes this area a high-probability lon

See all forex ideas
| - | - | - | - | - | - | - | - | ||
| - | - | - | - | - | - | - | - | ||
| - | - | - | - | - | - | - | - | ||
| - | - | - | - | - | - | - | - | ||
| - | - | - | - | - | - | - | - | ||
| - | - | - | - | - | - | - | - | ||
| - | - | - | - | - | - | - | - | ||
| - | - | - | - | - | - | - | - | ||
| - | - | - | - | - | - | - | - |
Trade directly on Supercharts through our supported, fully-verified, and user-reviewed brokers.


