Dojo projects with maps
Built with amCharts Maps.
Interactive tools and experiments from the DataViz Dojo — all powered by amCharts 5 Maps.
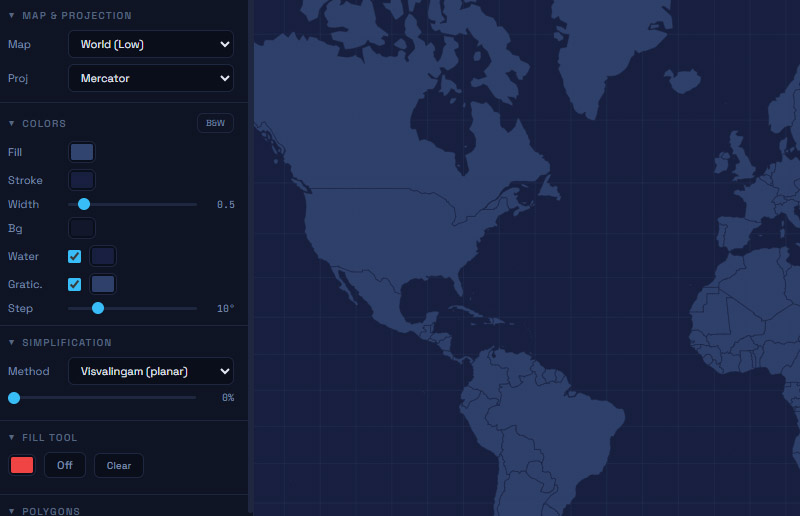
SVG Map Generator
Generate SVG maps of any region in any projection — Mercator, Albers, orthographic, and more. Simplify geometries and download a clean, lightweight SVG.
Generate
Pixel Map Generator
Turn any map into pixel art. Pick from 4 tessellation shapes — squares, hexagons, diamonds, and triangles — paint countries, and export as SVG, PNG, or HTML.
Create
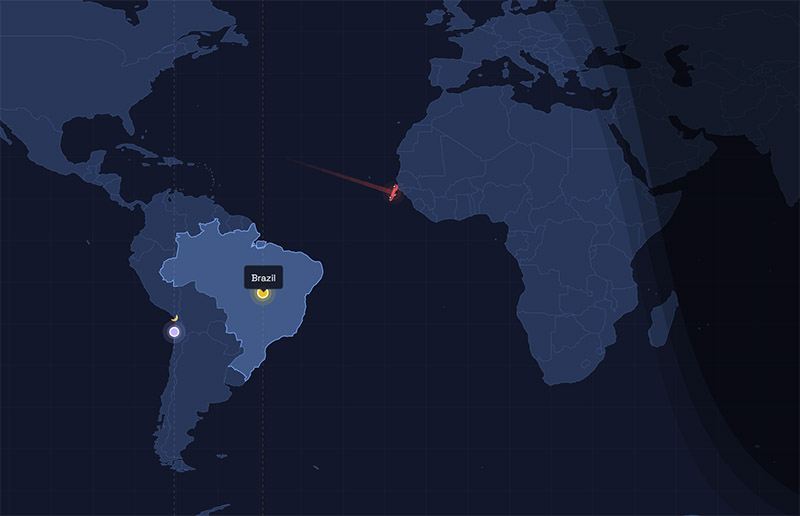
Day & Night World Map
A real-time world map showing the day/night terminator, live sun & moon positions, and current moon phase. Switch between flat map and globe view.
Explore
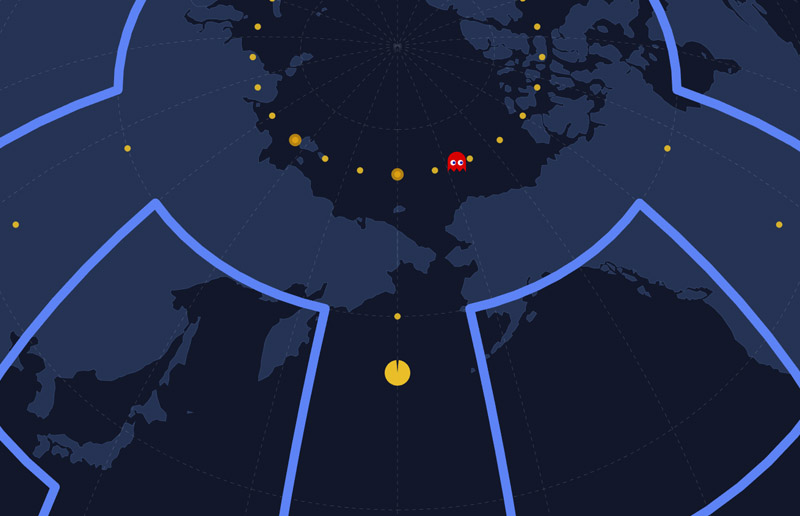
PAC-WORLD
The classic arcade game reimagined on a world map. Navigate Pac-Man across real geography, eat all the dots, and advance through 4 levels.
Play