
Python Logging Handlers: A Deep Dive Into Types, Configuration, and Best Practices
Python’s logging system goes far beyond basic message output. This guide explores handlers, structured logging, performance trade-offs, and real-world patterns for building production-ready logging pipelines.
Python’s logging system goes far beyond basic message output. This guide explores handlers, structured logging, performance trade-offs, and real-world patterns for building production-ready logging pipelines.

Camille is a senior software developer who builds robust desktop and real-time systems for global clients including e-on software, Hitachi, and Alstom. Specializing in Python, C, and C++, he has delivered solutions for railway systems, power infrastructure, video and imaging, 3D software, and web platforms.
Previous Role
Senior Software DeveloperPreviously At

Logging is a core developer responsibility that involves monitoring and recording events that occur in software. It is essential for tracking system behavior and debugging issues. Python’s logging system provides a scalable alternative to print-based debugging, where developers use print() statements to inspect behavior and allows applications to record events with:
- Defined severity.
- Consistent formatting.
- Flexible routing.
By separating message generation from delivery, logging makes it easier to observe and diagnose application behavior across environments.
In this article, I draw on my 20 years of experience building production systems for global companies such as Hitachi and Alstom to explain the core concepts of Python logging. We’ll look at loggers, levels, handlers, and formatters and show how messages flow through the logging pipeline. We’ll also cover common configuration patterns, handler types, and best practices for building robust logging setups.
Core Concepts of Python Logging
Python’s built-in logging system is organized around four main abstractions: Loggers, Levels, Handlers, and Formatters. Each of these components has a specific function that determines how messages are classified, routed, and formatted.
-
Loggers expose methods (
.debug(),.info(),.warning(),.error(),.critical()) to generate logs and define the logger-level filter. They have hierarchical names (e.g.,app.module.submodule) and a level thatfilters which messages get processed. They are the entry point of the logging system. -
Levels control which messages are accepted by loggers and handlers (e.g.,
NOTSET) and define the severity of a message (e.g.,CRITICAL). A logger will ignore messages below its configured level. Each handler can also have its own level filter. - Handlers determine where a log message goes. Possible locations include console streams, files, rotating files, syslog, email, network sockets, memory buffers, or queues. Multiple handlers can be attached to the same logger, and each can have its own formatter and severity level.
- Formatters control how log messages are rendered and can include metadata (e.g., timestamp, module, line number, thread or process IDs). They also allow custom string templates or structured formats like JSON. Each handler can use a different formatter to produce multiple output styles for the same message.

A standard logging process would see a developer calling a method on a logger (for example, logger.info("some message")). The logger then checks its level. If the logger accepts the message (that is, if the message’s level is not lower than the logger’s threshold), it creates a LogRecord containing the message and metadata.
The LogRecord is then passed to all attached handlers. Each handler may check its level and apply a formatter if the message passes. Finally, the log is emitted to its destination by the handler. If propagation is enabled, the LogRecord may continue up to parent loggers, repeating the process with their handlers.
Logging Levels
Python defines six ordered levels: NOTSET, DEBUG, INFO, WARNING, ERROR, and CRITICAL. Each of these has a specific use case and defines the importance of the message, determining whether a message will be processed (also known as selective filtering).
Levels follow a specific severity hierarchy to classify log messages. In ascending order of severity, they are classified as follows:
-
NOTSET (0): This level is essentially a placeholder that indicates that no level is explicitly set; therefore, its severity level is 0. If a logger’s level is
NOTSET, it will inherit its effective level from its parent logger. Developers use this level rarely within code, but its importance lies in its function to defer logging decisions to the embedding application. - DEBUG (10): This level is useful for troubleshooting internal state, control flow, and variable value. It’s also frequently used during development to visualize flow and data. For example, a developer may want to visualize data structure contents to determine the best approach as they build their application.
-
INFO (20): This level is frequently used for routine operational messages to describe application behavior, such as “User logged in,” “Task completed successfully,” or “Background job started.” Administrators typically rely on
INFOlogs to monitor system performance and activity. -
WARNING (30): It warns developers that something unexpected has happened, or that an existing condition might lead to future errors. Despite a
WARNING, however, the application can continue running. An example of such a message could be: “Configuration file missing optional parameter, using default.” -
ERROR (40): An
ERRORlevel points out a serious problem that prevents a program or part of a program from running as intended. Typically, these are failures or exceptions affecting the logic of a program or other critical operations, such as a missing required file or a database connection failure. -
CRITICAL (50): The highest in the hierarchy, a
CRITICALmessage flags severe failures that might compromise the system in its entirety. It normally requires immediate attention and is often used to point out failures such as data corruption or system crashes.
The filtering occurs at two points throughout the logging pipeline:
- The logger-level threshold determines which message (according to severity) will enter the logging system and discards those below the logger’s configured level.
- The handler-level threshold is more granular, where each handler attached to a logger independently filters messages and may only emit those that meet or exceed its configured level.
Log Formatters
Log formatters define how log records are presented, and enrich them with metadata. This metadata creates diagnostic clarity that helps developers and operators understand what happened and why. Some helpful metadata may include the following:
-
Timestamps (
%(asctime)s) point out when the event occurred. -
Logger names (
%(name)s) identify what part of the application has generated the message. -
Modules or functions (
%(module)s,%(funcName)s) identify specifically which function originated the message. -
Line numbers (
%(lineno)d) flag the line number within the code file. -
Thread or process IDs (
%(thread)d,%(process)d) are useful for identifying threads or processes in multithreaded or multiple-process applications. -
Severity levels (
%(levelname)s) indicate the importance of the message at hand.
Customizing Log Output
Unlike logging levels, these formatters are highly customizable for developers who want to tailor their log outputs to be as specific as possible.
There are several ways to configure log outputs. Most developers may choose to use template string formatting that relies on placeholders in a string format:
"%(asctime)s - %(name)s - %(levelname)s - %(message)s"
When in need of log outputs that are machine-parsable and integrate with log collectors or other machine-led context, structured formats might be a better choice. In such cases, JSON or key-value pairs are used:
'{"time": "%(asctime)s", "logger": "%(name)s", "level": "%(levelname)s", "message": "%(message)s"}'
Different handlers may use different formatters for the same event (handler-specific formatting), starting with JSON formatting for centralized ingestion. This way, multidestination logging is facilitated without duplicating log generation code.
import logging

logger = logging.getLogger("app")
logger.setLevel(logging.INFO)

# Console handler with a simple format
ch = logging.StreamHandler()
ch.setFormatter(logging.Formatter("%(levelname)s: %(message)s"))

# File handler with a JSON-like format
fh = logging.FileHandler("app.log")
fh.setFormatter(logging.Formatter('{"time": "%(asctime)s", "msg": "%(message)s"}'))

logger.addHandler(ch)
logger.addHandler(fh)

logger.info("Process started")
Handlers and Their Roles
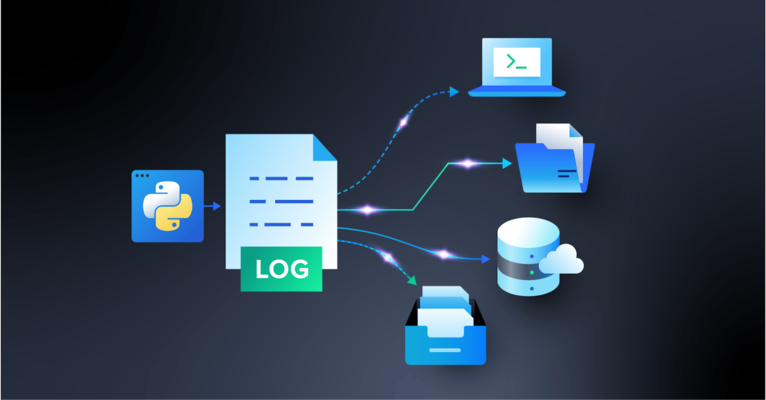
Within the logging pipeline, handlers act as a routing layer between the logger and the output. Their core function is to dispatch log messages to their final destination. The same log record can be shared with multiple handlers simultaneously, and each handler can apply independent formatting and severity filters.
Handlers support multiple simultaneous outputs, including rotation policies, buffering, and remote delivery. Typical destinations include:
- Console: For real-time diagnostics and debugging.
- File: For a single, persistent log on disk without automatic rotation.
- Rotating files: For automatically managing log file growth by size or time.
- System logs: For system monitoring (via Unix syslog or Windows Event Log).
- Email: For communication with stakeholders in case of system crashes or failures.
- Network: For logging over TCP or UDP to remote servers or collectors.
- Memory or queue: For buffering messages in memory or queues for nonblocking delivery.
Logger Behavior and Propagation
When dealing with logs, I’ve learned that it’s important to have an organized system, especially in applications that generate numerous log files. A well-structured setup makes it easier to find your logs in case of failure and see where problems are originating.
Loggers use a hierarchical naming structure where names are dot-separated and inherit their configuration from parent loggers. This allows for centralized control in multimodule and overall more complex applications.
Here is an example of a hierarchical naming structure for loggers:
app
app.database
app.database.connection
app.api
app.api.auth
While this hierarchy typically mirrors the package or model layout for clarity’s sake, it is based strictly on string naming conventions rather than the file system itself.
Each logger’s parent is identified by stripping the rightmost suffix. For example, in app.database, the parent is app, and the parent of app is the root logger.
Logging in Multimodule Applications
When an application is more complex and presents multiple modules, the functionality of this hierarchical naming structure is more apparent. Unless explicitly overridden, loggers inherit effective log level, handler, formatter behavior, and filters from their ancestors. This way, with shared parent loggers, it becomes easier to control logging behavior for an entire project.
Put into practice, the process looks like this:
- The developer configures one main parent logger (e.g.,
app). - All child loggers (
app.api,app.db, etc.) will automatically use the same handlers, produce logs with the same formatting, and follow the same severity rules. - When needed, individual modules can override specific behavior. For example,
app.databasecan attach a file handler with a higher severity level to capture only database errors without affecting the rest of the application logs.
Effective Log Level and the Role of NOTSET
While every logger has a level, what actually controls filtering is the effective log level. If the logger has an explicitly set level, that level is used (or it can be said to be effective). If, on the other hand, the logger’s level is set to NOTSET, Python walks up the hierarchy to find the first ancestor with a non-NOTSET level and uses it as the logger’s effective level.
Semantically, the difference between a logger’s level and its effective level appears as follows:
-
logger.levelis the explicit level; -
logger.getEffectiveLevel()is what actually governs filtering.
Propagation: Recording a Log’s Journey
In Python logging, propagation is the process that determines whether the LogRecord created and processed by the logger’s own handlers will continue up a logger hierarchy.
It can be set to True, which is the default (propagate=True), or False (propagate=False). When set to True, the log record is handled by the current logger’s handlers, passed to the parent logger’s handlers, and finally all the way to the root through the grandparent. If set to False, the record stops at the current logger, and isn’t received by the parent handlers.
Sometimes, propagation can cause duplicate logs. This may happen when both the child and parent loggers have handlers and propagate is set to True, causing the LogRecord to be produced at all levels.
This is a common mistake in Python logging, but one that’s easily avoidable by configuring handlers on one top-level application logger and letting child loggers inherit their characteristics without adding handlers to every module.
Another reason for duplicate logs that I encounter often is when multiple threads try to log the same event at once. The simplest way to prevent this is to have a central logging system outside the threads, so each event is recorded just once.
Python Logging Handlers Explained
In Python’s logging system, handlers form the delivery and routing layer. They define where log messages will be delivered, including console streams, files, rotating archives, network sockets, system logs, email systems, or in-memory buffers.
Every handler is responsible for emitting a LogRecord to a specific destination and then applying its own filtering policy (severity, custom filters), formatting (plaintext, structured JSON, machine-readable fields), and I/O semantics (sync, async, buffered, rotating, networked). One logger may have multiple handlers.
StreamHandler and FileHandler
StreamHandler is the primary handler for development and interactive sessions, working with containerized environments where stdout/stderr is captured by orchestration systems (for example: Kubernetes, Docker, serverless platforms). It normally goes hand in hand with human-readable formats. It delivers logs to file-like streams like sys.stdout or sys.stderr.
FileHandler writes log entries to a specified file path. It is best used for simple logging that is persistent and for applications that rely on local disk stability (due to the log volume).
These foundational handlers introduce the core mechanics of level filtering, message formatting, and basic emission behavior.
RotatingFileHandler and TimedRotatingFileHandler
RotatingFileHandler rotates files once they reach a configured maximum size, which prevents unbounded disk usage and keeps a configured number of archived log files. It’s common in always-on services like API servers or back-end daemons.
TimedRotatingFileHandler produces time-stamped log sets (ideal for archival and batch analysis) and is appropriate for workloads generating predictable daily or hourly log volumes.
Python’s standard library does not include more specialized and advanced filesystem handlers like compression handlers or OS-integrated rotation daemons, but RotatingFileHandler and TimedRotatingFileHandler are considered the “advanced” options within the built-ins.
Network Handlers (SocketHandler, DatagramHandler)
Network handlers (SocketHandler (for TCP) and DatagramHandler (for UDP) transmit serialized log records to remote endpoints. While TCP is appreciated for reliability, UDP is used for low latency. Distributed systems and microservices with centralized ingestions are good options for these.
System and Email Handlers (SysLogHandler, NTEventLogHandler, SMTPHandler)
SysLogHandler delivers messages to Unix/Linux syslog daemons. Used for servers where /var/log and syslog are managed by standard operational pipelines.
NTEventLogHandler sends logs to the Windows Event Log. Works well in enterprise Windows environments.
SMTPHandler sends log messages via email, primarily for alerting purposes.
MemoryHandler, QueueHandler, QueueListener
MemoryHandler buffers records in memory and flushes them conditionally, either when a size threshold is reached or a severe log event takes place. It can be helpful in performance-sensitive or embedded environments.
QueueHandler pushes log records into a queue (such as queue.Queue, multiprocessing queues).
QueueListener consumes queue items and processes them using one or more actual handlers in a background thread or process. Ideal for web servers, concurrent applications, or systems with high log volume, it is usually paired with QueueHandler.
Advanced Handlers (NullHandler, WatchedFileHandler, BaseRotatingHandler)
NullHandler prevents unwanted “No handler configured” warnings in packaged libraries. Used primarily by library authors to prevent unwanted warnings when an importing application has not configured logging.
WatchedFileHandler is designed for Unix environments where external rotation tools manage the underlying log files. Rather than assuming Python controls rotation, it monitors the log file’s inode on each write. If an external rotation has replaced the file, the handler automatically closes the old file and opens the new one.
BaseRotatingHandler is the foundational class behind Python’s rotation-related handlers. It implements the shared mechanics for determining when rotation should occur, managing file descriptors, and performing rollover. Although seldom used directly, it clarifies how rotation triggers, file handles, and rollover mechanisms are inherited by rotation-related handlers.
Logging to Multiple Destinations
Any logger may attach several handlers simultaneously, and each handler can have its own formatter and severity level. This means that a single log event can appear in multiple places at once (for example, human-readable text in the console, structured JSON in a file for ingestion, and a critical alert sent by email) without modifying the application’s logging calls.
Configuring Logging for Real Applications
Logging to Multiple Destinations
As we saw, a single logger is able to attach multiple handlers. Each handler applies its own severity threshold and formatter, producing different output representations from the same underlying log event. Handlers will then emit the same event to files, consoles, remote collectors, and buffers, avoiding code duplication completely.
Handlers may target different destinations simultaneously. Examples include:
- Console output for developers.
- Files for auditing or debugging.
- Network endpoints for aggregation.
- Buffers for deferred processing.
Python’s logging to multiple destinations is an example of its ability to fan out logs cleanly across a mixture of targets, which has the added advantage of isolating delivery concerns as well as failures (a failure in one handler does not affect the others).
Formatter and Filter Customization
Formatters control how log records are rendered. They define which fields appear, in what order, and whether the output is plaintext or structured.
Filtering occurs earlier in the pipeline than formatting, operates directly on LogRecord data, and determines whether a record proceeds to formatting at all.
Because filters see the record before formatting, they can also modify it. Common uses include:
- Attaching contextual data (such as request or correlation IDs, user and session information, etc.).
- Suppressing low-value or irrelevant messages.
- Routing specific categories of messages to selected handlers.
More advanced setups often rely on structured output rather than free-form text. JSON formatting, contextvars, and key-value records allow contextual data to flow through async code paths and across service boundaries without being threaded through every function call.
Some concerns remain purely practical rather than architectural:
- Custom timestamps align logs across multiple environments.
- Colorized output makes logs more readable during debugging.
- Multiline templates make room for stack traces and other diagnostic details.
Custom Handlers and Structured Logging
With custom handler classes, developers can manipulate Python’s logging system to emit log records to standard destinations like HTTP APIs, message queues, databases, and external storage systems.
Delivery logic specific to a certain domain can be integrated into applications easily (by subclassing logging.Handler). This can be done while still fully participating in the standard logging pipeline.
Structured JSON logging takes a different approach to log output: Instead of free-form text, each event is emitted as structured key-value data. This makes logs easier to correlate across requests, trace through services, and index downstream. In distributed and microservice environments, this structure becomes essential (rather than optional).
Structured-logging libraries such as structlog and Loguru build on or wrap Python’s logging framework and provide additional pipelines for structured formatting, contextual field injection, and simplified configuration.
Avoiding Common Pitfalls
Duplicate handlers can be a source of inflated log volume. This sometimes happens when handlers are attached in multiple modules or when configuration code is executed multiple times. Repeatedly calling basicConfig or file opening can also contribute to log inflation and/or degrade application performance.
Misconfigured propagation can cause log records to be forwarded to parent loggers that also have handlers attached, resulting in the same message being emitted multiple times. This typically happens when both child and parent loggers define handlers while propagation remains enabled.
These issues can be solved by avoiding direct use of the root logger and centralizing logging configuration in application-level loggers, which ultimately helps maintain predictable behavior.

The disable_existing_loggers Pitfall in dictConfig
When using logging.config.dictConfig(), one setting often causes silent production issues: "disable_existing_loggers": True
This option defaults to True. It disables every logger that already exists unless it is explicitly defined in the configuration dictionary.
Internally, this sets: logger.disabled = True
A disabled logger drops all records without warning.
Why This Breaks Real Applications
In modern Python systems, many loggers are created before configuration runs:
- Frameworks (Django, FastAPI, Celery)
- Servers (Gunicorn, Uvicorn)
- Libraries (SQLAlchemy, Requests)
- Your own modules at import time
If dictConfig() runs afterward with disable_existing_loggers=True, those loggers are silently disabled unless redefined.
The result: Logs disappear. Worse, there’s no error or traceback, just silence.
A Safer Method
For most real-world applications, I recommend a safer approach:
"disable_existing_loggers": False
This method preserves existing loggers and avoids the silent loss of third-party or framework logs. You must still manage handler duplication carefully, but it’s easier to detect duplicate logs than missing ones.
Here’s are some general guidelines:
-
Applications: Use
"disable_existing_loggers": False. -
Libraries: Don’t configure logging; add a
NullHandler. -
Fully controlled systems: Use
Trueonly if you explicitly configure every logger.
Logging in Scalable, Multimodule, and Multithreaded Systems
When dealing with a large application, scaling can be challenging. As systems evolve and grow, problems that are easier to dismiss in smaller codebases tend to emerge. Scaling-related blockers may show up as duplicated messages, inconsistent formatting, race conditions (caused by concurrent writes to shared handlers or files), and unexpected costs due to performance.
Ensuring multimodule logger consistency and adhering to multiple-process logging best practices is important to avoid overhead when building larger projects.
Multimodule Logger Consistency
In multimodule applications, a way to keep everything on track is naming consistency. Python’s logging hierarchy is string-based, which means logger names define how configuration is inherited. Maintaining a disciplined use of dotted logger names is the proper way to establish a uniform behavior. When modules follow the same naming prefix, they naturally fall under the same configuration and behave consistently.
With a centralized logging configuration, formatting, severity levels, routing, and filters are only defined once and applied everywhere. This way, different modules don’t run the risk of silently diverging in behavior due to handler attachment or local configuration; a single configuration entry point becomes the only source of truth for logging behavior.
As we saw previously, logger inheritance allows child loggers to adopt parent settings and reduces granular maintenance efforts.
Thread-safe and Multiple-process Logging
In multithreaded applications, logging has the responsibility of ensuring that concurrent log emissions do not interfere with one another. Python’s logging module provides built-in handlers that serialize writes internally, which prevents interleaved log lines or partially written messages.
Nevertheless, thread safety supports correctness but does not eliminate performance costs. Synchronous handlers can still introduce contention when numerous threads log simultaneously.
Multiple-process logging is more complex. When multiple processes write to the same log file, contention can corrupt output or lose messages. Standard file handlers are thread-safe but not process-safe, so shared access must be coordinated. Developers tend to approach it with strategies like routing logs through a single process, using network-based handlers, or delegating writes to an external collector.
A good solution for both threading and multiprocessing scenarios is queue-based logging pipelines. A QueueHandler pushes log records into a thread- or process-safe queue, while a QueueListener in a separate thread or process handles formatting and emission. This decouples log creation from I/O and reduces blocking.
In scalable systems, reliable logging comes from using thread‑safe handlers, process‑aware routing, and pipelines that are nonblocking by design.
QueueHandler and QueueListener Patterns
Both types of queue-based logging pipelines have indispensable roles that are important for developers who work with complex systems:
- QueueHandler: A logging handler that pushes log records into a thread-safe or process-safe queue instead of writing them directly to a file or console.
- QueueListener: A companion object that runs in a separate thread or process, consuming records from the queue and dispatching them to configured handlers (e.g., file, console, network).
When QueueHandler sends logs into the queue, it makes sure that worker threads or processes don’t block on I/O. QueueListener consumes the logs it has received (asynchronously) and then delivers them to the appointed destination. This approach allows the application to run as intended and smoothly without waiting for logging operations to complete.
Network and Distributed Logging
Modern systems generate vast amounts of operational data, and managing that flow is critical to reliability. Logs must move from local services into centralized collectors and pipelines, where they are indexed and analyzed. Distributed layers for logs support developers with better visibility of the messages that are important for their work.
TCP and UDP Logging Differences
The main difference between TCP (Transmission Control Protocol) and UDP (User Datagram Protocol) is how they handle connections and reliability. With UDP, there’s no guarantee that the data actually reaches the receiver. That can work for logs that are sent repeatedly (such as every second) as messages are continuously replaced by incoming ones. But for one-off or critical log events, I consider TCP the safer choice because it requires a receipt acknowledgment from the receiver before clearing the queue. For agent-specific cases, the best protocol ultimately depends on the nature of the information being transmitted.
Choosing the correct protocol depends on system requirements: TCP is a great choice for authoritative audit logs, error reporting, and critical event capture, while UDP is for lightweight and low-latency diagnostic streams where occasional packet loss is an acceptable downside.
Here is how they differ from one another at their core:
- TCP is reliable: Built for orderly and guaranteed delivery, TCP makes sure that every packet is acknowledged, retransmitted if lost, and assembled in sequence. The trade-off, however, is performance. Such precision and reliability do come with some overhead, which can slow down log ingestion.
- UDP is fast: It sends packets without establishing a connection, without acknowledgments, and without guarantees of arrival. While this obviously makes it less reliable, it is fast, lightweight, and low latency.
SocketHandler Configuration
By implementing a SocketHandler, applications can transmit log records over TCP to a centralized collector, so that logs are aggregated and processed across distributed environments in a consistent manner.
A SocketHandler core setup entails the following steps:
- Define the remote server’s address and port where logs will be sent.
- The handler opens a TCP socket to the collector, maintaining a persistent channel (for log delivery).
- Apply appropriate log formatters so that transmitted records are structured and parsed downstream.
Retry behavior, error handling, and fallback logic help maintain stability when the remote log collector becomes temporarily unavailable. When connections drop, the handler attempts reconnection to avoid losing logs (retry behavior). Exceptions during transmission are caught and managed to prevent application crashes (error handling). If the collector is unavailable, logs can be redirected to local files or buffers until connectivity is restored (fallback logic).
SocketHandler is typically paired with collectors such as syslog servers, Fluentd instances, or custom TCP receiver. These consume messages for additional processing and indexing.
DatagramHandler Configuration
The DatagramHandler provides a lightweight mechanism for transmitting logs over UDP. Unlike TCP-based handlers, it does not maintain a persistent connection. This makes it well-suited for diagnostic streams that are high‑volume and low‑latency, and where occasional packet loss is acceptable.
A DatagramHandler core setup entails the following:
- Each log record is encoded into a datagram and sent individually.
- The handler requires a host and port definition to direct packets to the appropriate collector.
- No connection handshake or acknowledgment is performed.
Port configuration and message-size awareness are important for compatibility with downstream collectors that expect lightweight and stateless log messages. UDP packets have size limits (commonly around 65 KB, but often much smaller, around 1400 bytes, to avoid fragmentation). Handlers must make sure that log messages fit within these boundaries to avoid them being truncated or fragmented.
Remote Logging and Observability Pipelines
Logs rarely remain on the host where they are generated. Local handlers typically emit logs into intermediary agents such as Fluentd, Logstash, or vector. These agents perform actions on the logs (such as normalization, parsing, and enrichment) before forwarding them to a centralized storage location.
Distributed logging stacks then ingest these structured records into storage and observability platforms. Elasticsearch (as part of the ELK stack) indexes logs to facilitate querying and visualization, Datadog combines logs and metrics in one system, and Grafana Loki (often called Loki) applies label-based storage.
At a high level, the remote logging architecture follows a clear flow: Application loggers emit messages → network handlers (TCP/UDP or HTTP) transmit them → log collectors or agents process and forward records → processing pipelines parse, transform, and index logs → dashboards and observability tools provide searchable access. This illustrates the full life cycle of distributed logging.
Extending Python’s Logging System
Python’s logging framework is rich by default, but it has also been designed to be extensible beyond basic configuration. More advanced extension points exist as tools for developers to enrich their logging records with custom metadata, automatically inject contextual information, and deliver logs to destinations beyond the standard handler set.
Custom LogRecord Factories
A custom LogRecord factory allows developers to inject additional attributes into every log record as it is created and extend the default metadata fields. Defining a record factory involves writing a logging.setLogRecordFactory() function. This function creates or modifies an existing LogRecord instance and then registers it globally. Once registered, all loggers automatically use the new factory.
LoggerAdapter for Contextual Logging
A lightweight way to attach contextual data to log messages without changing existing logging calls is using the LoggerAdapter function. It wraps a standard logger and merges a context dictionary into each emitted record, which makes contextual logging both explicit and reusable.
This pattern is commonly used for per-request, per-user, or per-task metadata. For example, request IDs, user IDs, or session identifiers can be injected once and automatically included in all related log messages.
Writing Custom Handlers
Building a custom handler class involves subclassing logging.Handler and implementing a custom emit() method to direct log records to nonstandard destinations such as APIs, queues, or third-party tools. Overriding this method provides developers with full fine-grained control over how log records are serialized, buffered, retried, or dropped, which makes for a more personalized experience.
Integrating Logging With Tooling and Observability
Production environments rely on external observability platforms that aggregate, index, visualize, and alert on logs. This is why integration is such a critical part of any logging strategy.
End-to-end logging pipelines typically move records from application-level handlers into external collectors, through processing and enrichment stages, and finally into indexed storage systems.
ELK Stack Integration
As a whole, the ELK (Elasticsearch, Kibana, and Logstash) stack provides an out-of-the-box set of tools to have a full overview of your logging pipeline.
Logstash serves as the primary ingestion and transformation layer. Python applications emit logs (often in structured JSON) via file, socket, or HTTP handlers, and Logstash receives these records, parses fields, enriches metadata, and normalizes formats before forwarding them downstream.
The indexing and storage layer is provided by Elasticsearch, which is designed for distributed search across large amounts of log data. Structured fields such as timestamps and request IDs provide speedy querying and aggregation.
Kibana sits on top of Elasticsearch with dashboards and visualizations that surface trends, error rates, and operational signals. Developer teams are therefore free to move from individual log lines to system-level insight and incident analysis.
Datadog, Loki, and Better Stack
Datadog, Grafana Loki, and Better Stack collect logs by relying on agent-based collectors. Agents such as the Datadog Agent or Promtail for Loki tail local log files or receive network-streamed events and forward them to managed back ends.
The indexing and querying of logs on these platforms vary. Unified tagging and correlation between logs, metrics, and traces are key features of Datadog. Label-based indexing (which means faster search) is the main focus of Loki, and Better Stack offers pipelines targeted at smaller teams or quick-moving projects.
Error Monitoring Tools (Sentry, Raygun, and Airbrake)
Tools for error monitoring occupy a similar but different space. Error monitoring platforms capture exceptions in detail, including stack traces and contextual metadata prior to a failure, whereas standard logging records events.
When integrating Python logging with monitoring tools like Sentry, Raygun, or Airbrake, SDKs or custom logging handlers that forward high-severity log records and uncaught exceptions tend to be required. This setup supports deep diagnostic analysis, real-time alerting, and error grouping, which complement a traditional log aggregation system.
Performance, Scaling, and Security
At scale, logging stops being a passive diagnostic tool and becomes an active part of system behavior. When a logging pipeline is poorly designed, it shows up as latency spikes and overall operational drag. Well-designed pipelines, on the other hand, tend to fade into the background and work behind the scenes.
Log Volume Management
Instead of causing systems to fail instantly, unbounded logging causes them to deteriorate over time. Oversights that can subtly increase log volume include repeated error loops and debug-level verbosity left enabled. Generally speaking, controlling output consists of being conscious of what is released by default and letting verbosity fluctuate as needed.
In my experience, the most common problem with logging in production is managing the sheer amount of data. If you log too much information, it can quickly fill up the hard drive. To prevent this, it’s essential to rotate log files and back them up to another system using a separate process or service.
System hygiene is also important. This is where retention and rotation storage concerns come into play. Keeping logs longer than they are useful increases both cost and risk, and aggressive pruning may end up removing important context when incidents happen. The balance depends on the application and usually changes as traffic increases.
High-volume systems benefit from batching, sampling, and dynamic log-level adjustments to prevent excessive output. Too much output can overwhelm storage and indexing systems. Additionally, well-established retention policies can warrant that logs are handled (which normally means archived, rotated, or deleted) according to operational, legal, or compliance requirements.
I/O Costs and Buffering
Logging always competes with the application for I/O. When writes happen synchronously, this contention becomes noticeable. Buffering or offloading can hide it, smoothing the spikes in log activity. Most production systems rely on queues, background threads, or external agents to handle this work outside the main execution path.
The compromise is delayed delivery and, in extreme cases, potential loss during a crash. Deciding where buffering happens (and how much loss is acceptable to your team) is a design choice rather than a purely technical one.
Async and Structured Logging (Python 3.11+)
Because blocking behavior is instantly apparent, async applications reveal logging problems more quickly. Event loops remain responsive when records are emitted into a queue and serialization and I/O are left to another thread or process.
When concurrency is surging, structured output gains value. Structured logging outputs (such as JSON, key-value pairs, and context-enriched records) make correlation and filtering predictable, while flat text logs are readable but brittle. With improved context propagation in newer Python versions, request- or task-level metadata can follow execution paths without being passed explicitly through every call.
Secure Logging (PII Masking, Audit Trails, and Compliance)
Security concerns tend to appear after logs already exist. Sensitive data, including personally identifiable information (PII), can appear unexpectedly in exception messages, debug output, or other fields, so preventing exposure usually means filtering or redacting fields before they are written. Trying to clean logs afterward is more complicated and error-prone.
Audit logs are a different class of data. They are meant to record privileged access events, configuration changes, and system-level actions. At the same time, they are in charge of keeping sensitive data safe and away from plaintext.
From a compliance perspective, sensitive fields must be masked, encrypted, or omitted entirely to meet regulatory requirements such as General Data Protection Regulation (GDPR), Service Organization Control 2 (SOC2), and similar standards. This applies not only to application-level data but also to metadata that may indirectly identify users or systems and is also easy to overlook.
Audit logging, in particular, must guarantee that sensitive values never appear in plaintext. While these logs focus on accountability and traceability (who changed what, and when) they should remain tightly controlled and isolated from general diagnostic output to avoid accidental disclosure.
Testing and Debugging Logging Configurations
Because logging is largely configuration-driven and produces side effects, testing logging configurations is about verifying its observable behavior rather than the internal implementation. Small changes can silently alter crucial steps along the pipeline.
Unit Testing Logging Output
Unit tests can validate that single log messages are emitted at the correct severity and under the right conditions. Tests typically capture log records in memory and inspect their attributes rather than asserting on files or external systems, as it would normally be the case in application testing.
Capturing Logs in Pytest
In pytest-based testing suites, tools such as caplog intercept log records during test execution. Tests can then check:
- Which messages were emitted.
- The severity level of each message.
- How logger names appear in the hierarchy.
- The content of any custom fields added by adapters, filters, or record factories.
This method verifies logging intent without relying on external handlers or I/O.
Validating Configuration
Beyond message content, tests can also validate logging configuration itself. This includes confirming that, for example, required handlers are attached to the correct loggers. Configuration validation tests can help catch problems that often only surface at the worst time if left unchecked, such as under load.
Designing Efficient Python Logging
In Python logging, structure matters, and architectural choices shape whether the pipeline supports development or becomes a liability. A deep understanding of Python’s logging ecosystem can foster these efforts and help you build a logging system that supports day-to-day development instead of slowing it down.
As systems evolve and grow, a well-oiled logging pipeline stops being solely a debugging aid and becomes an integral part of the infrastructure: an information network that is paramount to keep predictable under load, composable, and compatible with external tooling.
Python logging handlers differ by destination and behavior: some handlers write to consoles or persist logs to disk. Others manage file growth or rollover, forward events remotely, or enable nonblocking processing across threads or processes. Choosing the right mix guarantees a logging strategy that enriches and supports your project from beginning to end.
Recapping Python Logging Best Practices
Thoughtful design of Python logging pipelines transforms logging from a simple debugging tool into an integral part of your application’s infrastructure. Some best practices to keep in mind for logging include:
- Configure logging centrally through hierarchical loggers.
- Avoid direct calls to the root logger.
- Persist logs and enrich them with metadata for clearer diagnostics.
- Use structured formatting, rotation, and centralized configuration to build logging pipelines.
Further Reading on the Toptal Blog:
Understanding the basics
Organize loggers in a hierarchical structure with centralized settings. Assign multiple handlers with defined levels and formats, and use propagation to maintain consistent logging across modules, including imported libraries, while allowing debug messages to be enabled selectively during development.
Stream handlers write to consoles. File handlers persist logs locally. Rotating handlers manage log growth. Network handlers forward logs to centralized logging services. And queue handlers support nonblocking, multithreaded pipelines. Stream handlers can also act as fallback logging when external systems are unavailable.
Combine structured logging, custom formatters, and JSON output to include essential metadata and context. Use LoggerAdapters or custom LogRecord factories to create enriched logs suitable for tracing and monitoring across distributed applications, while being mindful of backwards compatibility issues as log formats evolve.
Attach handlers primarily to top-level loggers, control propagation, and set logger levels thoughtfully to ensure logs aren’t repeated or accidentally ignored.
Mask, encrypt, or omit PII to comply with GDPR/SOC2. Treat audit logs separately to record privileged access and system changes without exposing sensitive information in plaintext.
Le Mérévillois, France
Member since February 23, 2021
About the author
Camille is a senior software developer who builds robust desktop and real-time systems for global clients including e-on software, Hitachi, and Alstom. Specializing in Python, C, and C++, he has delivered solutions for railway systems, power infrastructure, video and imaging, 3D software, and web platforms.
Previous Role
Senior Software DeveloperPREVIOUSLY AT