USDCHF Bullish continuation price pattern developing The USDCHF currency pair continues to display a bullish outlook, in line with the prevailing trend. Recent price action suggests a corrective pullback, potentially setting up for another move higher if support holds.
Key Level: 0.7700
This zone, previously a consolidation area, now acts as a signif

The best trades require research, then commitment.
Get started for free$0 forever, no credit card needed

Scott "Kidd" PoteetPolaris Dawn astronaut

Where the world does markets
Join 100 million traders and investors taking the future into their own hands.

#DOGE/USDT - Only One Scenario Left: UP
#DOGE
The price is moving within a descending channel on the hourly timeframe. It has reached the lower boundary and is heading for a bounce. A retest of this boundary is expected.
The Relative Strength Index (RSI) indicates a downward trend, and this trend is likely to continue due to the overb

IBIT Gaps As a Leading Price Predictor For BitcoinIn this study I cover something that I discovered over a year ago comparing the 4-Hour I bit charts and a noticing frequent gaps in the price action, which ultimately filled Almost 100% of the time.
Similar to the CME Gap where there is likely unrealized losses on the books at the CME these gaps ac

NQ Testing 200MA With Bullish DivergenceNasdaq futures are currently testing the 200-day moving average, a key long-term support level that the price has recently attempted to break below.
At the same time, both RSI and Momentum are showing bullish divergence — price made a lower low while indicators formed higher lows, suggesting that d

EURJPY H4 | Bearish Reaction Off Pullback ResistanceMomentum: Bearish
Price is currently below the ichimoku cloud.
Sell entry: 183.800
- Pullback resistance
- 61.8% Fib retracement
Stop Loss: 183.553
- Swing high resistance
Take Profit: 182.471
- Swing low support
High Risk Investment Warning
Stratos Markets Limited (fxcm.com/uk), Stratos Europe

AAVE to $700 - The Cup is Full, the Handle is Ready - March 2026AAVE fell 85% from its all-time high and the crowd declared DeFi dead. They moved on. They always do. Meanwhile, a textbook cup and handle pattern has been quietly forming for over four years. Four years.
On the above 4-day chart AAVE has completed a classic cup and handle formation spanning from t

Oil Kicks Off New Week Whipsawing to $120 and Back. Now What?If oil TVC:USOIL were a stock, traders would be calling it a meme trade this week.
Parabolic moves, all-caps presidential commentary, and a global supply chain disruption gave crude quite the opening on Monday.
West Texas Intermediate kicked off trading up 30% at $120 a barrel , and Brent wasn

XAUUSD Holding Trend Support - Bullish Continuation PossibleHello traders! Here’s my technical outlook based on the current XAUUSD (2H) chart structure. Price previously developed a steady bullish move after rebounding from a lower support region, gradually forming higher highs and higher lows while respecting a well-defined ascending trend line. This upward

BTCUSDT | Bear Market Playbook: Dead Cat Bounce #2Bitcoin continues to respect the bearish market structure on the higher timeframes.
For the 6th time in a row, every time the Volume Delta flips green, price still goes on to print another lower low on the 1D timeframe. This is a clear sign that buying pressure is being absorbed.
What many traders

Everything is Just Beginning: Why the War-Driven Rally is a Trap
Hey everyone,
The war in the Middle East, which I have been warning about throughout 2025, has begun. But to the surprise of many, the markets did not collapse. On the contrary, we saw a rally in cryptocurrency and gold, while indices only corrected slightly.
Just 5 min read it I warned you long
See all editors' picks ideas
Stop Loss Cascades (Breakouts) [Kioseff Trading]Hello friends and traders!
🔹Introduction
This indicator " Stop-Loss Clustering (Breakouts) " attempts to model trader stop-loss placement logic and identify price areas where a large amount of stop losses might cluster.
The idea is, if stop losses are indeed highly concentrated in a specific are
Pine Script® indicator

Swing Profile [BigBeluga]🔵 OVERVIEW
Swing Profile is a dynamic swing-based volume profiling tool that builds a complete volume profile for each completed market swing.
Instead of using fixed sessions or time ranges, the indicator anchors its profile strictly between confirmed swing highs and swing lows, allowing tra
Pine Script® indicator

[MAD] Gann o MaticusGannomat — Full Automated Gann Grids & Astro Cycles
Automatic Gann quadrant boxes with geometric arc projections. Cycle boundaries from standard timeframes or real planetary astronomy.
Thanks BarefootJoey, master of Astrolib
What Does This Indicator Do?
Gannomat draws a Gann quadrant box
Pine Script® indicator

Breakout Volume Delta | Flux ChartsGENERAL OVERVIEW:
Breakout Volume Delta is an indicator that measures breakout strength using lower-timeframe volume delta. It estimates buyer vs. seller participation within the breakout candle by summing bullish and bearish sub-candle volumes, then visualizes that dominance by splitting the candl
Pine Script® indicator

HTF Floating Candles w/ Volume Footprint [theUltimator5]This indicator is designed to pull higher-timeframe candles outside of the chart, and add the footprint volume data to give a complete snapshot of the Higher Timeframe (HTF) trading range and volume data without cluttering your view.
IMPORTANT!
This uses the new request.footprint() call, which ma
Pine Script® indicator

Earnings Snapshot [Trendoscope]🎲 Overview
The Earnings Snapshot is a custom indicator designed to provide traders and investors with a quick, visual overview of a stock's earnings performance and its impact on price action. This tool automates the analysis of earnings reports by fetching historical and future earnings data,
Pine Script® indicator

Market Structure Dashboard | Flux ChartsGENERAL OVERVIEW
Market Structure Dashboard is a multi-timeframe market structure analysis indicator. It combines EMA trend detection, swing high/low tracking, market structure labels, Order Block detection, Fair Value Gap detection, liquidity sweep detection, volume analysis, volatility analysis,
Pine Script® indicator

Smart NR2-NR20 and Inside Bar (Zeiierman)█ Overview
Smart NR2–NR20 + Inside Bar (Zeiierman) is a compression + breakout scanner that searches for the tightest Narrow Range (NR) condition across NR2…NR20, plus optional Inside Bar detection. When a valid compression forms, it draws a box around the setup, projects the high/low levels for
Pine Script® indicator

TASC 2026.03 One Percent A Week█ OVERVIEW
This script implements "A High-Probability Weekly Trading Strategy For TQQQ" as dictated in the March 2026 edition of the TASC Traders' Tips , "Trading Snapbacks In A Leveraged ETF”. In this article the author creates a mean reversion strategy intended for systematic and discretionary
Pine Script® strategy

Smart Trader, Concentric Candles & Aristotelian Cycloids
Smart Trader, Episode 05
Concentric Candles & Aristotelian Cycloids
by Ata Sabanci
The Spark — How a 2,000-Year-Old Paradox Found the Charts
━━━━━━━━━━━━━━━━━━━━━━━━━━━━━━━━━━━━━━
It started with a film about Aristotle's Wheel
Paradox — a problem that puzzled mathematicians
for two mille
Pine Script® indicator

See all indicators and strategies
Community trends
COINBASE continues to copy the exact 2022 blueprint. $55 is nextA little more than 3 months ago (December 04 2025, see chart below) we gave a strong Sell Signal on Coinbase (COIN), targeting $150:
The Target got hit following exactly the pattern we outlined and a month ago (see chart below) we set a new condition for a Sell, which was a rebound on the 2-ye

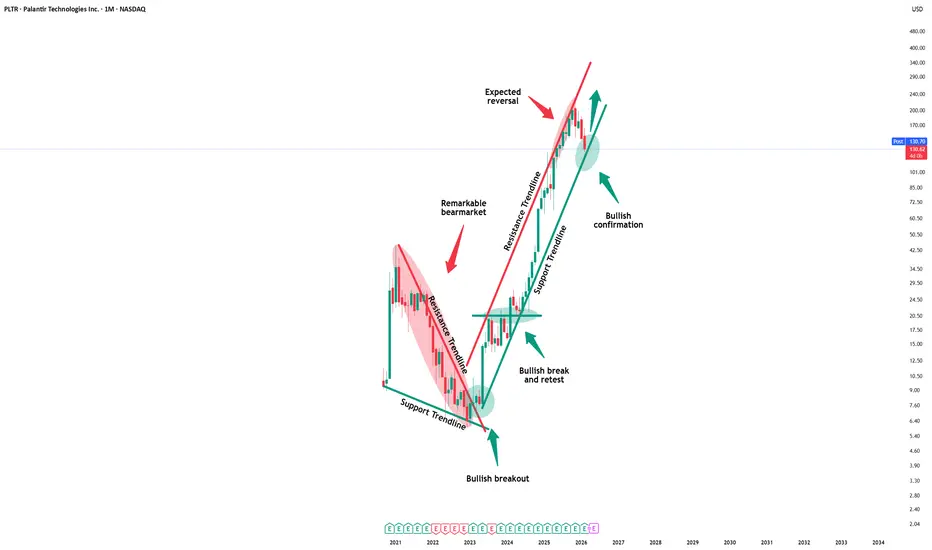
Palantir - Starting the bullish reversal soon!🚀Palantir ( NASDAQ:PLTR ) could reverse right here:
🔎Analysis summary:
Over the course of the past couple of years, Palantir has been rallying about +3,000%. And despite the recent correction of -40%, the trend remains clearly bullish. With the current retest of major support, Palantir is abo
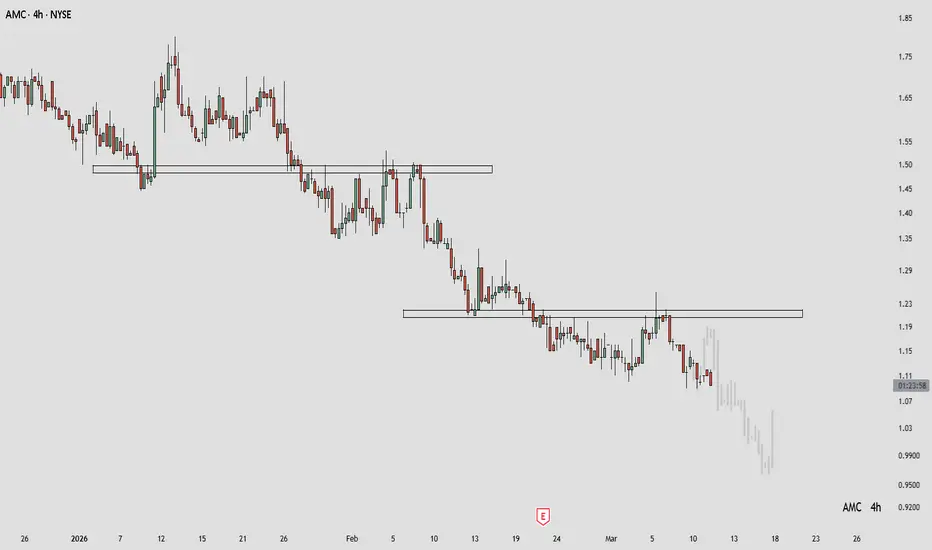
AMC - OUTLOOKPrice got rejected from the supply zone again. The reaction shows strong selling pressure at this level, similar pattern was seen previously, suggesting further downside.
BIAS:
Bearish while price remains below the supply zone.
SUMMARY:
• Strong rejection from supply zone.
• Historical pattern hin
Mean Reversion Setup: V1. RSI in oversold region
2. Price likely to rebound back to the mean
Trade Rules:
Entry Trigger - RSI has cross below oversold region
Exit Trigger - Close price cross above exit trigger (Red Line)

Long Idea on $META [Swing Trade]NASDAQ:META looks good for a long swing trade if it can go above 660.00 and stay.
Swing Trade Plan:
Long Entry - 660.00
Target 1 - 665.00
Target 2 - 670.00
Stop Loss - 656.00

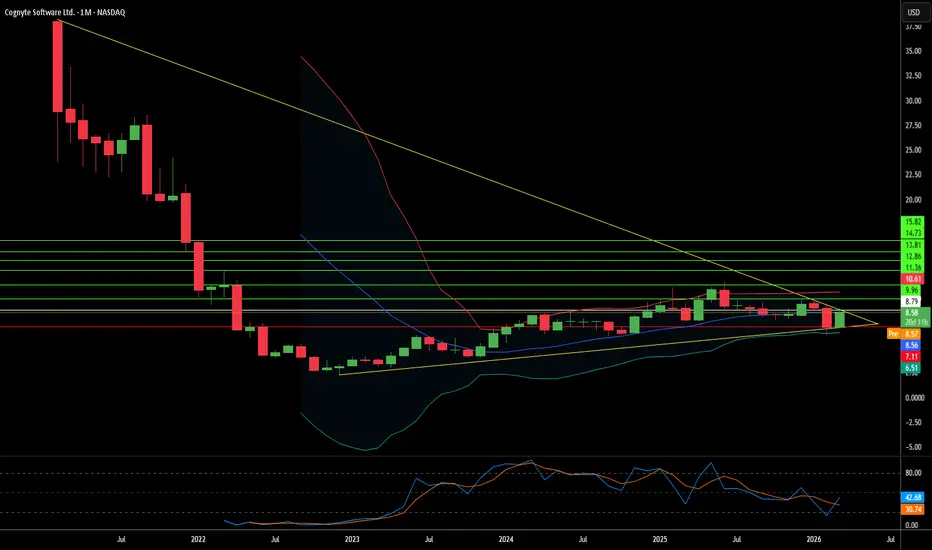
Can a Shadow Intelligence Firm Win the AI Arms Race?Cognyte Software (NASDAQ: CGNT) is emerging from the shadows of a post-spin-off identity crisis and into the center of one of the most consequential technological shifts of our era: AI-powered investigative analytics for national security. Operating in over 100 countries and serving law enforcement,
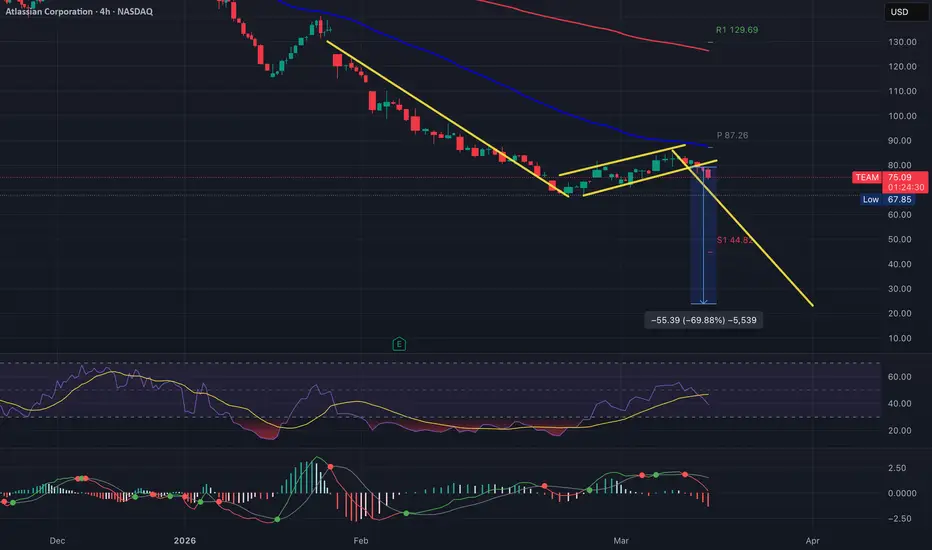
TEAM Bear Flag Breakdown — 65% Downside Potential```
#TEAM #short #active_management #investment_idea #stocks
One of the trades we opened today in the premium channel, which can still be considered following our position.
✅ Atlassian Corporation #TEAM — an American technology company that develops corporate software for project management and te
Strategy (MSTR) – From $457 Crash to $140 Rebound: Bottom In?NASDAQ:MSTR trades at ~$140.71 (down -0.24% intraday on 1H chart), stabilizing near multi-month lows after a brutal 2025–2026 correction. The stock collapsed from highs near $457 in mid-2025 to a bottom around $104 in early 2026, closely tracking Bitcoin's own drawdown during the "mini crypto winte

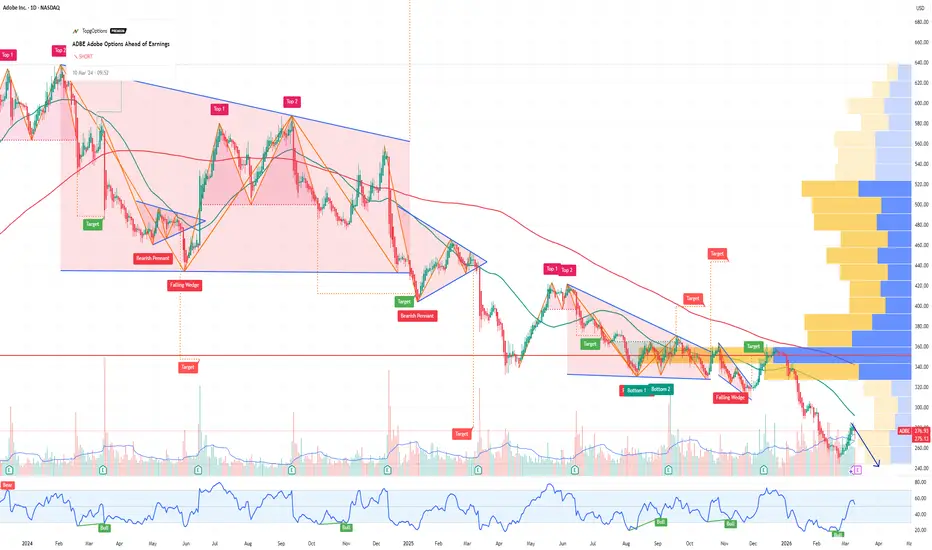
ADBE Adobe Options Ahead of EarningsIf you haven`t sold the double top on ADBE:
Now analyzing the options chain and the chart patterns of ADBE Adobe prior to the earnings report this week,
I would consider purchasing the 240usd strike price Puts with
an expiration date of 2026-8-21,
for a premium of approximately $15.50.
If these op
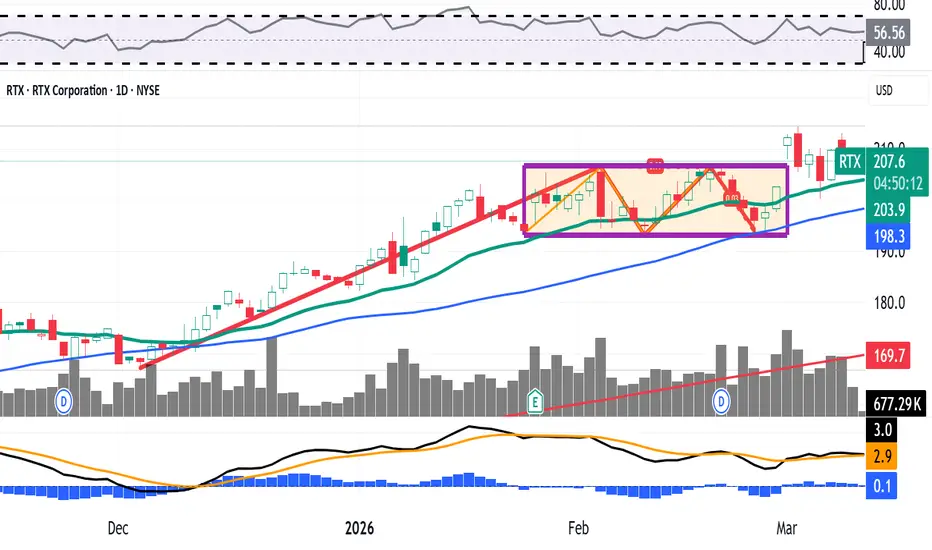
What Raytheon Parent RTX's Chart Shows Amid the U.S.-Iran WarWith missiles flying in the U.S.-Israel-Iran war, Raytheon parent RTX NYSE:RTX recently hit an all-time high as one of the primary contractors to design and manufacture such armaments for the American military. Let's see what the stock's chart and fundamentals show.
RTX's Fundamental Analysis
See all stocks ideas
Today
SEATVivid Seats Inc.
Actual
—
Estimate
−1.66
USD
Today
VFFVillage Farms International, Inc.
Actual
—
Estimate
0.04
USD
Today
LCUTLifetime Brands, Inc.
Actual
—
Estimate
0.31
USD
Today
DKSDick's Sporting Goods Inc
Actual
—
Estimate
3.02
USD
Today
CCLDCareCloud, Inc.
Actual
—
Estimate
0.04
USD
Today
GIIIG-III Apparel Group, LTD.
Actual
—
Estimate
0.59
USD
Today
HBIOHarvard Bioscience, Inc.
Actual
—
Estimate
0.04
USD
Today
BKTIBK Technologies Corporation
Actual
—
Estimate
0.70
USD
See more events
Community trends
BTCUSD Weekly CLS Model 2Hi friends, new range created. As always we are looking for the manipulation in to the key level around the range. Don't forget confirmation switch from manipulation phase to the distribution phase to make the setup valid. Stay patient and enter only after change in order flow. If price reaches 50%

BTCUSDT: Triangle Resistance Holds, Downside To 68K Risk RemainsHello everyone, here is my breakdown of the current BTCUSDT setup.
Market Analysis
BTC previously traded inside a downward channel, forming lower highs and lower lows. Price later broke above the channel resistance, signaling a short-term bullish shift. After the breakout, the market formed a sym

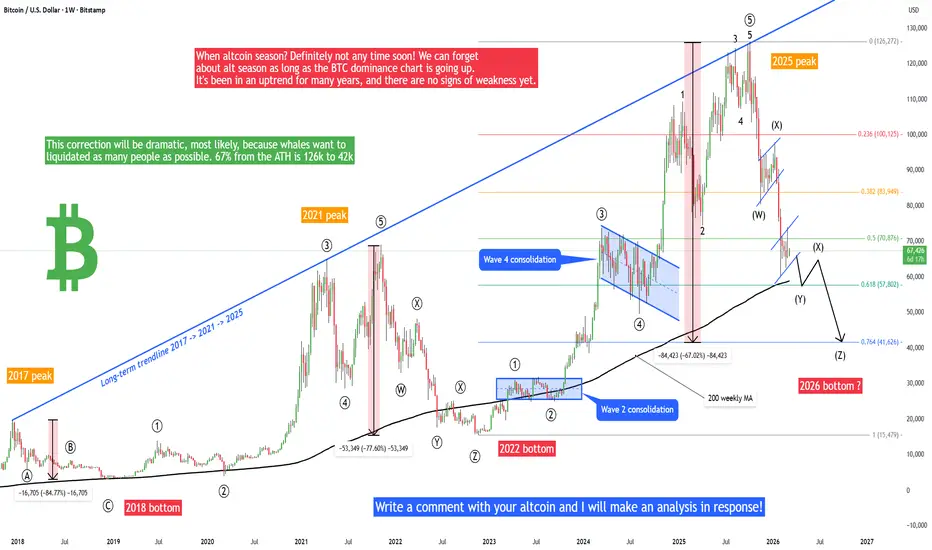
Bitcoin - Drop to 42k later this year! (Everyone liquidated)Bitcoin is looking like it wants to drop to 42k in Q3 2026! A few months ago, all moon boys thought that we were going to go to 200K or 500K, but instead we are going down! I remember these moon boys very well, because they were criticizing my ideas and spitting in the comment section on my bearish
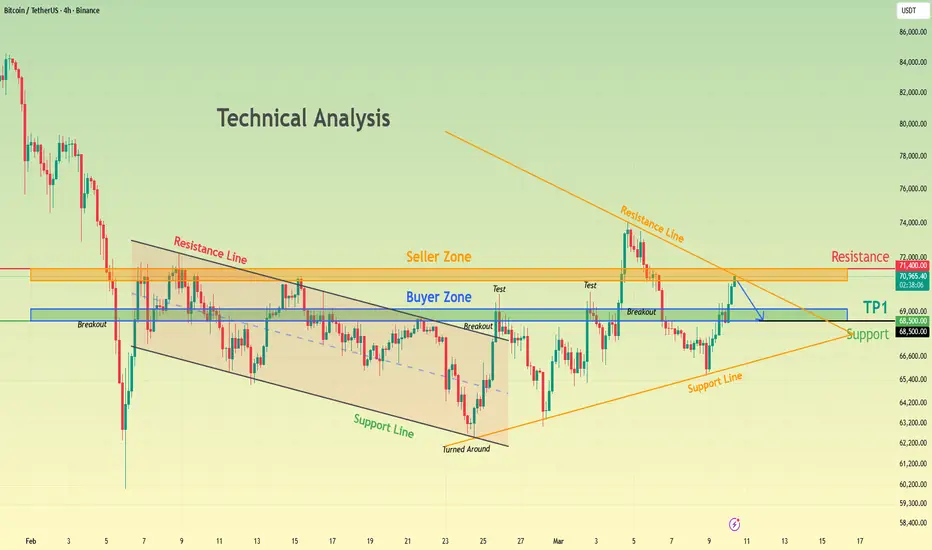
BTCUSDT Market Compression Suggests Move Toward 68,500 SupportHello traders! Here’s my technical outlook based on the current BTCUSDT (4H) chart structure. Price previously moved within a clearly defined descending channel, where sellers maintained control and the market consistently printed lower highs and lower lows. During this phase, price respected both b
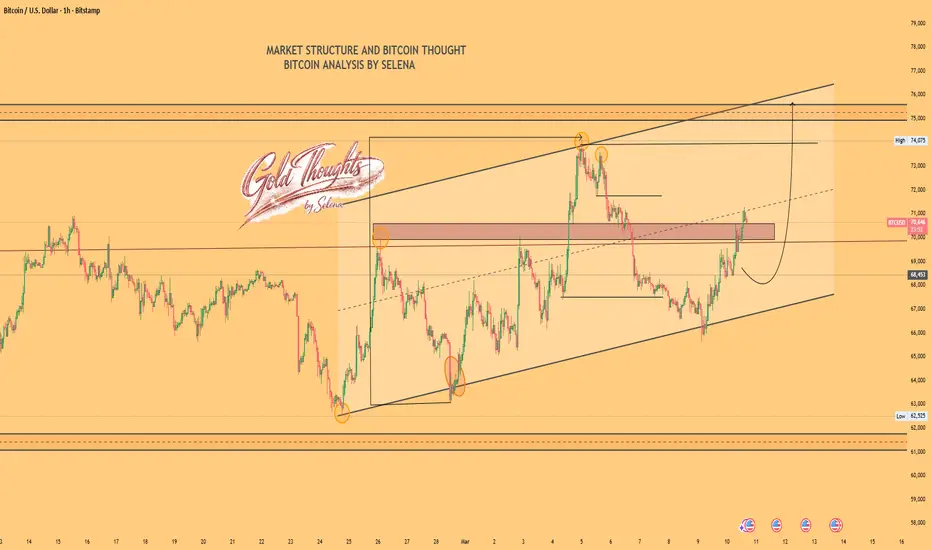
Selena | BTCUSD · 1H – Ascending Channel Liquidity SetupBITSTAMP:BTCUSD
After the deep liquidity sweep near the 63k region, buyers stepped in strongly and initiated a bullish recovery phase. Price is currently reacting around the 70k supply zone, which has previously acted as a strong reaction area. If the market successfully holds above this region an
FET is one of the bullish altcoins (8H)FET has formed a bullish structure from the point we marked as STRAT on the chart.
This structure looks like an ABC pattern or possibly a more complex pattern, currently in wave C, which is a bullish wave.
We can enter FET during pullbacks. We’ve identified two entry points for FET, and entries sh

The bulls won! We are going up! Bitcoin headed towards $100,000 It's been a long time in the making. It seems like forever but we are finally here.
Did you know? It will be the first time Bitcoin closes three consecutive days green since January. And this little development is happening to confirm a new rally. The higher high that is set to happen this week wil
Bitcoin Price Update – Clean & Clear ExplanationBitcoin shows price approaching a descending trendline resistance, while at the same time holding above a short-term ascending support line, creating a potential triangle consolidation.
Technically, the 71,500 – 72,000 zone remains a key resistance area, where sellers previously pushed the market l

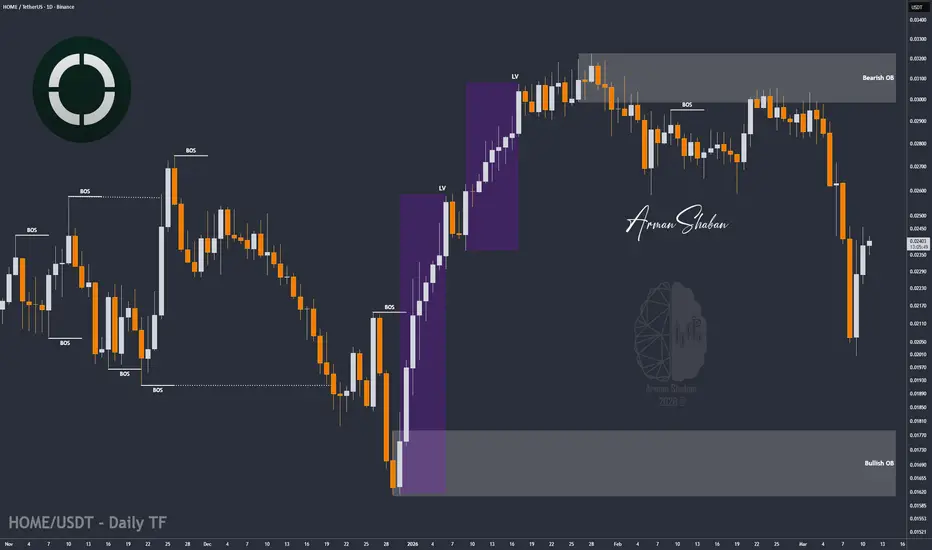
HOME/USDT | HOME Rebounds +22% From $0.02 – Recovery Starting?By analyzing the BME:HOME chart on the daily timeframe, we can see that after the broader crypto market correction, HOME also experienced a sharp decline and dropped toward the $0.020 region. However, once price reached this zone, strong buying pressure stepped in again and the market started to r
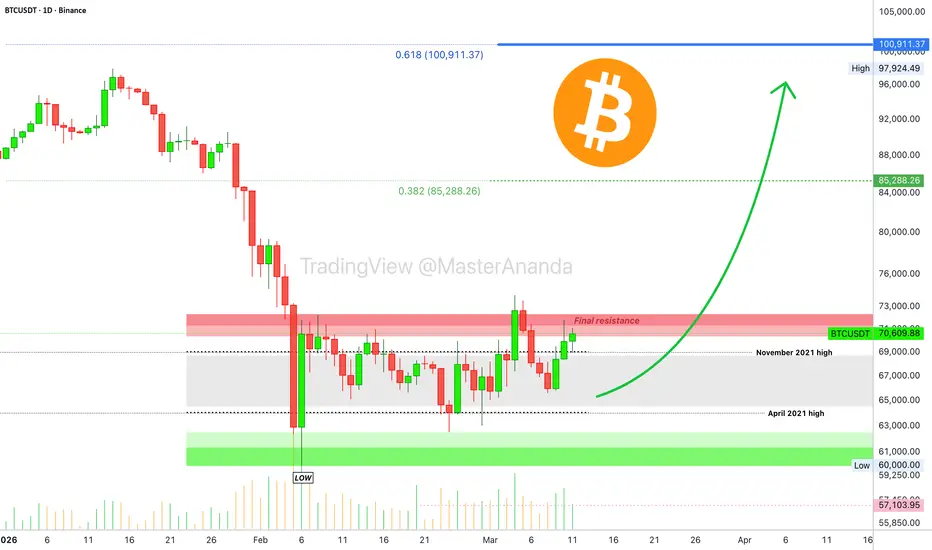
Bitcoin Price Analysis and Key LevelsUpper Resistance (97,000):
Strong resistance area, price likely to face rejection or reversal here.
Intermediate Resistance (90,268 - 89,807):
Potential resistance zones where price may struggle to move higher. Watch for a potential
reversal.
Key Support (70,743):
Critical level for price to boun

See all crypto ideas
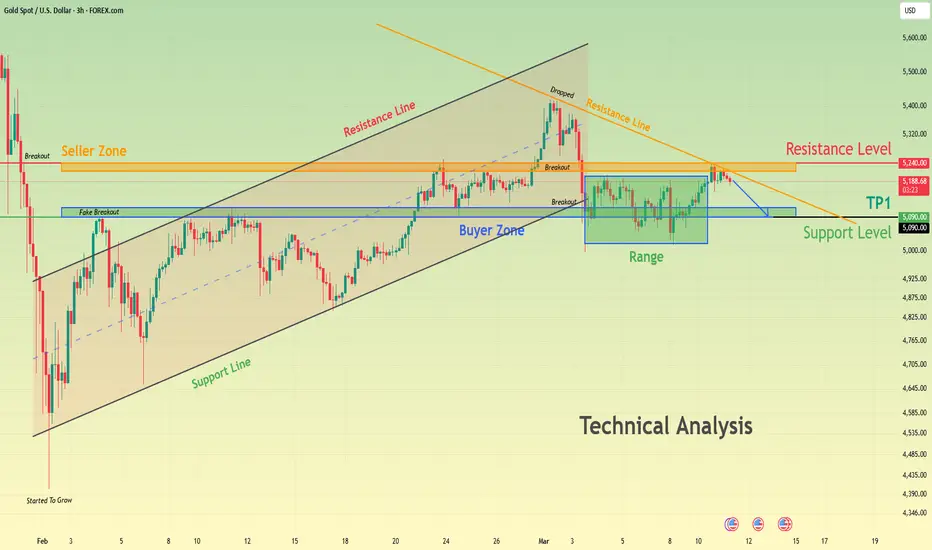
XAUUSD Rejection From 5,240 May Send Price to 5,090Hello traders! Here’s my technical outlook based on the current XAUUSD (3H) chart structure. Gold previously moved in a bullish ascending channel, forming higher highs and higher lows while respecting the rising support line. The rally eventually reached the 5,240 Seller Zone, where strong resistanc
XAGUSD – Selling pressure returns at key resistance zoneAfter a short-term recovery, XAGUSD is showing signs of weakness as it approaches the resistance zone around 88.5 – 90. The recent recovery is mostly technical, while macroeconomic factors still favor a stronger USD.
In terms of news, the market is still being influenced by positive US economic dat

XAU/USD | Gold Will Fall or More Rise Ahead ? (READ THE CAPTION)By analyzing the #Gold chart on the 1-hour timeframe, we can see that price reacted exactly as expected around the key levels discussed in the previous analysis.
Gold initially pushed higher and reached the $5150 supply zone, where we expected strong selling pressure to appear. From this level, the

XAUUSD Long: Demand at 5,140 Could Trigger Rebound to 5,250Hello traders! Here’s my technical outlook based on the current XAUUSD (1H) chart structure. Price previously traded inside a sideways range, where buyers and sellers repeatedly defended support and resistance. After several reactions inside the range, gold produced a breakout above resistance, trig

GOLD (XAU/USD): Technical Outlook & Where to Buy!Gold is currently consolidating within a narrow horizontal range on a 4-hour timeframe.
For bullish confirmation, I suggest waiting for a bullish breakout of the upper boundary of this range.
A 4-hour candle closing above 5206 would confirm a violation.
A bullish continuation would then be antici

Gold – Recovery Builds Ahead of US CPI Gold – Recovery Builds Ahead of US CPI
Gold continues to recover from the 5000 area in early Wednesday trading as oil prices ease and the US dollar softens again.
The current move is being supported by a more stable risk environment, but the market is still cautious because US CPI is now the main

GOLD - Correction to the liquidity zone before attempting growthICMARKETS:XAUUSD is forming a trading range of 5150-5230 in anticipation of US CPI data. Oil is strengthening due to geopolitical reasons, while the dollar is stagnating. Pressure is being felt...
Oil prices have temporarily halted their decline amid escalating tensions in the Strait of Hormuz

Gold (XAUUSD) – EMA + SMC Bullish StructureGold is showing a bullish market structure after multiple ChoCH (Change of Character) formations and a strong move to the upside. Price is currently approaching a key support and liquidity area, which may act as a reaction zone
If the price holds above the 5225 – 5200 support zone, the market could

XAUUSD H1: DXY Loses Momentum at 99.7 While Gold Holds Firm Above EMA Support and Prepares for a Potential Upside Extension
Gold is entering a very important phase, where the fundamental backdrop remains mixed, yet the technical structure is still holding up well. The failure of the DXY to sustain strength around 99.7, following the s

Gold Price Analysis – Key Support and Resistance LevelsThis chart provides a comprehensive technical analysis of Gold (XAU/USD), highlighting essential price levels and market behavior. The Key Resistance Level at 5,588.643 USD represents a critical price zone where the market may face significant rejection. The Minor Resistance at 5,421.398 USD is anot

See all futures ideas
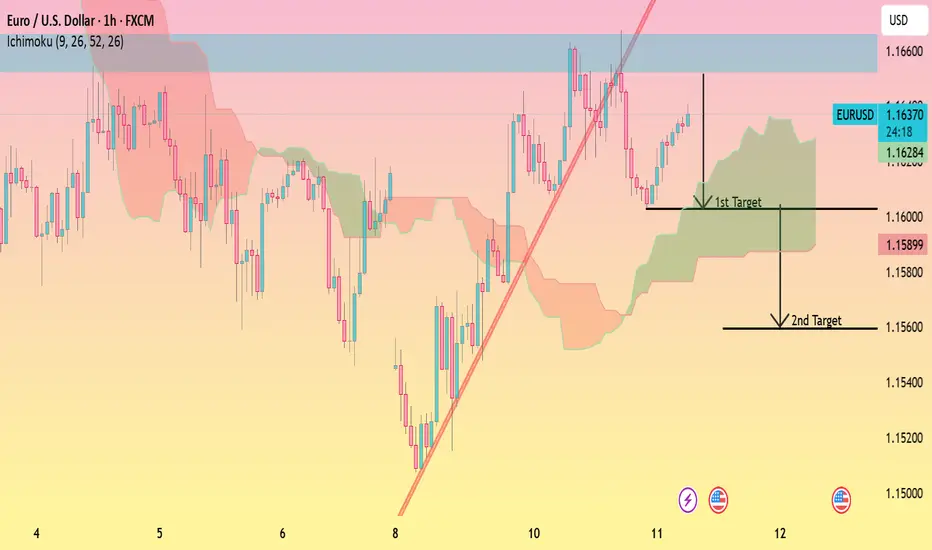
EURUSD Bearish Pullback Toward Ichimoku Support
The **EUR/USD** 1-hour chart shows price recovering after a recent drop, but the market is still trading below a key resistance zone around **1.1640 – 1.1660**. Price is currently moving near the **Ichimoku cloud edge**, which suggests a possible rejection before continuation to the downside.
The
EURUSD Long: Rebound Attempt From Key Demand ZoneHello traders! Here’s my technical outlook based on the current EURUSD (4H) chart structure. Price previously moved inside an ascending channel, forming higher highs and higher lows. After a breakout above the channel, EURUSD formed a pivot high and quickly reversed, starting a bearish correction un

GBP/USD - Wedge Breakout (11.03.2026)✅ GBPUSD recently formed a rising wedge structure , which is typically considered a bearish continuation pattern after an extended upward move. The price attempted to break higher but failed to sustain momentum near the resistance zone. FX:GBPUSD
✅ The recent wedge breakdown suggests weakening b

USDCHF Daily CLS Model 1Hi friends, new range created. As always we are looking for the manipulation in to the key level around the range. Don't forget confirmation switch from manipulation phase to the distribution phase to make the setup valid. Stay patient and enter only after change in order flow. If price reaches 50%

I Expect a Test of 1.1600 Before a Rebound Toward 1.1700Hello everyone,
Looking at the EURUSD chart on the H4 timeframe, the market still appears to be within a clear bearish structure after breaking down from the previous consolidation zone earlier this month. Following the sharp decline from the 1.1800 area, price has continued to form a sequence of

GBPUSD is Accumulating Again, But in a Very Complex WayGBPUSD is Accumulating Again, But in a Very Complex Way
This is the second time that GBPUSD has done something like this.
The overall picture is bullish, however given the USD outlook, it could change to the downside again, which is why I am explaining both scenarios, as both will come with confi

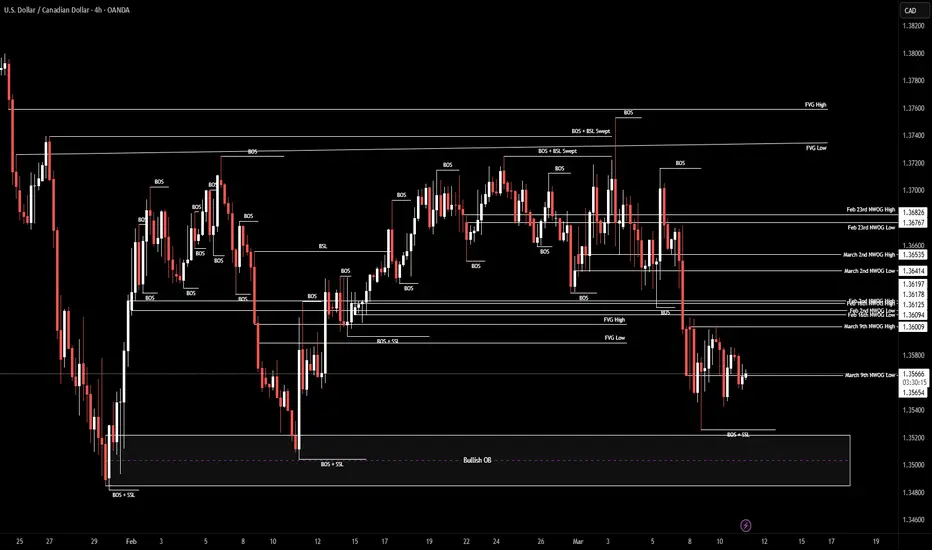
USD/CAD | Where to now? (READ THE CAPTION)As you can see, USDCAD has been in consolidation mood for a few days now, and it is struggling with March 9TH NWOG to go through it but has not been successful yet. And it is currently being traded at 1.3568, just above the NWOG low at 1.3565.
I expect USDCAD to go for the NWOG C.E. retest at 1.358
EURUSD – Bulls Defending the Wedge FloorEURUSD has been overall bullish , trading within the flat rising wedge pattern marked in blue.
Price is currently hovering around the lower bound of the wedge, which also intersects with the green support zone.
This confluence creates a key reaction area.
As long as this support cluster holds, we

NZDJPY – Short from Weekly High (counter-trend retracement)This idea is based on a potential short-term pullback after price reached the Weekly High (WH) area.
Price pushed into a strong resistance zone after an extended bullish move and showed a clear rejection wick at the highs. This suggests that liquidity above the previous highs may have been taken, w

GBPUSD 30Min Engaged ( Bullish Entry Detected )⚡Base : Hanzo Trading Alpha Algorithm
The algorithm calculates volatility displacement vs liquidity recovery, identifying where probability meets imbalance.
It trades only where precision, volume, and manipulation intersect —only logic.
✈️ Technical Reasons
/ Direction — LONG / 1.33700 Reversal Ar

See all forex ideas
Trade directly on Supercharts through our supported, fully-verified, and user-reviewed brokers.


