Track Copilot code generation metrics in a dashboard
You can now view GitHub Copilot lines of code (LoC) metrics in the code generation insights dashboard.
To get started, go to the Enterprises page, select your enterprise, and click on the Insights tab. In the left sidebar, select Code generation. NDJSON downloads with more detailed data are also available in the top-right corner of the dashboard.
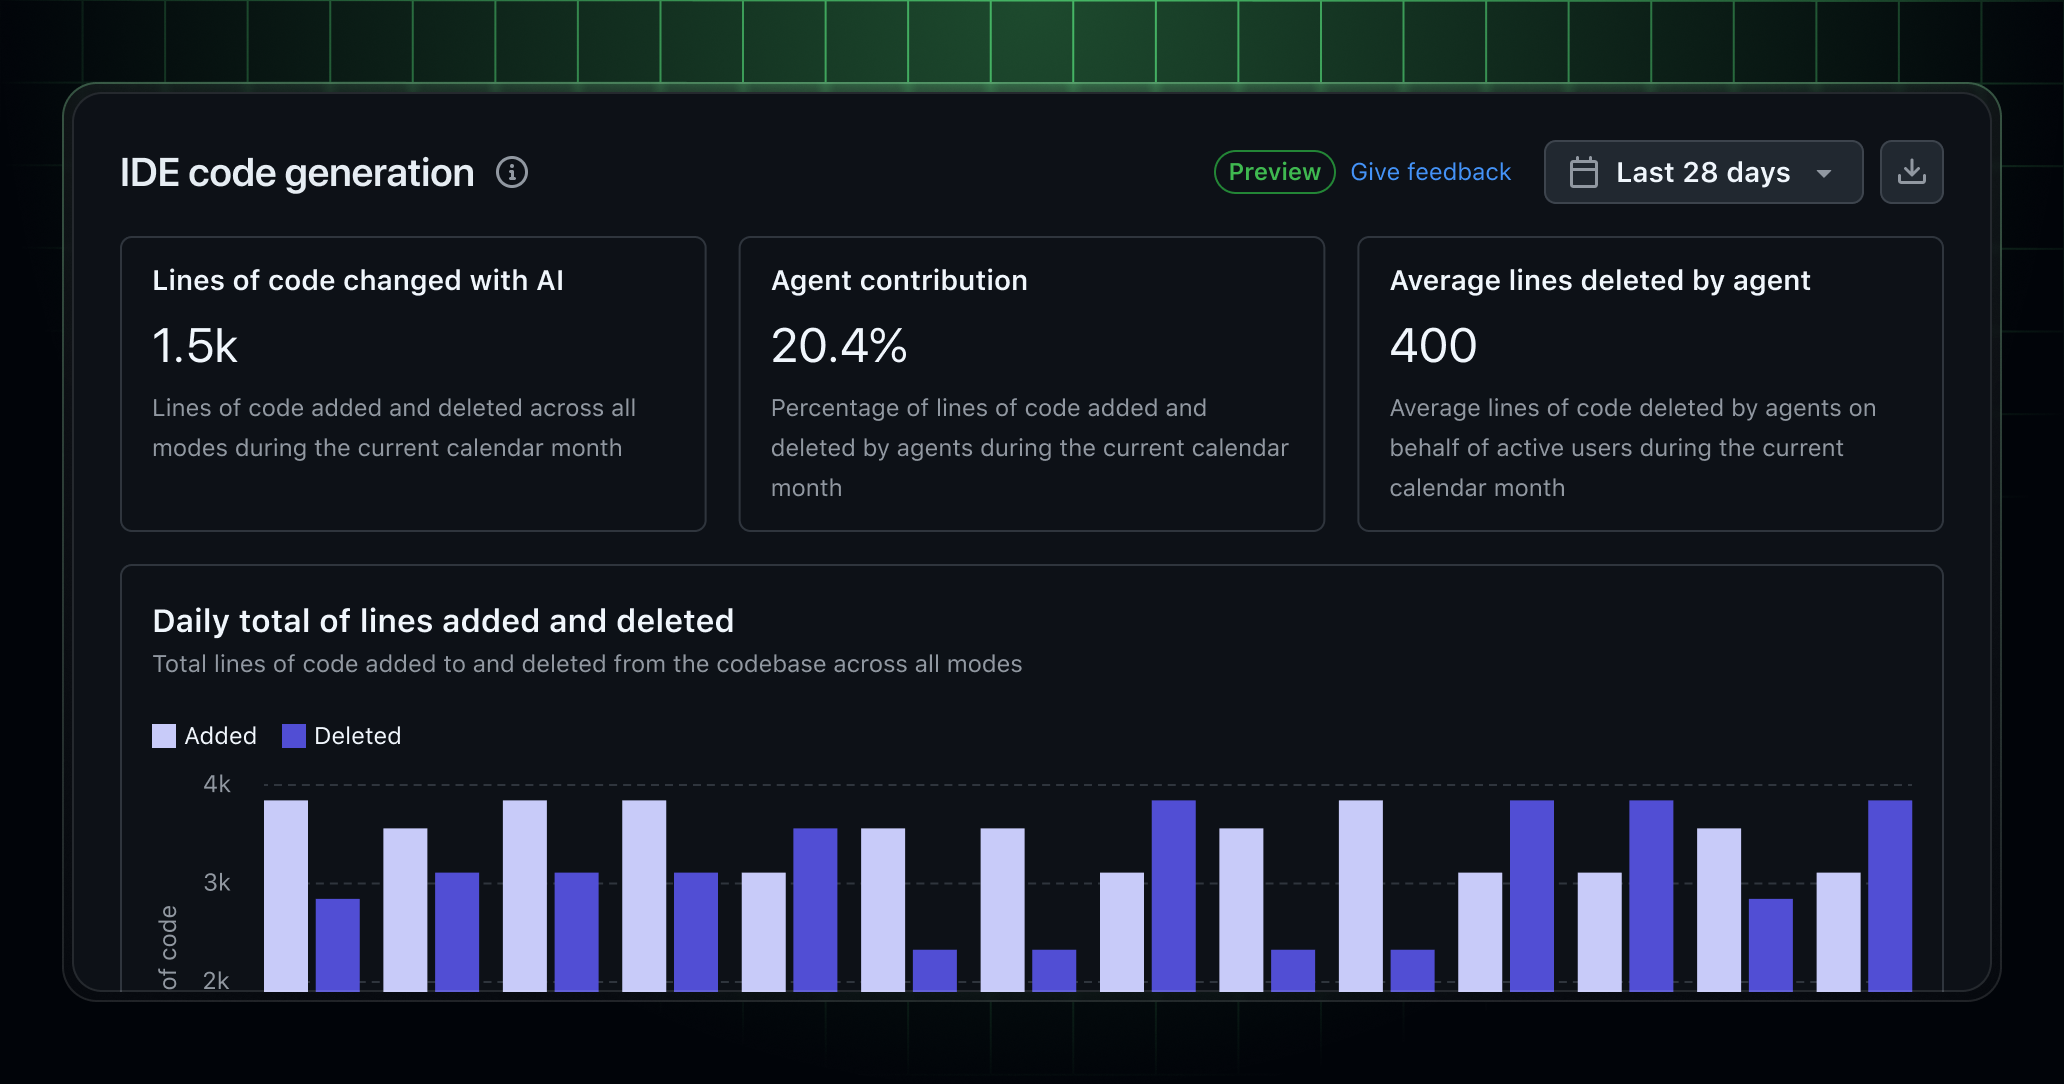
The dashboard shows aggregated code generation activity across your enterprise, including:
- Lines of code changed with AI: The total lines of code added or deleted across all modes.
- User-initiated code changes: Lines suggested or manually added through completions and chat actions.
- Agent-initiated code changes: Lines automatically added or deleted by agents across edit, agent, and custom modes.
- Activity by model and language: Both user-initiated and agent-initiated activity, grouped by model and language.
To see these metrics, the Copilot usage metrics policy must be enabled. To enable, go to the Enterprises page, select your enterprise, click on the AI Controls tab. In the left sidebar, select Copilot and scroll down to Metrics.
Enterprise owners, billing managers, and users with an enterprise custom role that has the View Enterprise Copilot Metrics permission can access the dashboard.
To learn more, see our documentation.
Disclaimer: The UI for features in public preview is subject to change.