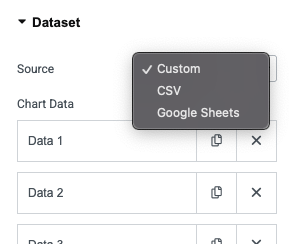
Easily create interactive charts using data from Custom input, CSV files, or Google Sheets.
Easily create charts from the data source that works best for you. Whether you want to add values manually, upload a CSV file, or connect a live Google Sheet, Dynamic Charts gives you the flexibility to pick the source that fits your workflow.
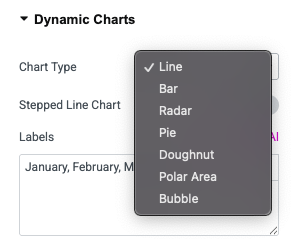
Bring your data to life with a wide variety of chart options. From classic Bar, Line, and Pie charts to Doughnut, Radar, and Polar charts — you can select the best visualization type to communicate your insights clearly.
Make your charts match your brand and style. Adjust colors, labels, legends, and tooltips to create a polished look and provide users with a smooth, interactive experience.
Visualize your data with flexibility, control, and beautiful designs.
Connect your Google Sheet once, and your chart stays in sync automatically. Any updates in your spreadsheet instantly reflect on your site — no manual edits required.
Turn CSV data into stunning charts within seconds. Just upload your file, and Dynamic Charts does the rest, saving you hours of setup.
Charts adapt beautifully to all screen sizes, load fast, and include interactive hover effects and tooltips for a seamless user experience.
Configure interactive tooltips that appear when users interact with chart elements. Tooltips are useful for showing precise data values and improving readability.
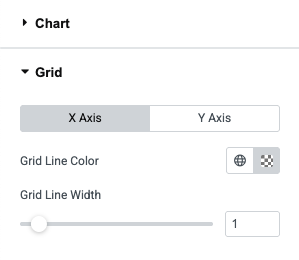
You can customize the chart grid lines, show or hide labels, titles, etc. for both X and Y axis. Controls the curve smoothness of lines.
You can select the animation easing function (e.g., easeOutQuart) to define the motion style as the chart appears. You can even set the duration and enable animation loop.