Startup Stash is one of the world's largest online directory of tools and resources for startups
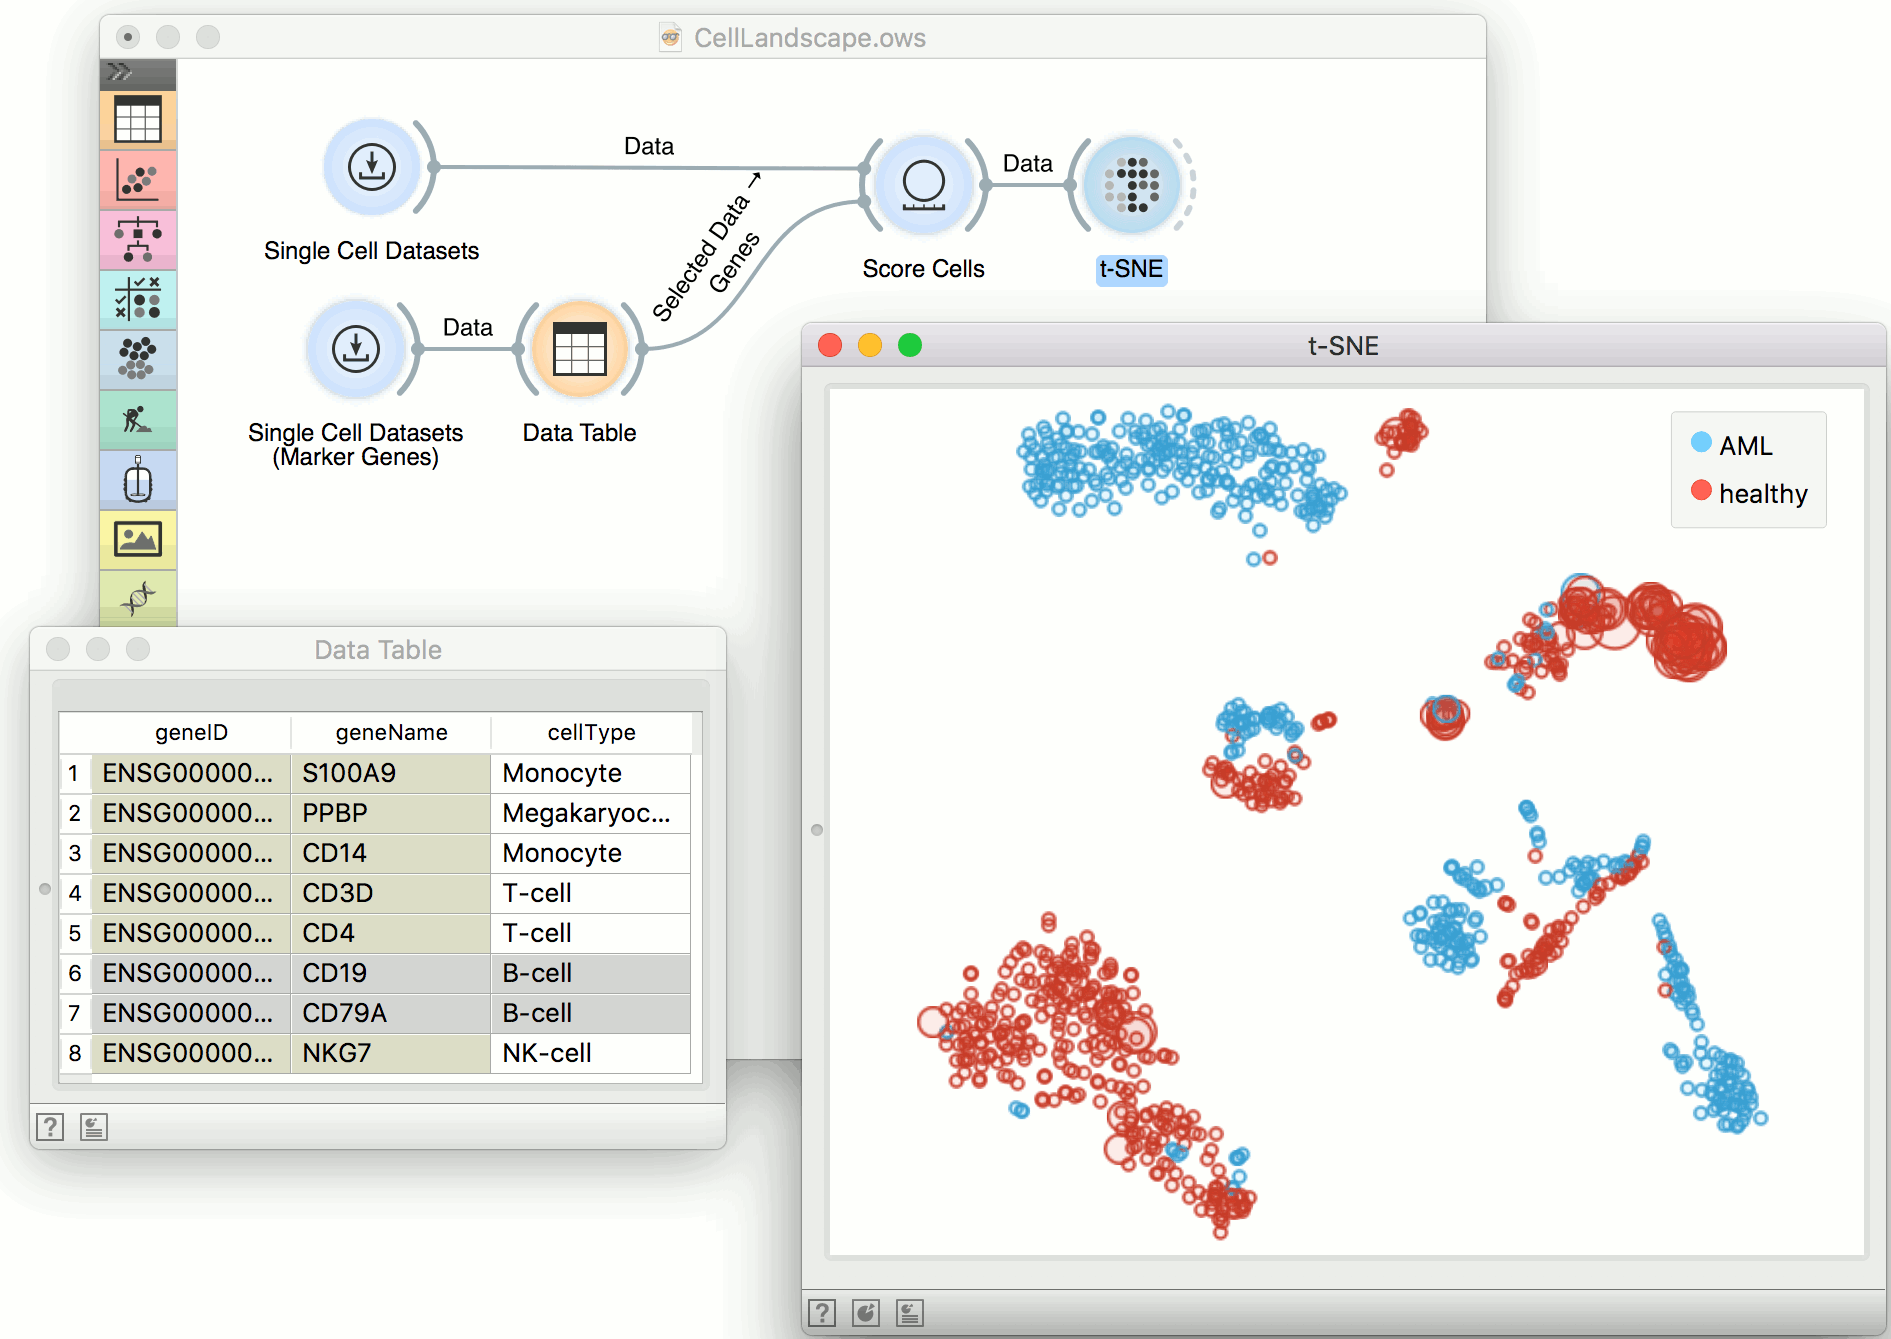
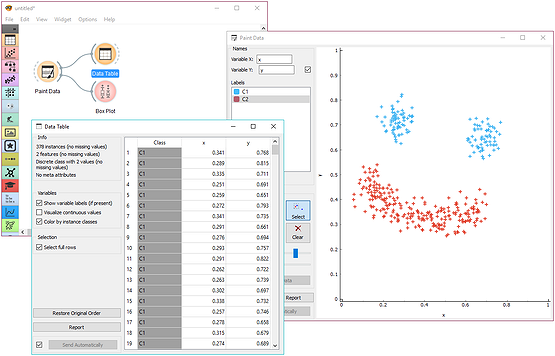
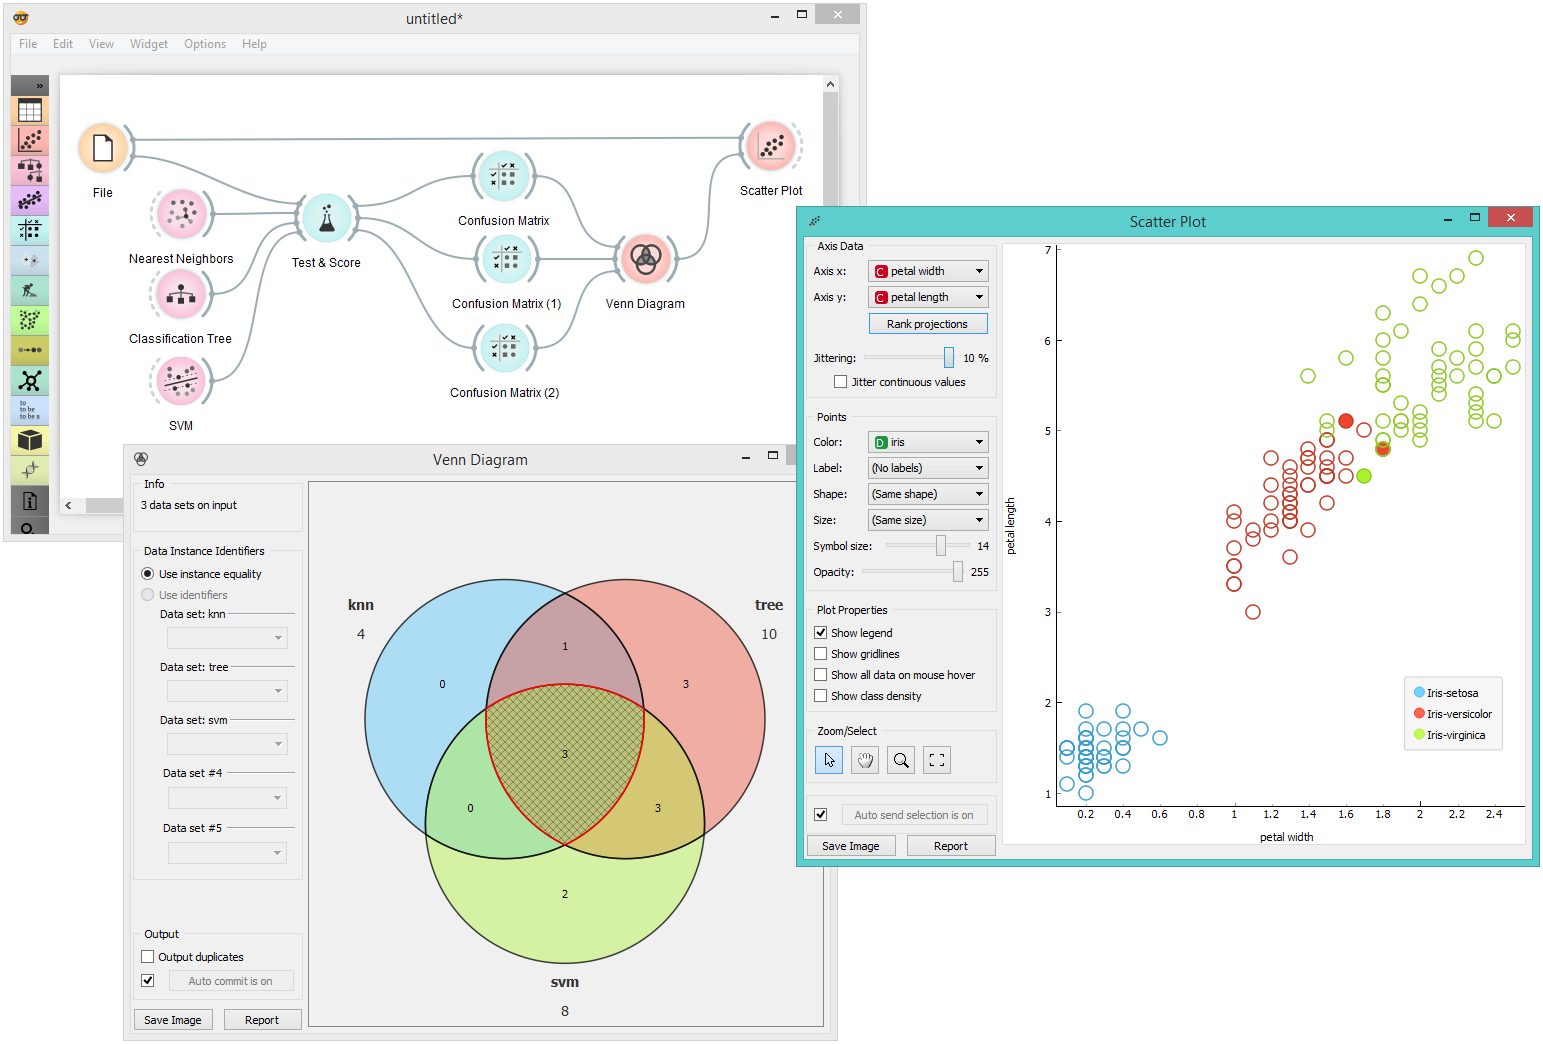
Workers can use the GUI to conduct data exploration and prototype-based qualitative analysis. In Orange, team members can use testing and training data to construct predictive analytics models. Hierarchical clustering and zoo data sets can be used by staff to infer phylogenetic relationships. Users can aggregate and alter the data using the pivot table feature, allowing them to compare financed and unfunded projects and see where the gaps lie.
 Efficient and IntuitiveIdeal for remote work and collaborationEasy to useCreate & Share Docs InstantlyManage Projects EasilyStartup DiscountsEasy File Transfer and UploadingGreat InterfaceFast Upload, Transfer and Download speedFast and EffectiveEasy sharing of end resultsScreen recording and Narration
 With its diverse landscapes and multicultural heritage, Canada is quickly becoming a key player in the global startup ecosystem. Major cities like Toronto, Vancouver, and...

Kenya has emerged as a prominent startup hub, driven by a thriving entrepreneurial ecosystem and supportive government policies. The country boasts over 300 active startups,...
Most teams discover their content is already inside an AI training set during a traffic slump or DMCA scramble, not from a friendly outreach email....
The biggest online directory of tools and resources for startups
Contact us: Hello@startupstash.com
Subscribe to our weekly newsletter to receive the best tools, resources and discounts!
Advertise on Stash
Have a story?
 Verified