The scientific figure maker for research
Publication-ready scientific figures, from a description
ExplainViz is an AI scientific figure maker that turns your research into accurate, labeled diagrams — graphical abstracts, conceptual frameworks, theoretical frameworks, and scientific posters — that you can edit and export as vector SVG. Describe your finding, and the tool drafts a structured diagram you refine and publish.
Try
Editable SVG for Illustrator · Journal-spec sizes · No watermark
Editable SVG for Illustrator
Journal-spec sizes
Accurate, reviewable labels
No watermark
Research figure workflow
A scientific figure generator for every research output
Move from a paper abstract, a set of variables, a theory, or a conference submission to a structured, publication-ready diagram. Each tool is built for a specific scientific figure type researchers need — not generic image generation.
Research
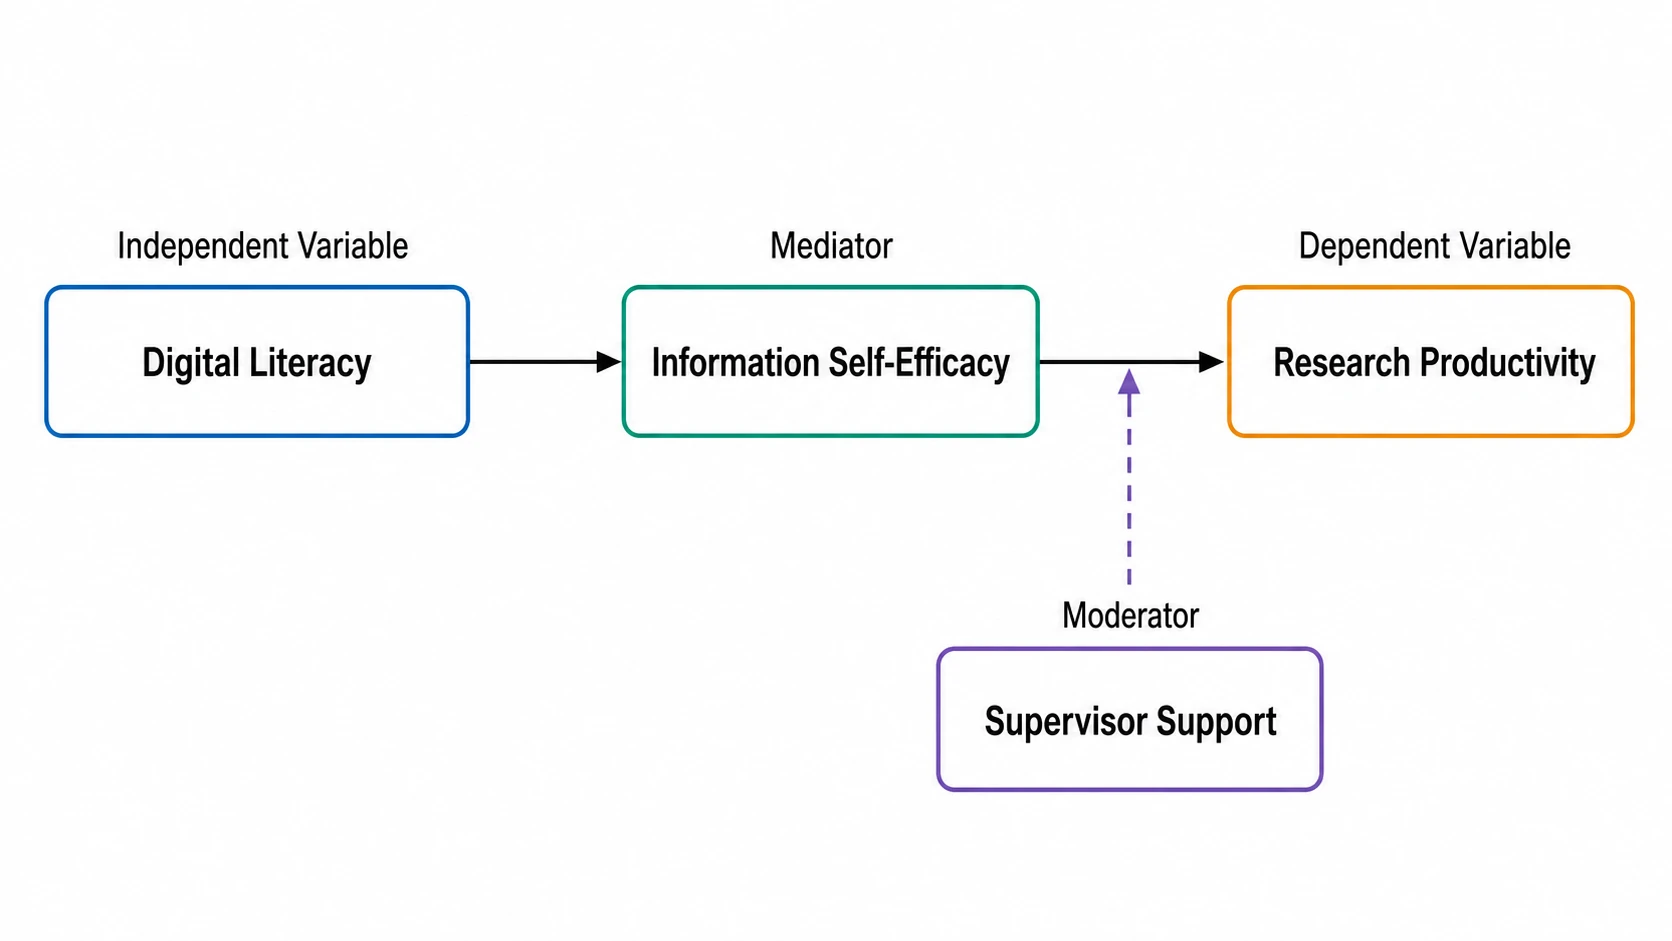
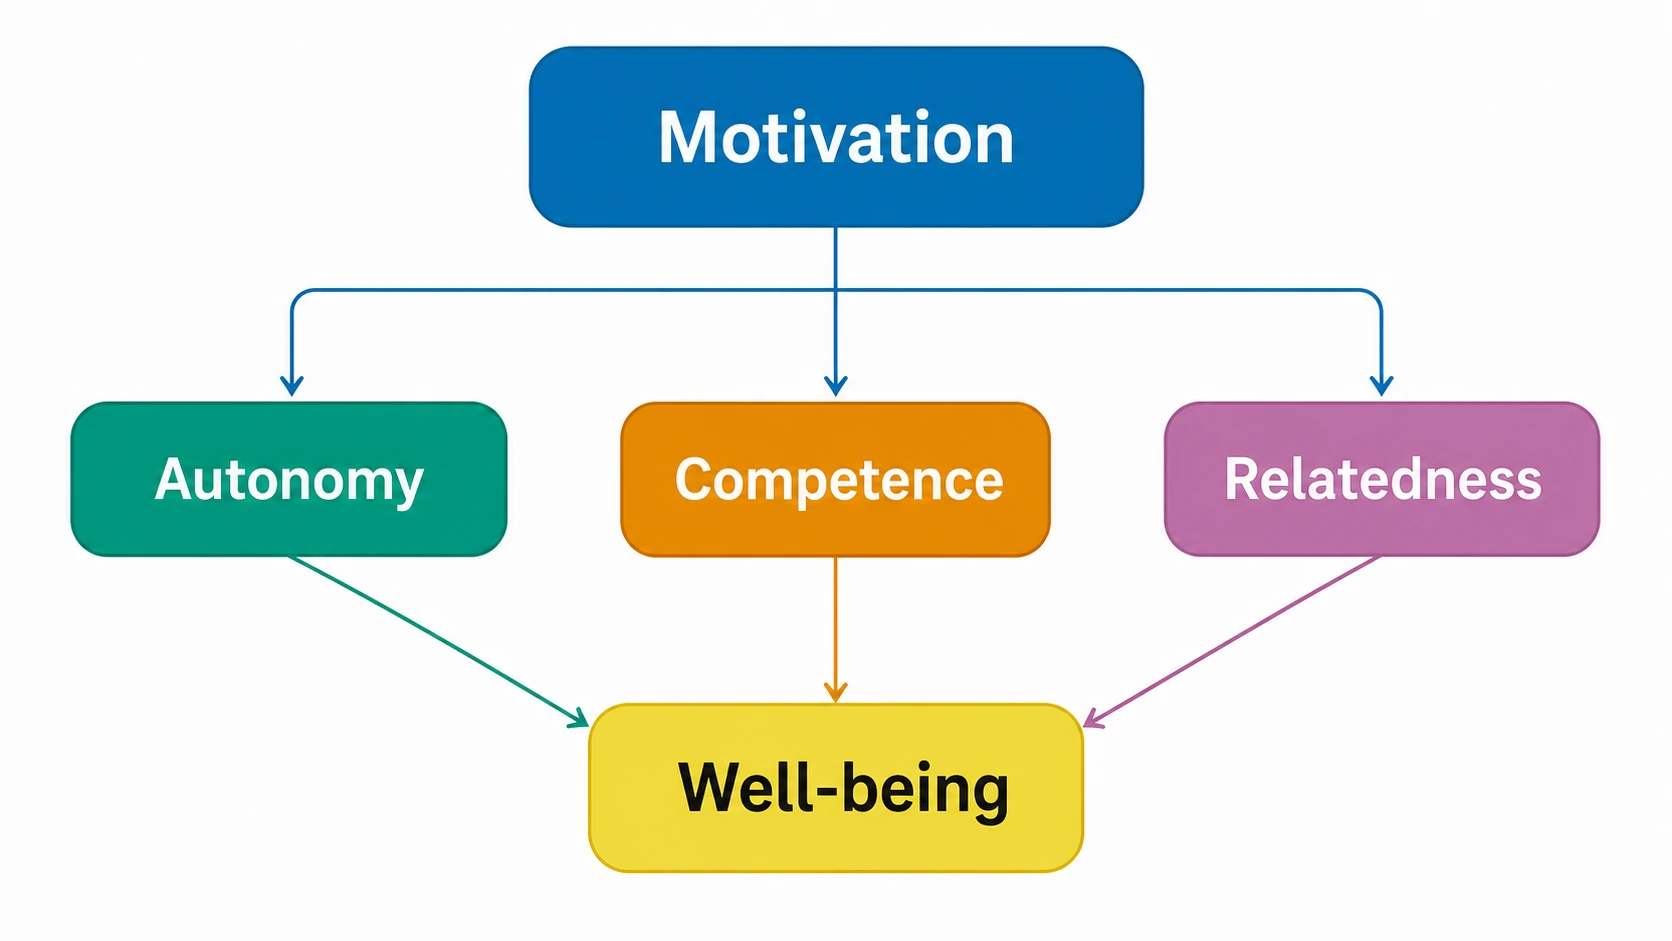
Conceptual Framework Generator
Turn variables, hypotheses, and relationships into a clear conceptual framework in research.
Research
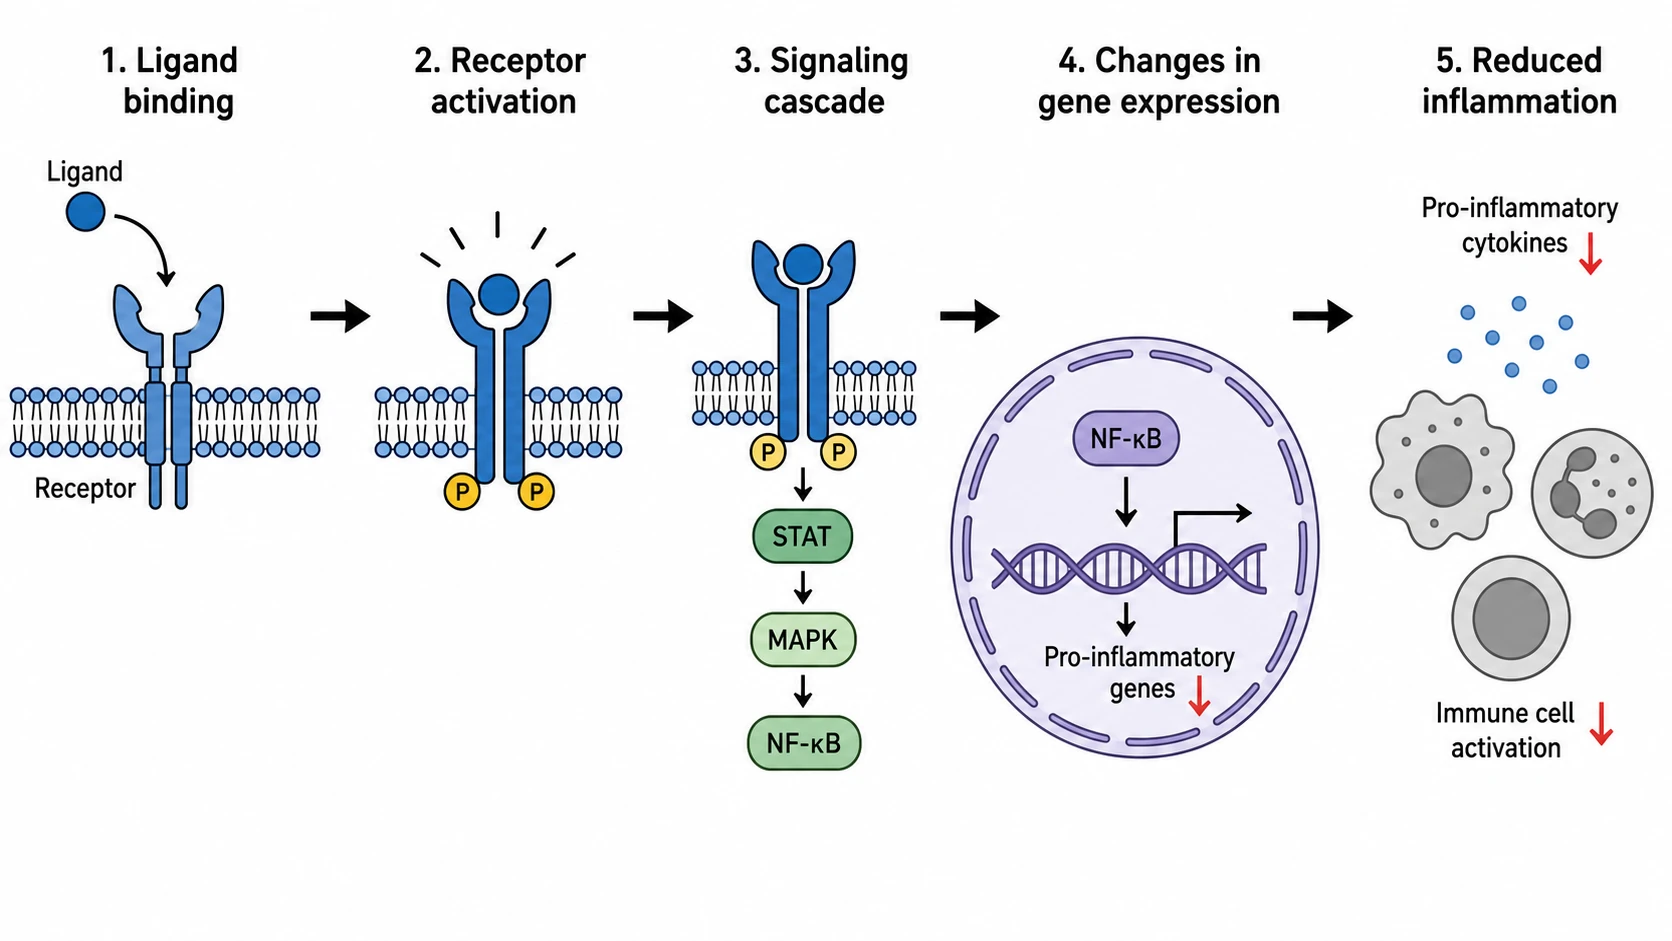
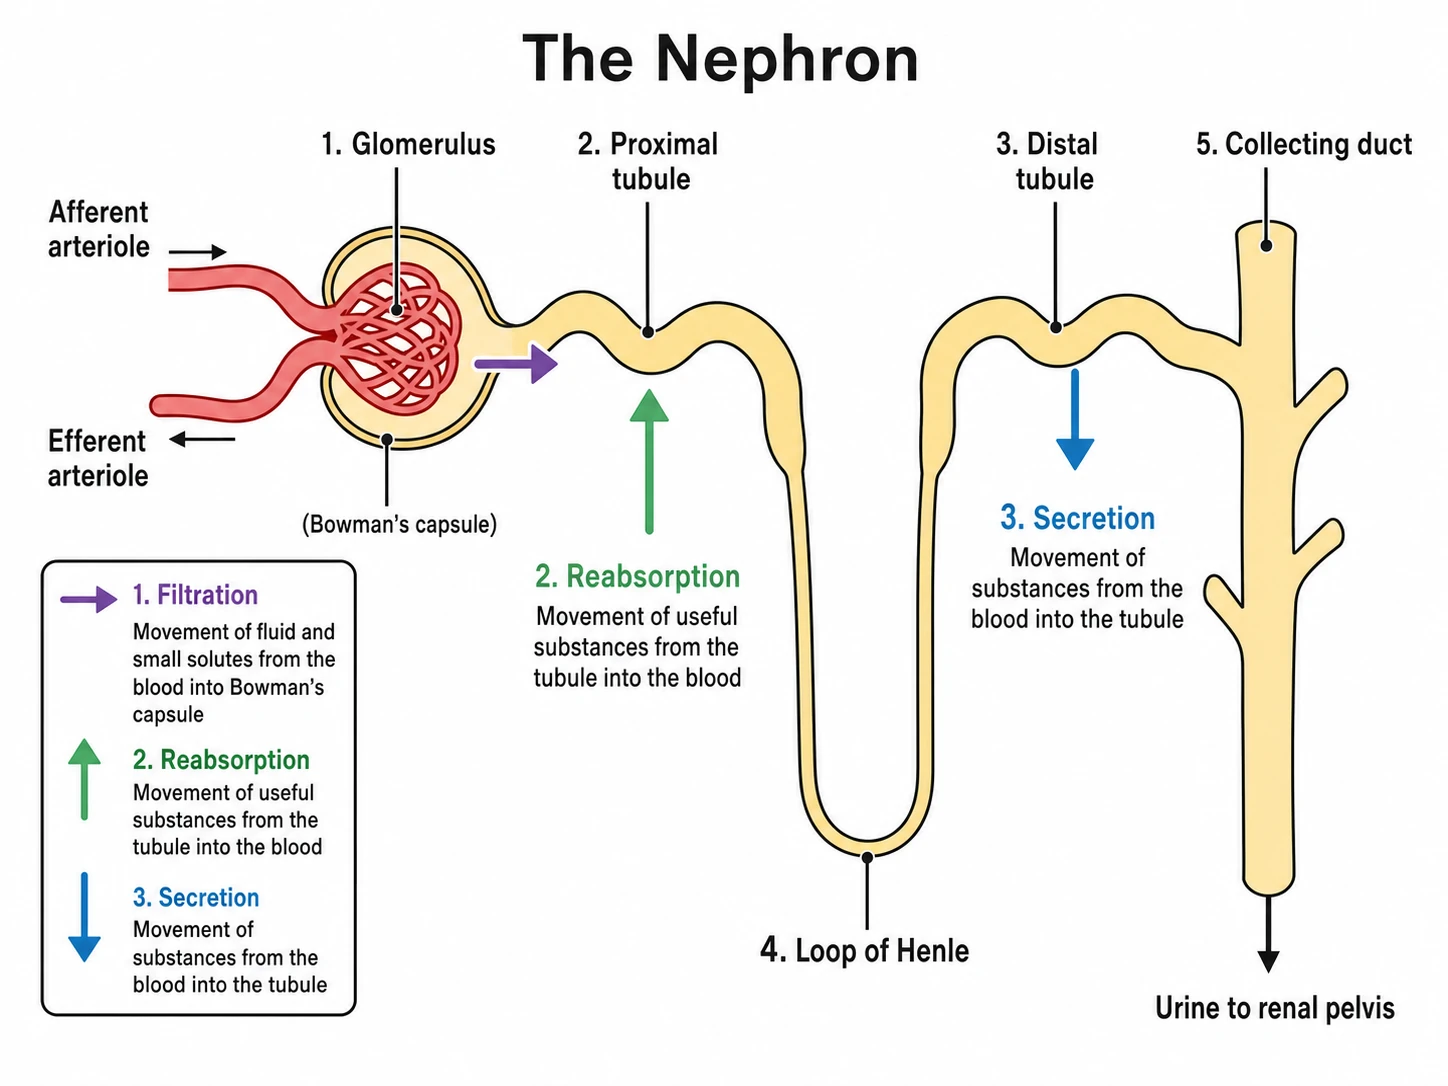
Graphical Abstract Maker
Turn your abstract into a clear, journal-ready graphical abstract.
Research
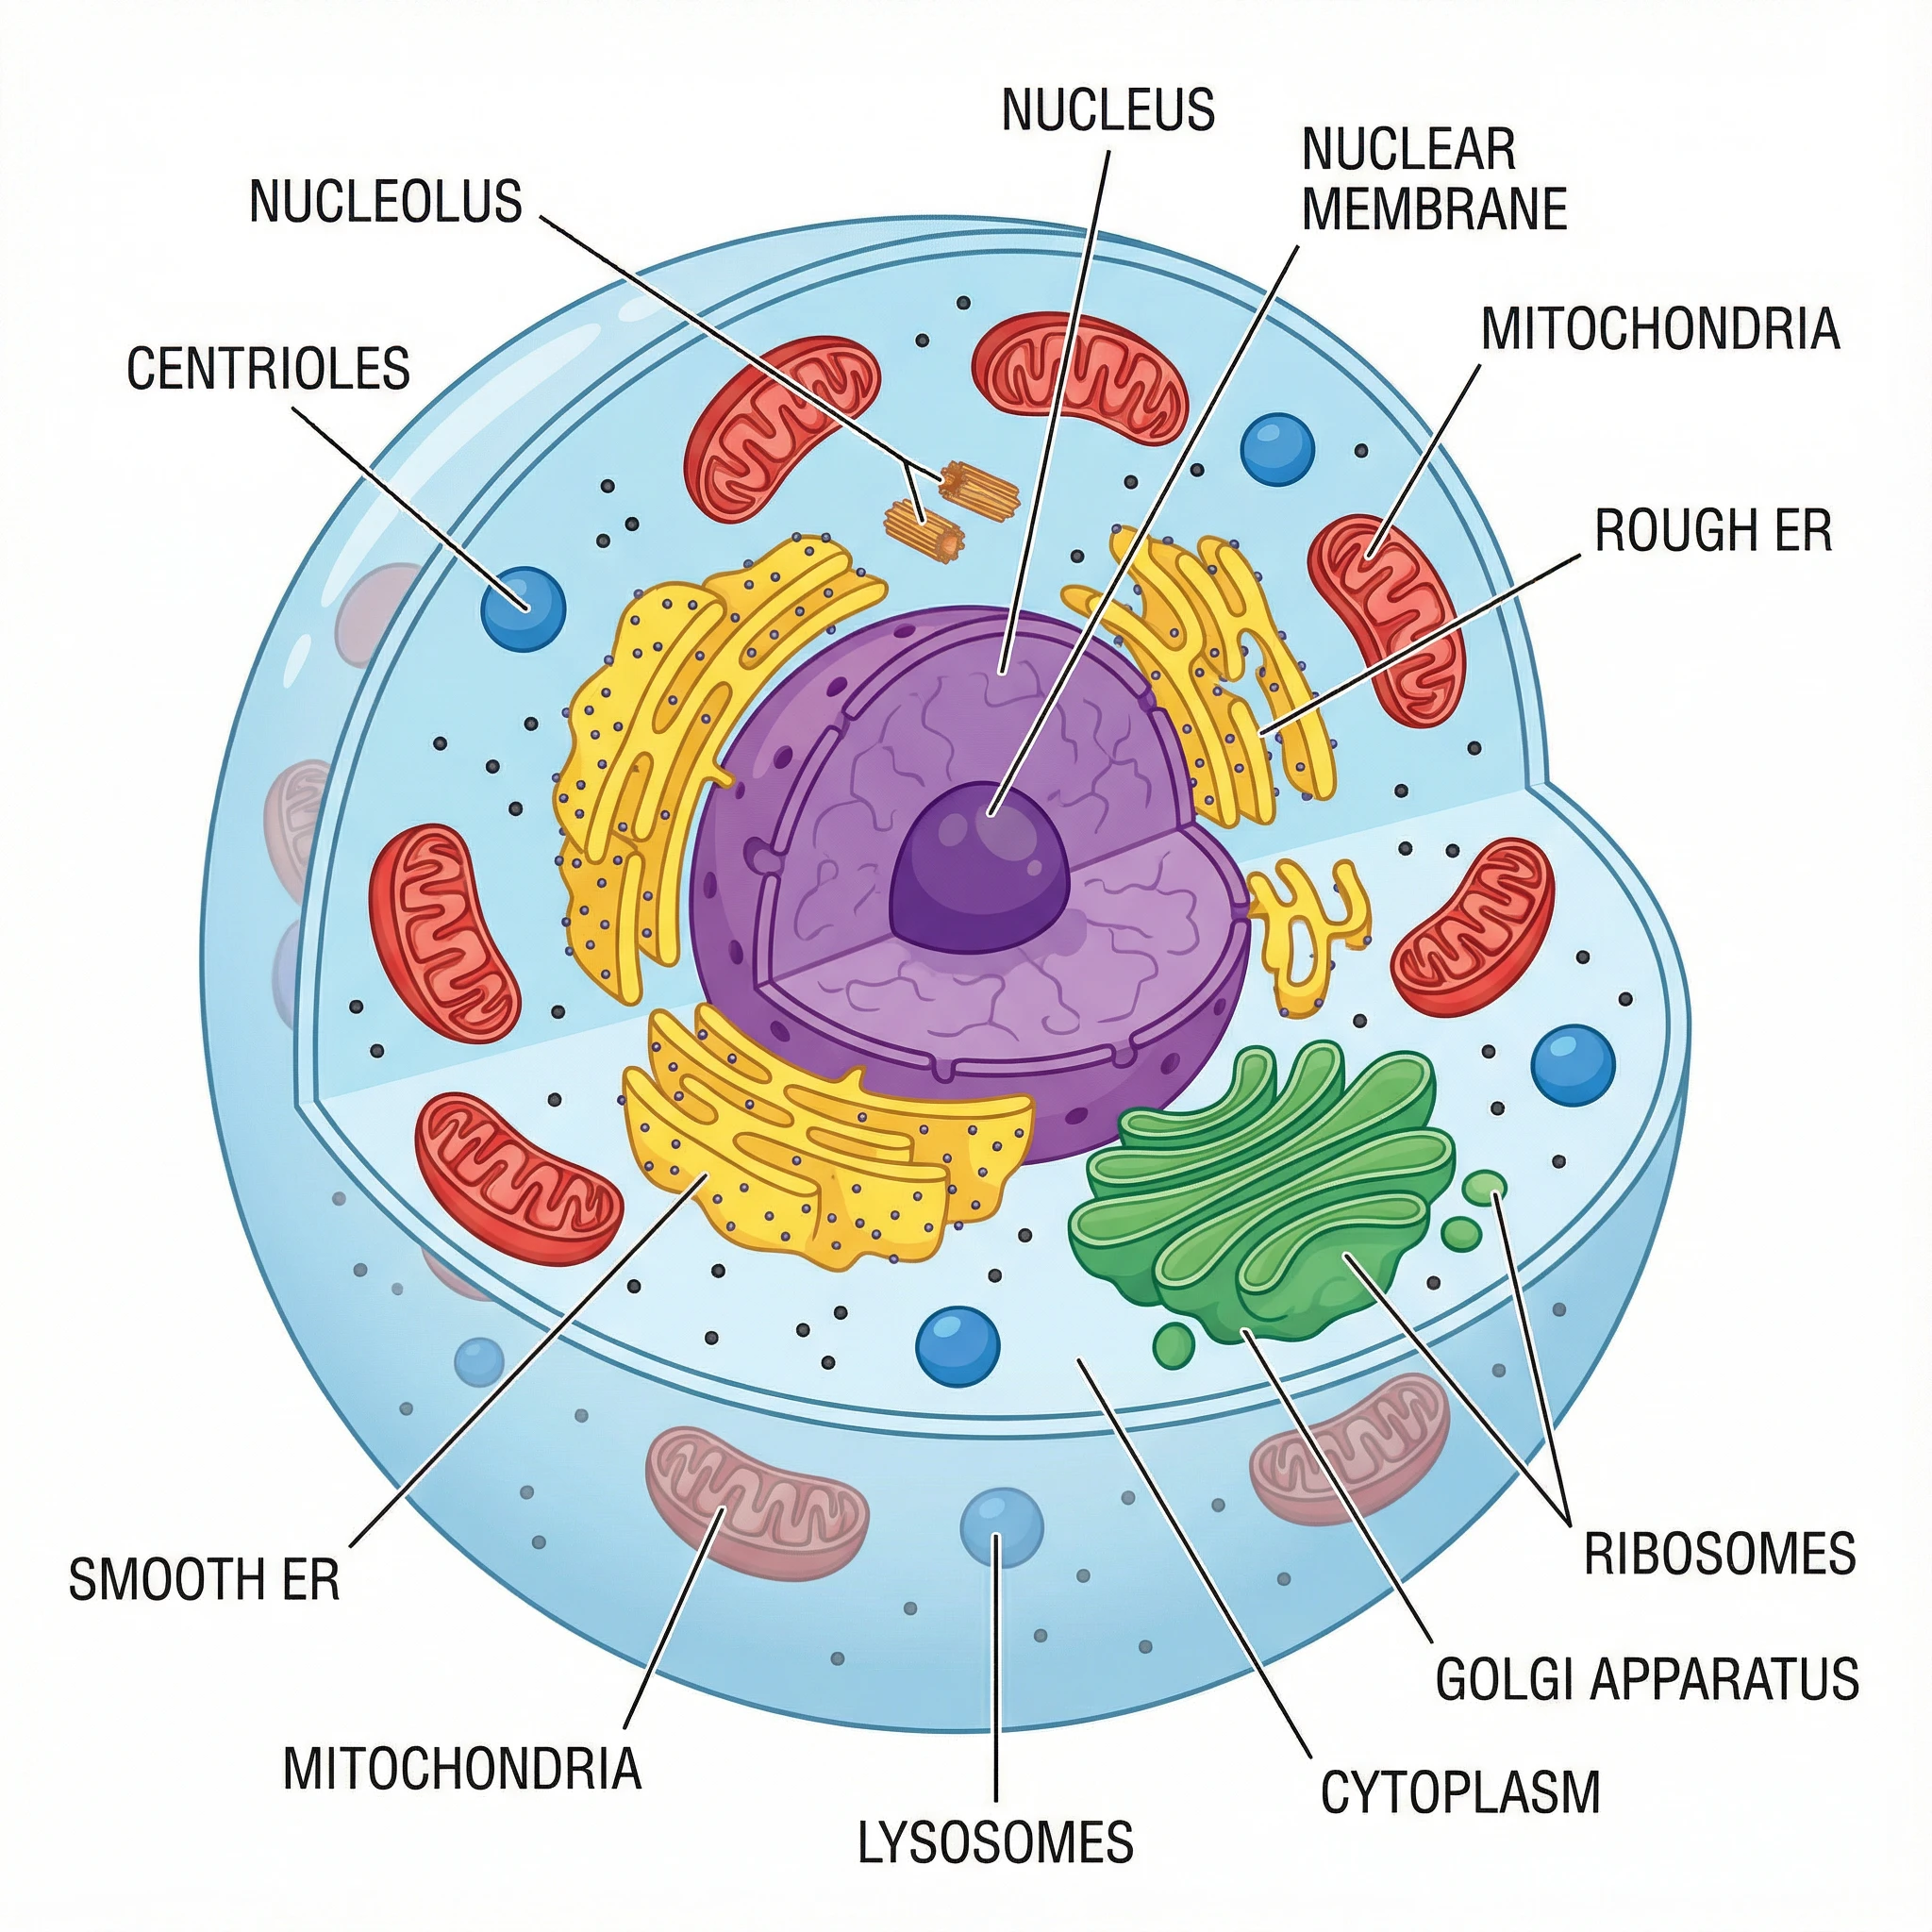
Scientific Illustration Generator
Turn a description into an accurate, labeled scientific illustration.
Research
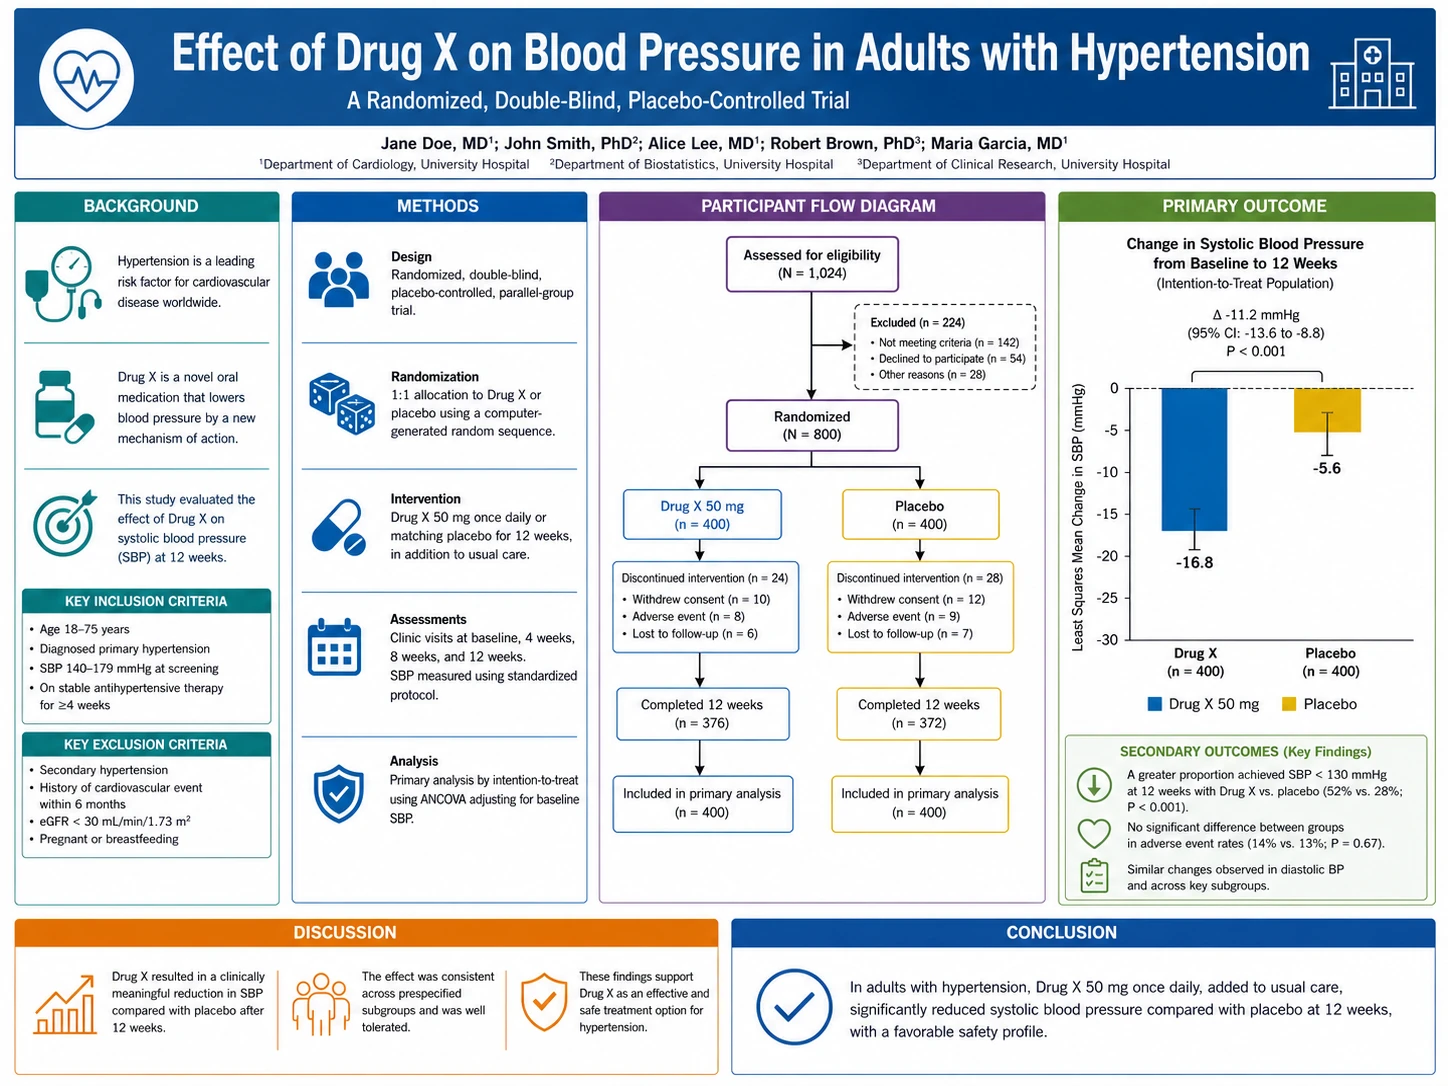
Scientific Poster Generator
Turn your study into a clean, conference-ready research poster.
Research
Theoretical Framework Generator
Turn the theory behind your study into a clear theoretical framework diagram.
From idea to publication
From idea to a publication-ready scientific figure in three steps
Keep scientific judgment in your hands while the workspace handles the first structured draft. You describe the research; the tool handles layout, labels, and sizing for your scientific figure.
01
Describe your finding or variables
State the relationship, mechanism, theory, or sections the scientific figure must communicate. The more specific your description, the more accurate the initial draft — include variable names, directions of effect, and the type of diagram you need.
02
AI drafts an accurate, labeled scientific figure
Get a structured research diagram with correct labels, directional arrows, and logical layout — instead of an uneditable decorative image. The result is organized around your research content, not visual aesthetics.
03
Edit, review, and export
Review every label and relationship in your scientific figure, refine the layout, adjust colors and typography, and prepare SVG or high-resolution output sized for your target journal or conference. The figure stays editable through every revision cycle.
Built for academic workflows
Scientific figures built for researchers and academics
Create graphical abstracts and scientific figures for journal papers that remain editable through every round of peer review. Export at the exact dimensions your journal requires — Elsevier, Wiley, Cell Press, and more.
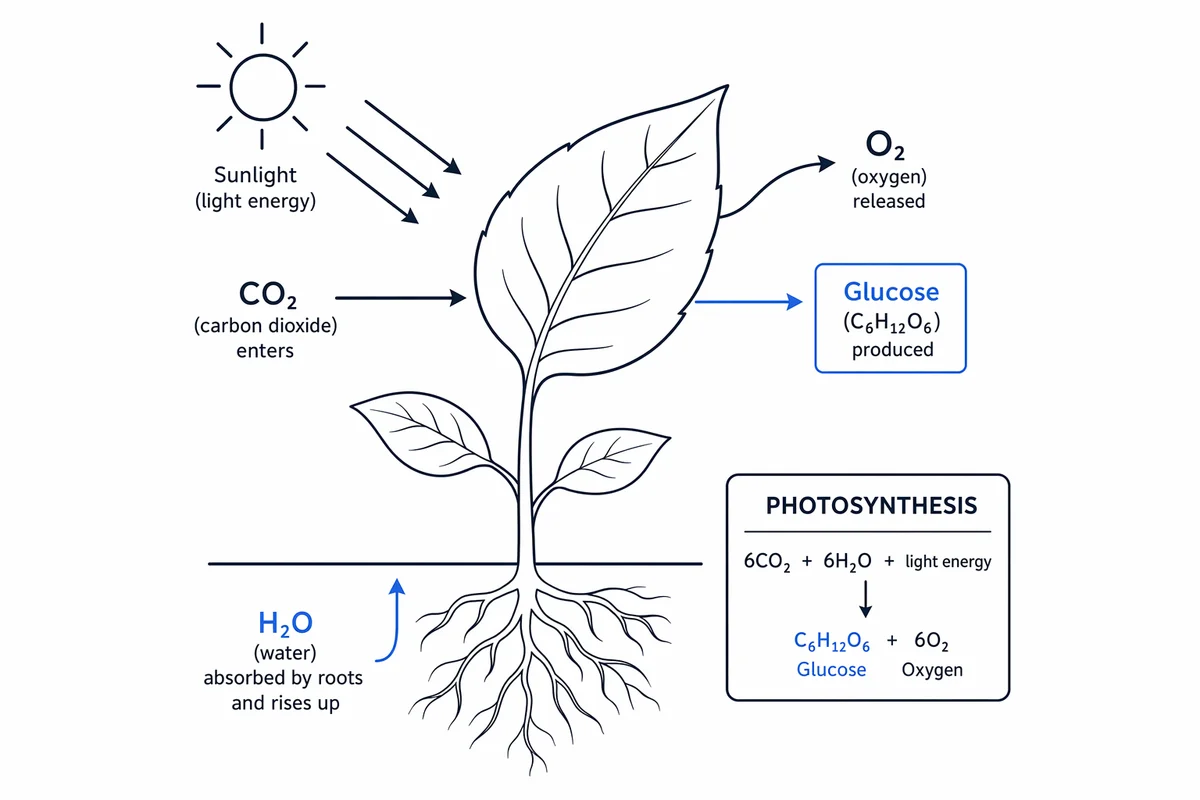
Publication-ready figure examples
Scientific figures shaped around real research outputs
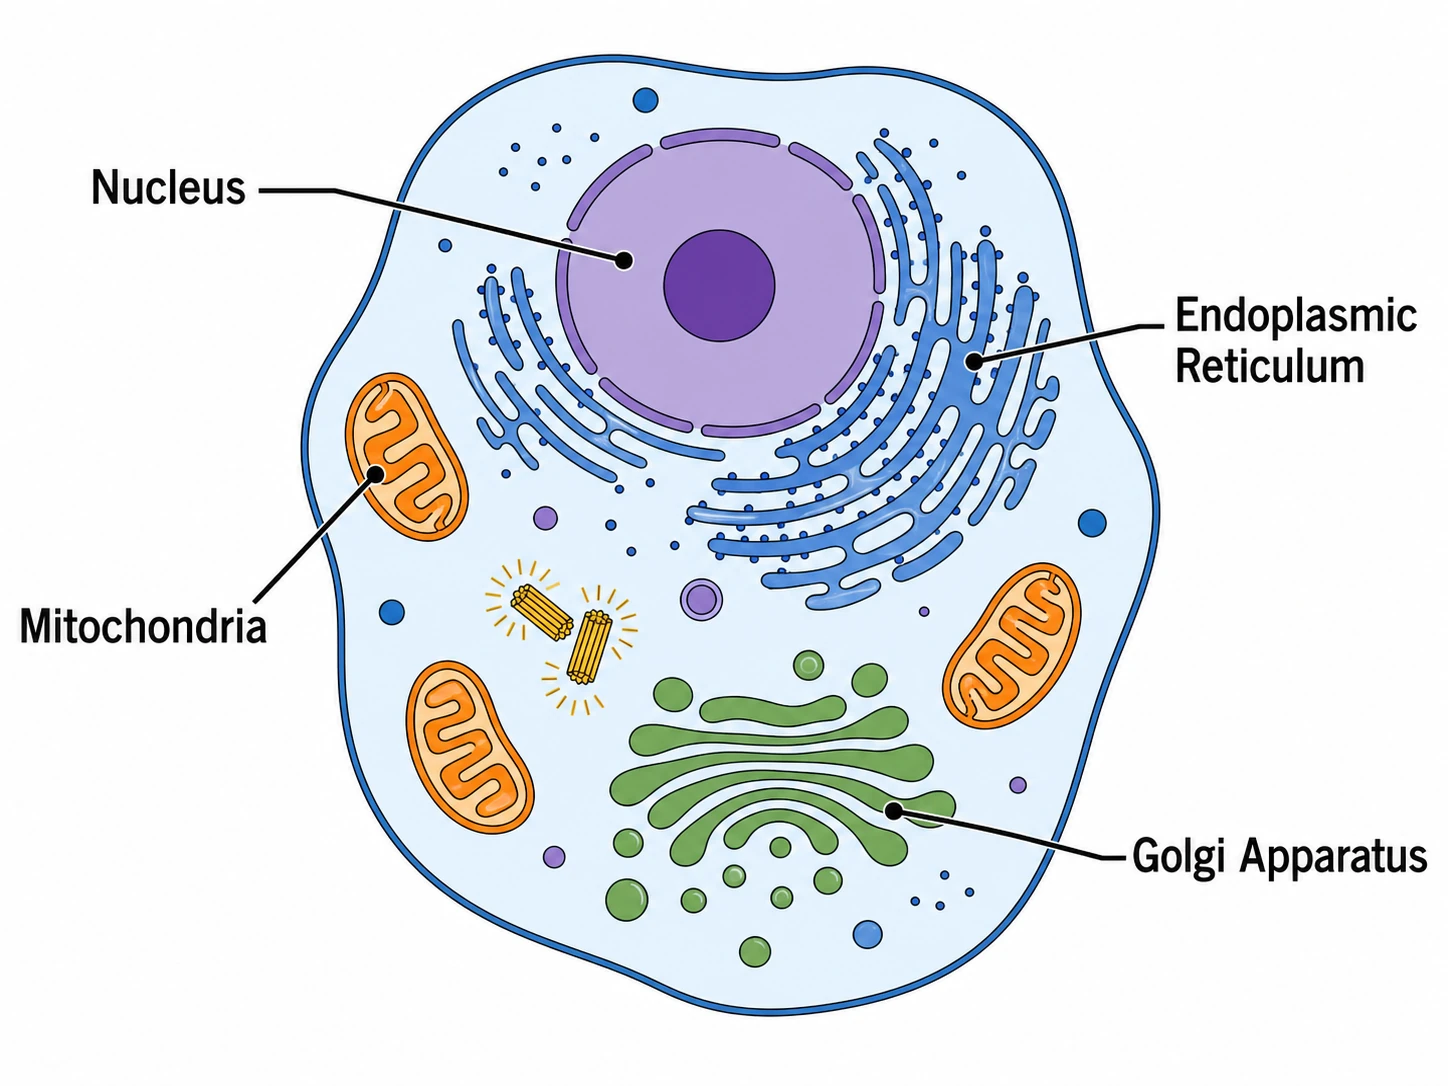
Across research disciplines
Scientific visuals for every field
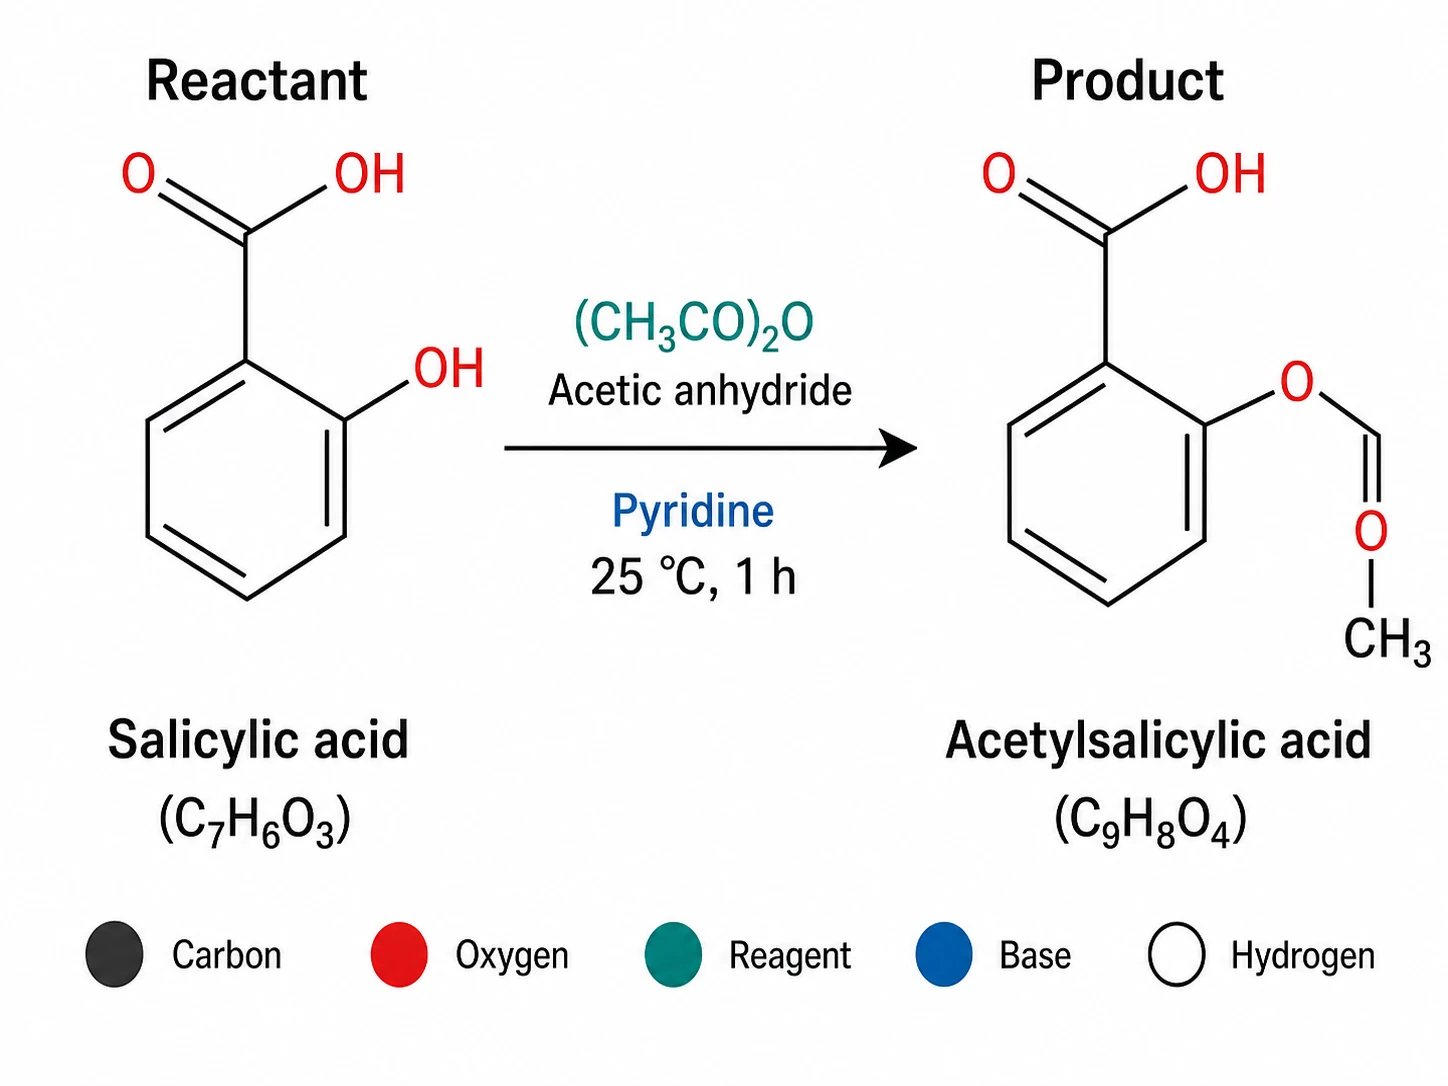
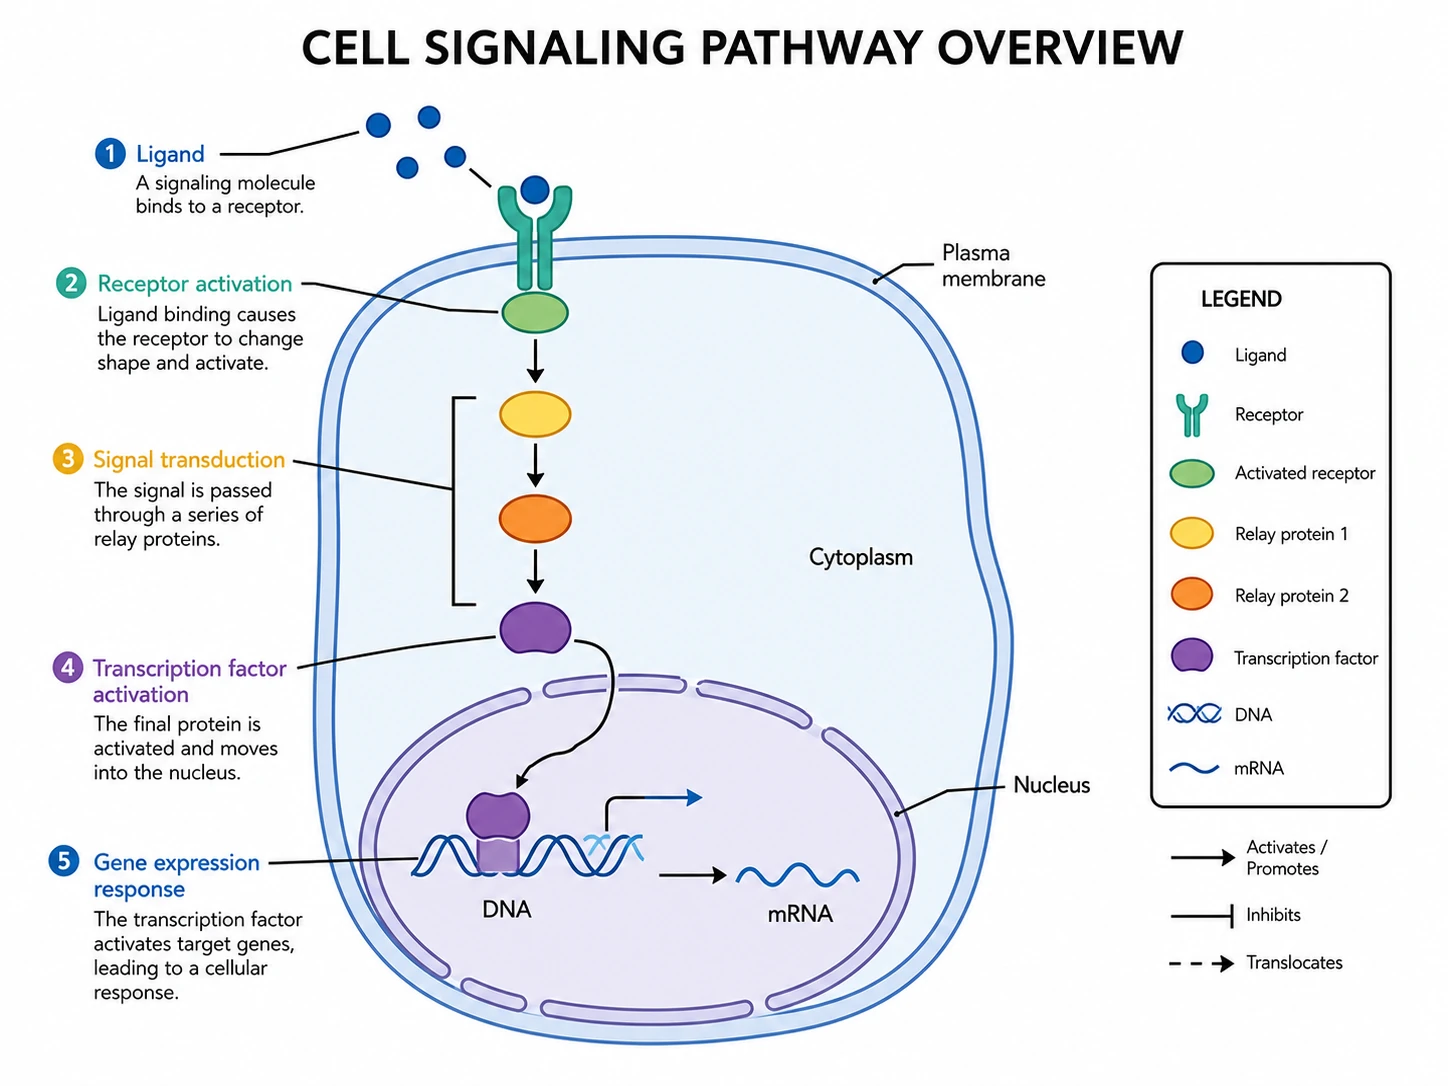
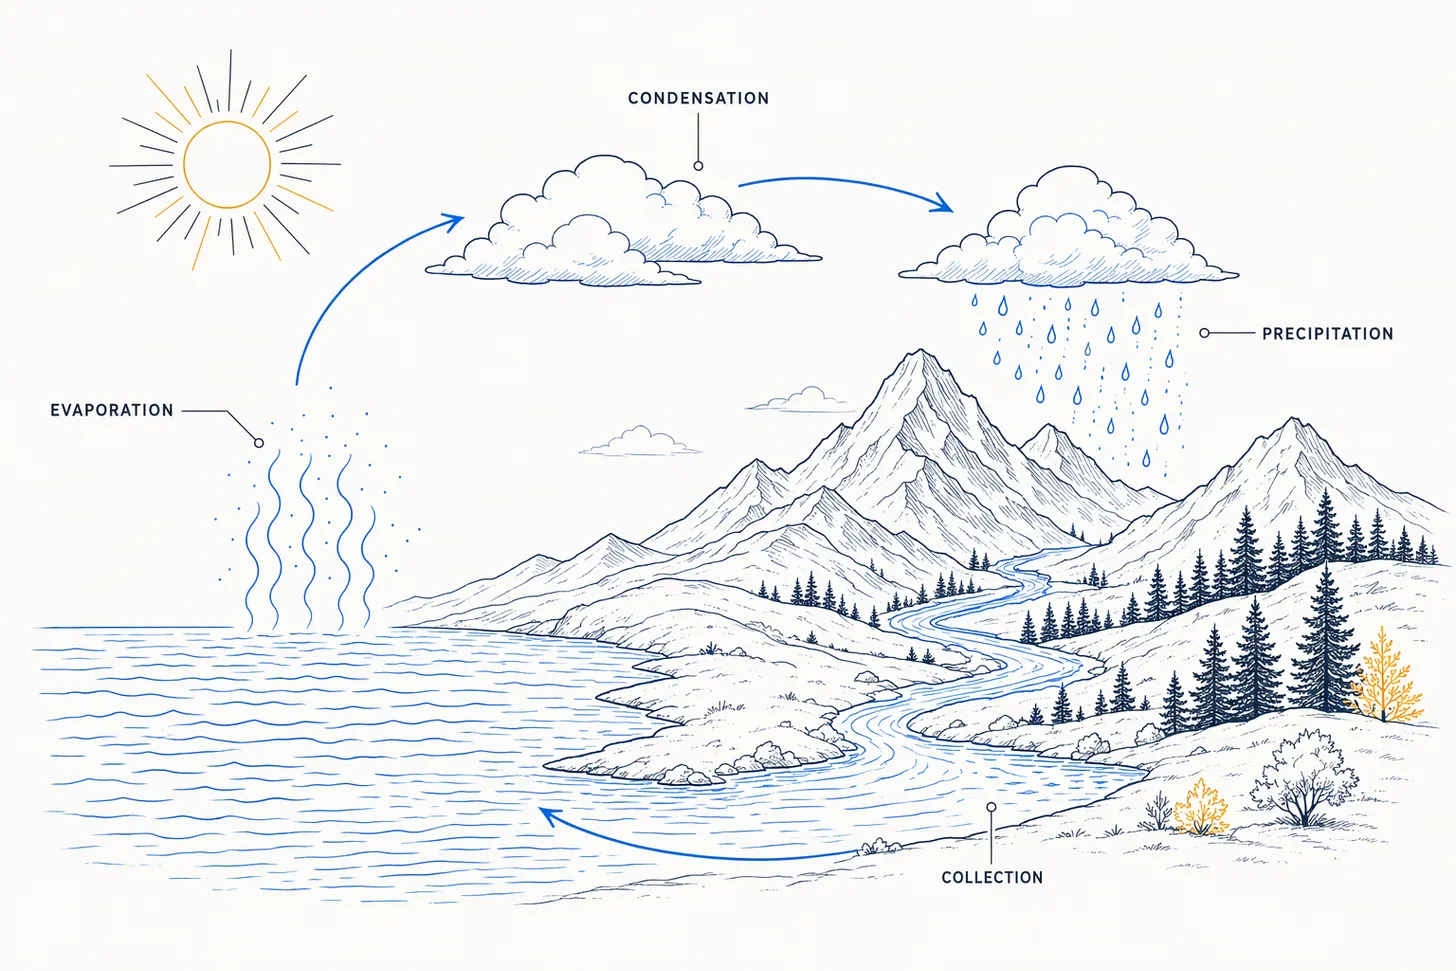
Chemistry
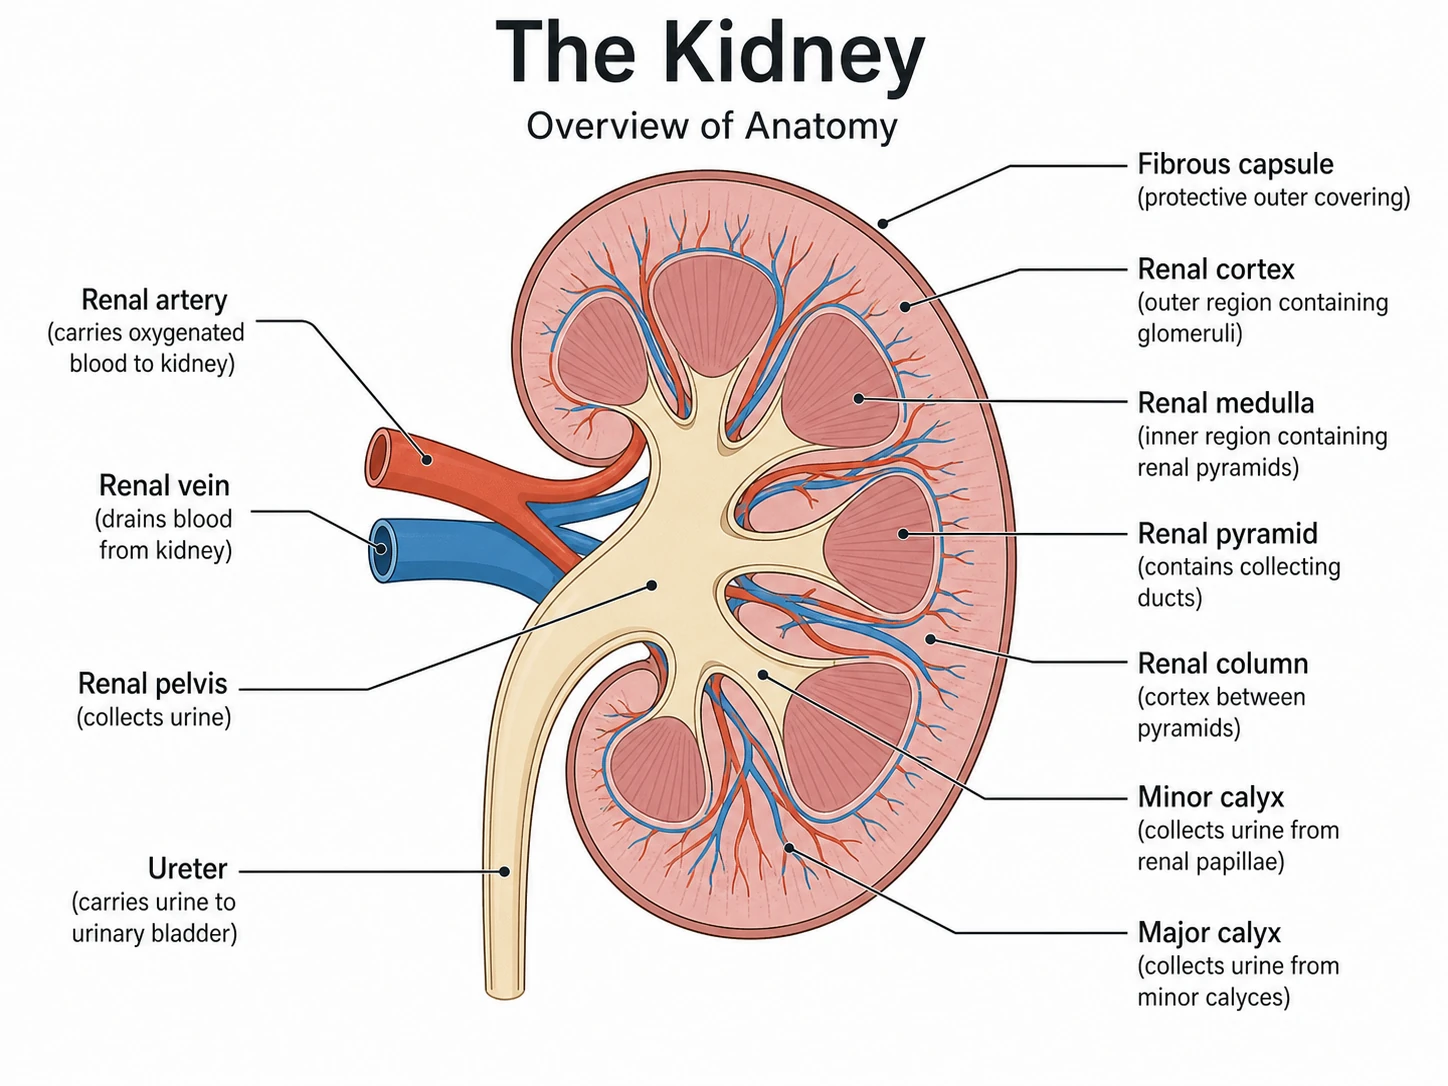
Medicine
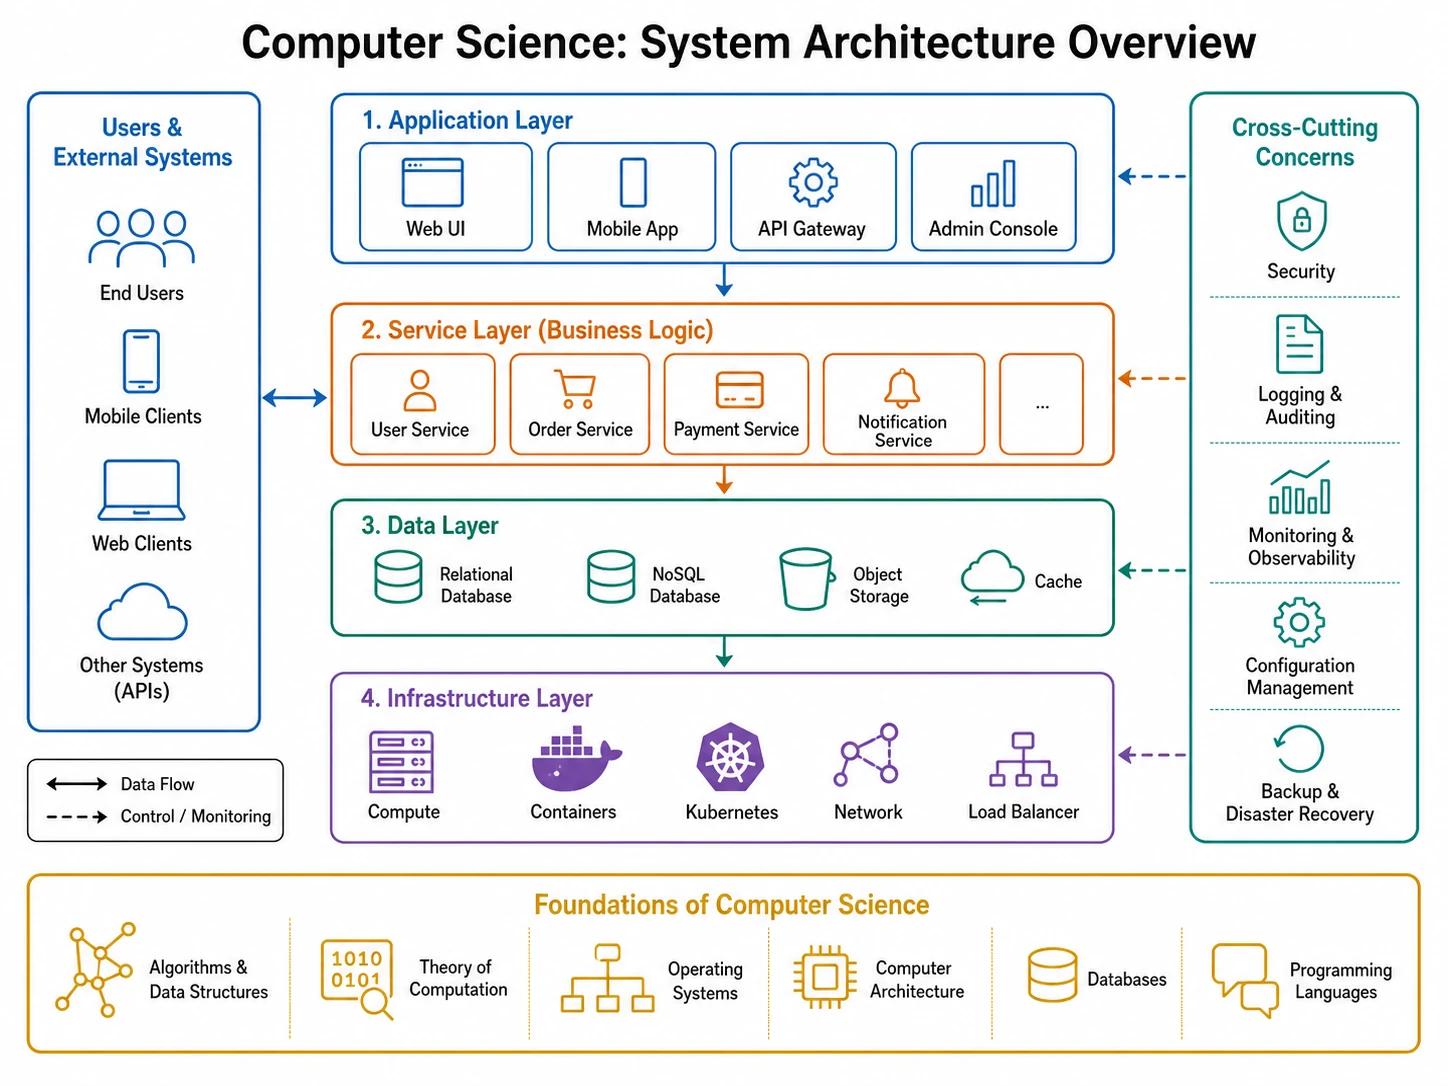
Computer Science
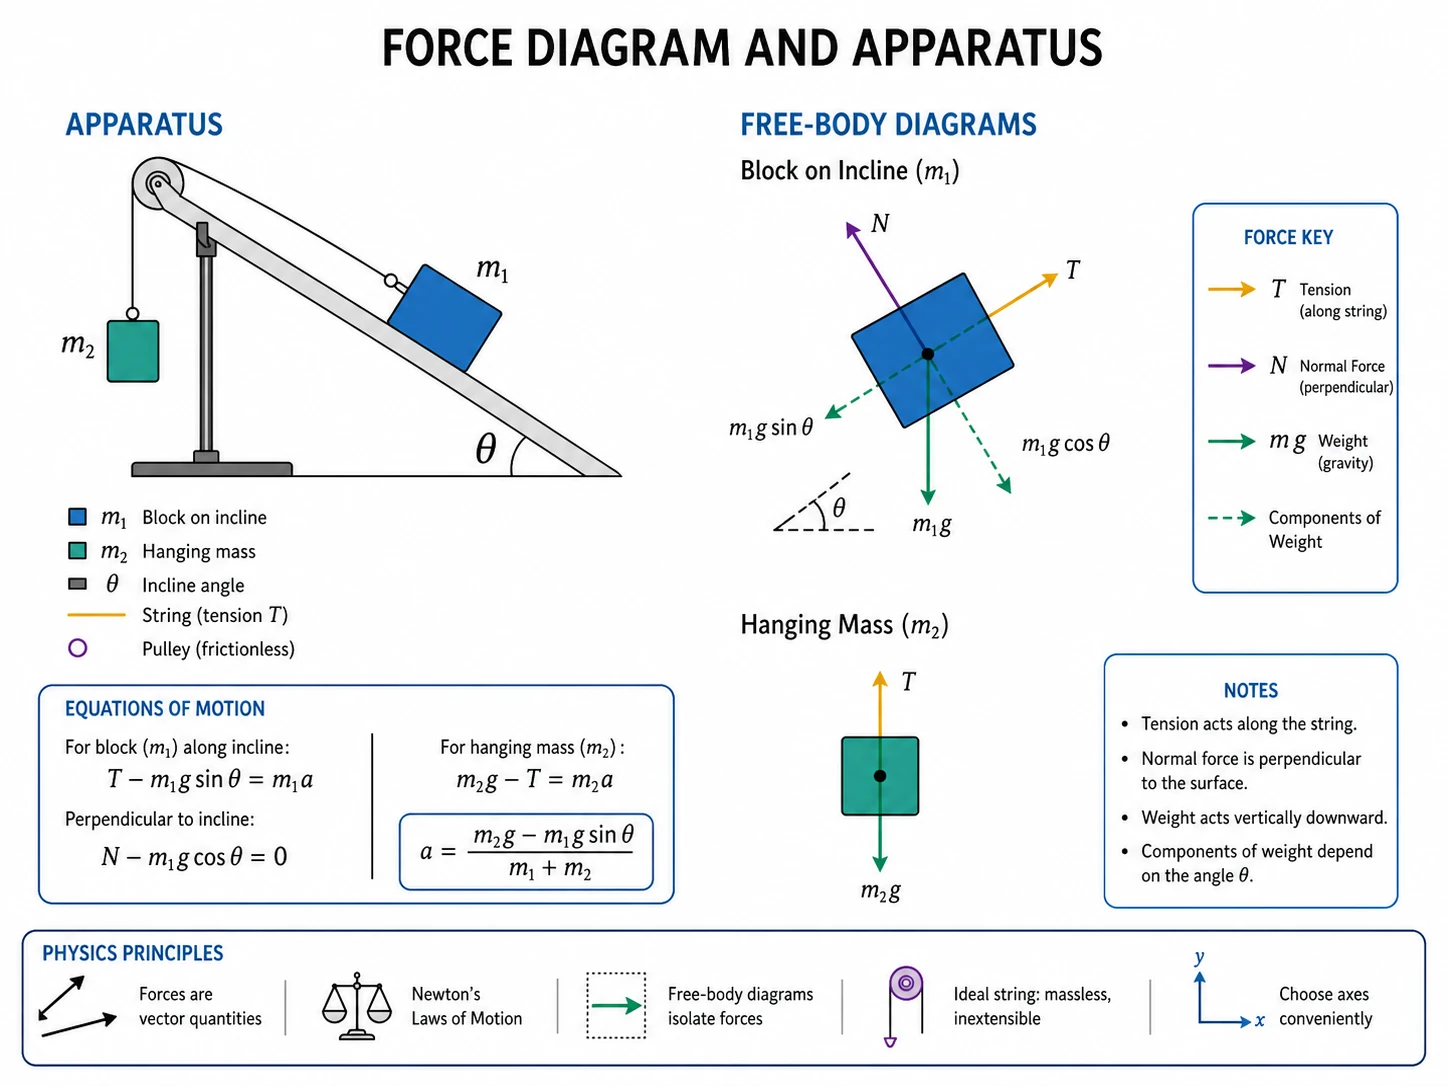
Physics
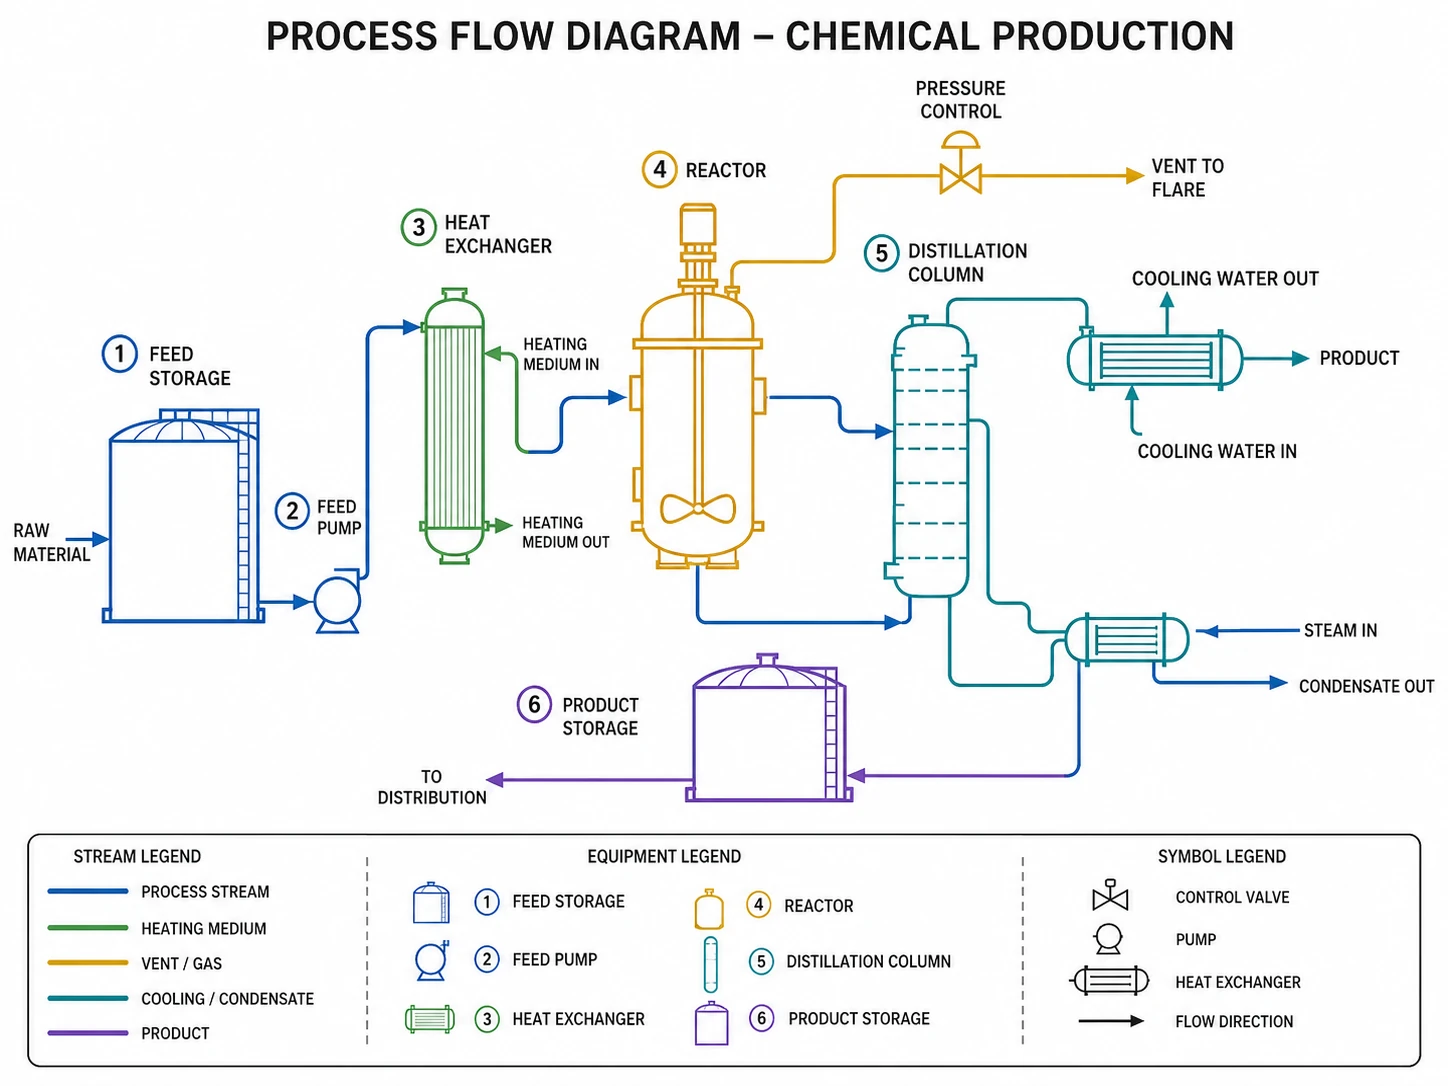
Engineering
Trusted by researchers across disciplines
What researchers say about their scientific figures
Researchers in biology, education, engineering, nursing, and social science use the scientific figure maker to go from draft to publication faster.
“I used to spend an entire afternoon on a graphical abstract in Illustrator. Now I describe my finding, edit the labeled draft, and export the scientific figure in under fifteen minutes. The SVG is clean enough to submit directly.”
D
Dr. Sarah Chen
Molecular Biology · Postdoctoral Researcher
“My committee asked me to revise my conceptual framework three times. Before, each revision meant redrawing every box and arrow from scratch. With this tool, I just update the variables and the diagram regenerates. Saved me days of work on my dissertation.”
J
James Okonkwo
Education · PhD Candidate
“We needed conference posters for three different studies in the same month. The scientific poster generator handled the A0 layout and typography automatically — we just focused on the content. Print quality was excellent.”
D
Dr. María López
Clinical Psychology · Assistant Professor
“As a nursing researcher, I often work with theoretical frameworks like the Health Belief Model. The generator understood the constructs and produced a clean diagram I could place directly in my manuscript. Much better than drawing in PowerPoint.”
R
Rachel Kim
Nursing Science · PhD Student
“I needed a figure showing our synthesis-to-characterization workflow for a materials science paper. General AI tools gave me decorative nonsense with garbled labels. This actually produced a structured, scientifically accurate figure I could edit.”
D
Dr. Arjun Mehta
Materials Engineering · Research Fellow
“The editable SVG export is what sold me. I can generate the initial scientific figure here, then open it in Figma for final touches with my co-authors. No more emailing PowerPoint files back and forth.”
D
Dr. Emma Virtanen
Social Science · Senior Lecturer
ExplainViz vs general AI image generators
Why not a general AI image generator?
General AI tools optimize for visual style — they produce beautiful images but garble labels, invent structures, and cannot export editable vectors. ExplainViz is built for research: accurate labels, structured layouts, editable SVG, and journal-spec output that researchers can verify before publication.
Generic image AIExplainViz
Scientifically structured
Clear, reviewable labels
Editable vector SVG
Journal-spec sizes
No watermark
Questions
Everything you need to know
ExplainViz is an AI scientific figure maker built specifically for researchers. It turns your research description into accurate, labeled, editable diagrams — graphical abstracts, conceptual frameworks, theoretical frameworks, and scientific posters. Unlike general image generators, every output is structured for academic communication and exportable as vector SVG.
Turn your research into a scientific figure — free.
Start from a description, review the scientific structure, and keep an editable figure for every revision. No design skills required — just describe your research and get a publication-ready scientific figure.
