-
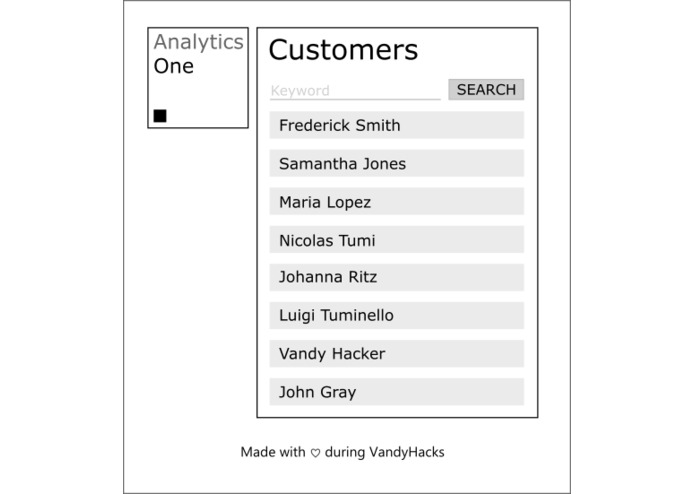
Customers List
-
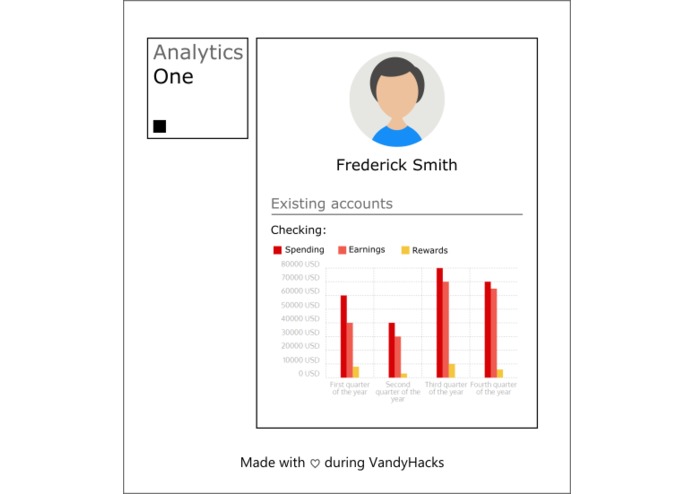
Customer View


Inspiration
Our inspiration was Nessie (Capital One's API). It gave us the idea to give a simple yet reliable data visualization web app to give companies some insight as to customer status.
What it does
It collects data from the API, represents it as a clickable list, which leads you to that customer's financial information
How we built it
We used the Nessie API to create and collect dummy data (customers, accounts and transactions) A python script runs within a controller in web2py and parses the json data obtained from the API Oh, and Nessie also served as a database for our customers (Yes, Nessie is that cool)
Challenges we ran into
We ran into a huge challenge with web2py, which doesn't support python 3. So we had a hard time debugging the whole system only to find that out. Then we needed to delete python 3 and replace it with python 2 to be successful. The second challenge was to implement the data from the api in actual charts
Accomplishments that we're proud of
We're very proud of the handling of the API, which we thought was going to be our biggest challenge but turned out to be the easiest part of the project _ eventually _. We're also proud of getting the website to run the main page successfully.
What we learned
This was a good opportunity to practice python, some nice web development, and even learn API's handling in general since it is a big part of programming nowadays.
What's next for AnalyticsOne
It would be pretty cool to implement a machine algorithm to predict the spending trends of the customer (yeah ... we are far from that, but still love the idea)
What's next for the team
We are working on future projects together in software development to further our knowledge of it and get experience for possible internships/job opportunities.
Built With
- capital-one-nessie
- chartist.js
- css
- html5
- javascript
- python
- web2py


Log in or sign up for Devpost to join the conversation.