-
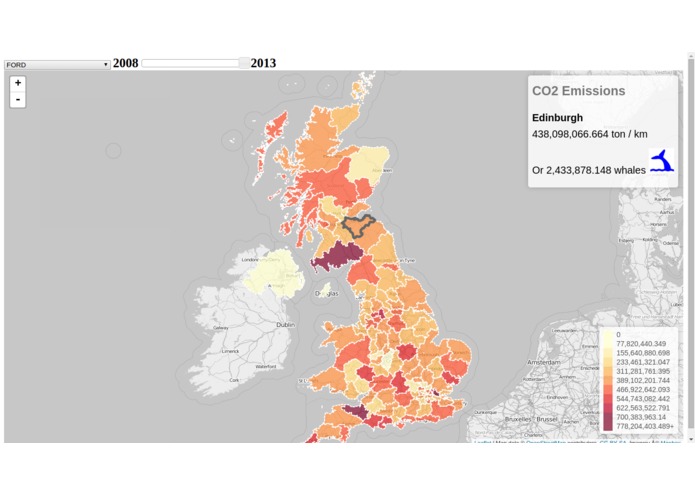
Main screen of CO2 emissions

Inspiration
After the recent climate change conference we wondered if we could get a rough estimation of car co2 emissions in the UK based on the real mileage of vehicles.
What it does
It visualises an estimated of car co2 emissions per manufacturer and per year.
How I built it
The backend runs in NodeJS and queries the ElasticSearch instance of CDL to retrieve MOT test data. Using the mileage of each tested car, GIS data about the UK post code areas and data from the UK government about the registered average emissions of each manufacturer we came up with an estimation of CO2 emissions per post code area in the UK. You can also visualise the emission per year from 2008 for all the manufacturers.
Challenges I ran into
Mashup CO2 emissions data with CDL data. Handling of big amounts of data coming from the CDL ES instance. NodeJS (it was the first time we used it)
Accomplishments that I'm proud of
The mashup of data and the map visualisation of the emissions using JavaScript
What I learned
NodeJS, new map tools and bits of python scripting.
What's next for CO2Much
Maybe visualise other variables.


Log in or sign up for Devpost to join the conversation.