-
-
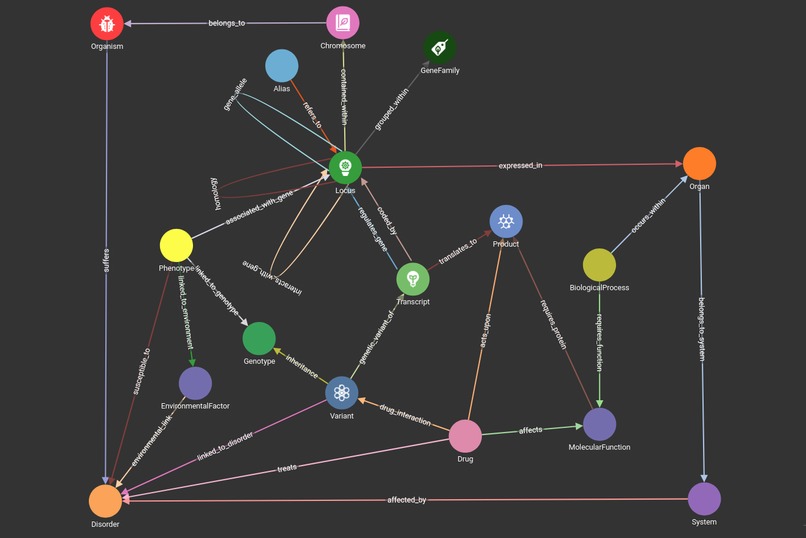
Schema created in TigerGraph GraphStudio
-
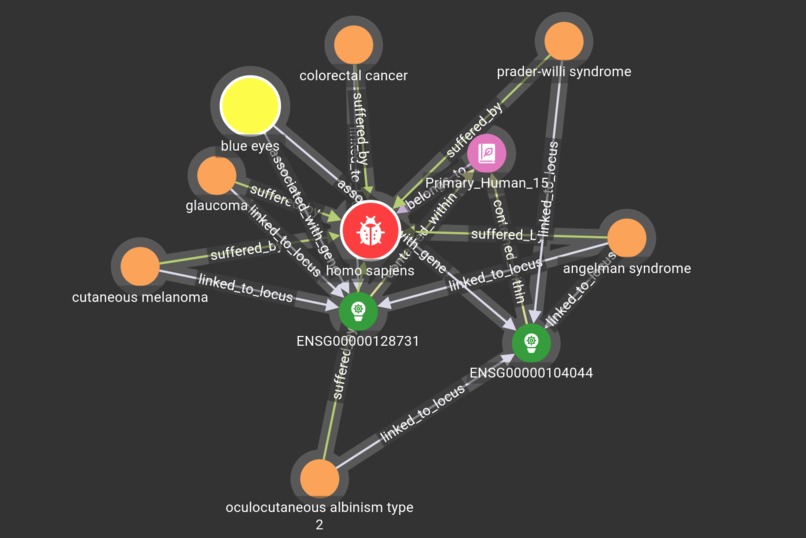
Phenotype and disorders associated with the same genes
-
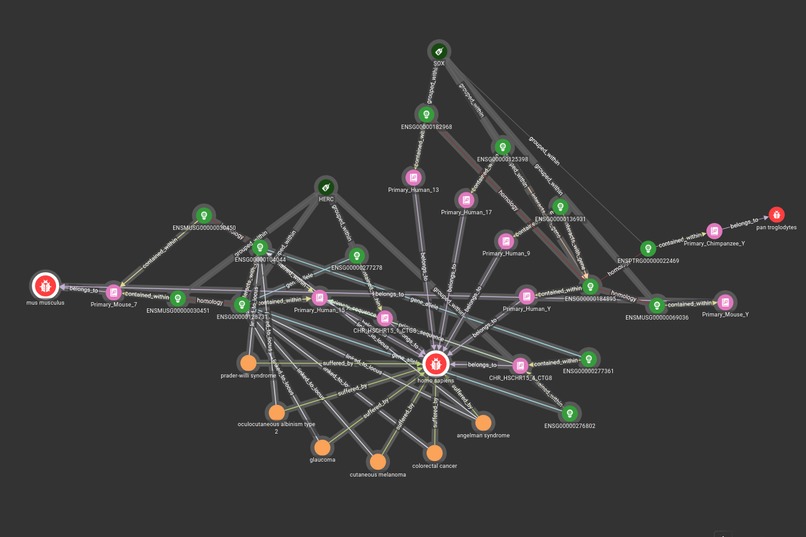
Homologous human and mouse genes
-
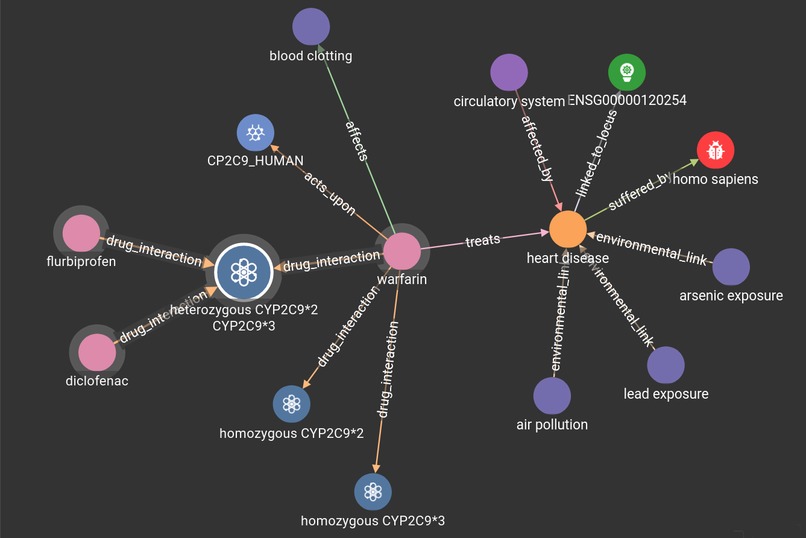
Drug interaction with a particular genotype


Graph For Better Genetics
DNA sequencing generates incredible amounts of data describing nucleotide sequences and genetic variants and their coded products, often spread across multiple databases. Other databases contain details of medical conditions and treatments, which may be affected by genetic variation. By using graph analytics, the associations between genetic variants, traits, disorders and treatments can be fully exploited and understood, by providing a mechanism to link all the data together in an accessible way.
Inspiration
The introductory videos explaining TigerGraph and the "Graph For Better X" category of the Graph For All Challenge provided the inspiration for this project.
What it does
The project uses TigerGraph to demonstrate a graph schema that relates aspects of genetics, health and treatments, allowing the discovery of links between particular genes, phenotypes and drug interactions, amongst other characteristics.
Example data sources
How I built it
The schema was created in GraphStudio, with the mapped data collected from several existing open-access databases.
What's next
The next step is to automate the collection of data from existing sources, to massively increase the size of the dataset imported into the TigerGraph schema.


Log in or sign up for Devpost to join the conversation.