-
-
Cover page
-
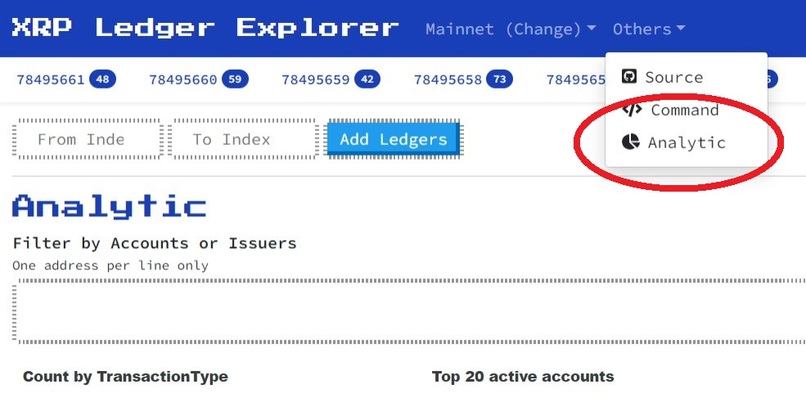
Accessing the analytic page
-
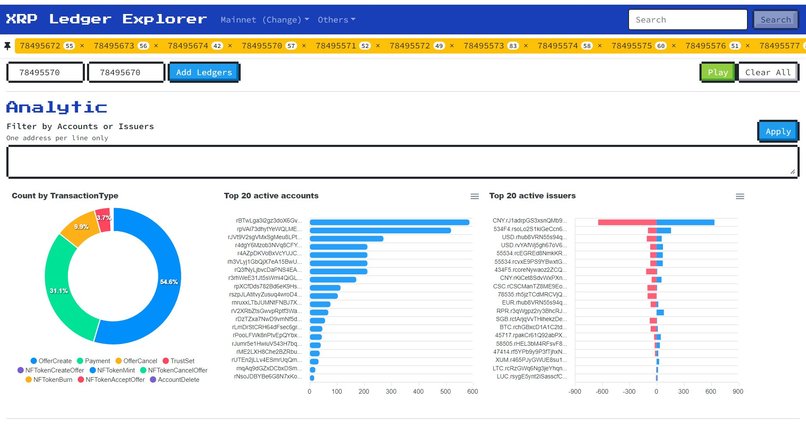
Transaction patterns of the loaded ledgers
-
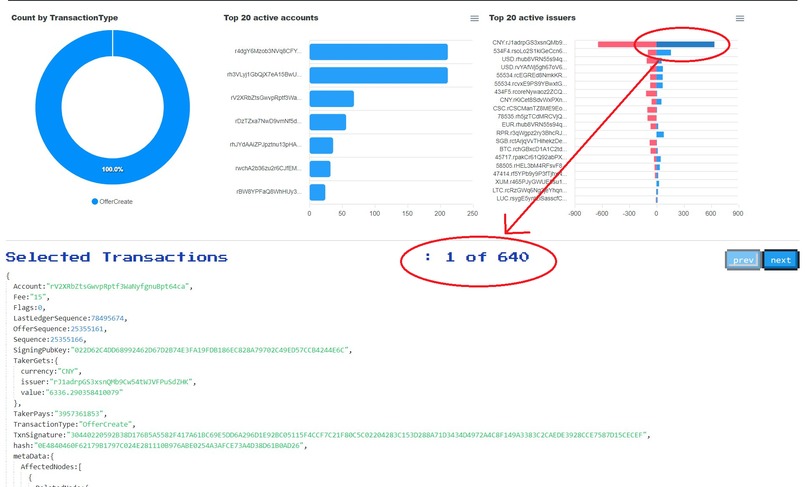
Drill in to inspect raw data
-
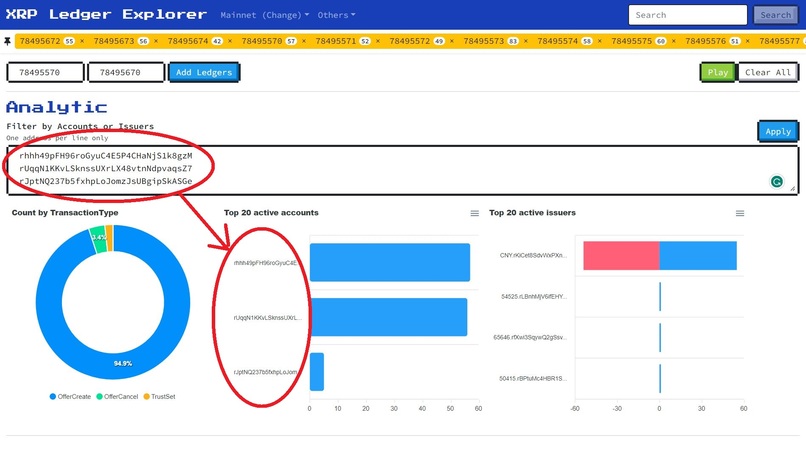
Filter by accounts or issuers
-
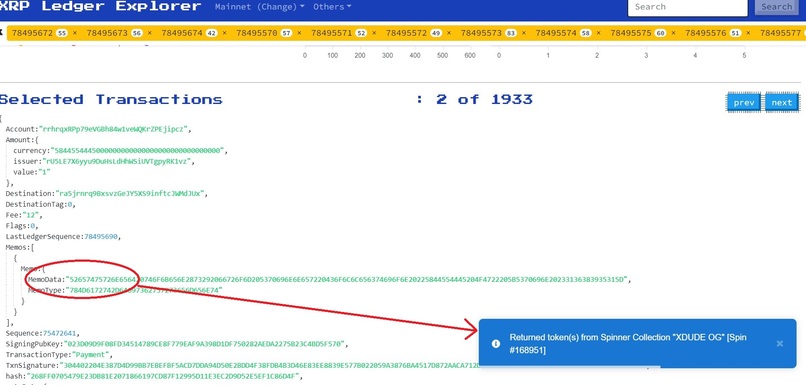
Decode memo on the fly
-
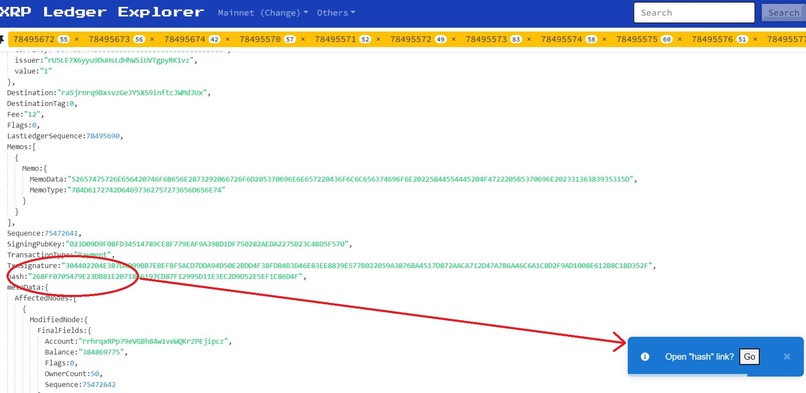
Open routable link to another page


Inspiration
There is a lot of scams surrounding crypto-currency lately. People should be cautious when dealing with cross-currency or tokens, especially from an unknown issuer.
As a user myself, I found it difficult to get enough information to understand the trends and patterns happening in the (blockchain or specific issuer). There is a lack of consolidated transactions in the form of graphs or charts for all the existing XRP explorers.
I saw this as an opportunity to build something. Indirectly, help other XRP users gain insight into the blocks, accounts, and issuers they are trying to understand.
What it does
The app has the ability to process ledger information into simple-to-understand charts. The chart allows users to investigate and compare the transactions between accounts and issuers.
On top of that, there are also additional features for the users to filter and drill into the specific information they are trying to get.
How we built it
By leveraging on the existing Technical Explorer. We forked the project and added /analytic page to access the analytic feature.
The existing project helped us to bootstrap many of the UI elements. With that, we can focus on completing the desired analytics feature. The outcome is a full-fledged explorer and analytic platform for people to use.
Challenges we ran into
Since the Technical Explorer is written using Vue.js. We need to learn the new framework from the ground up. These include working with some of the new components as we try to get the requirement into an actual product.
We wanted to allow users to search for blocks using "DateTime". However, we found it to be challenging to convert "DateTime into ledgerIndex". There isn't a known method or util function available for this. LedgerIndex is needed for us to retrieve and load the data. Ultimately, we decided to trim down the requirement to just inserting ledgerIndex.
Accomplishments that we're proud of
The analytic tools performed as expected. It managed to answer some of the questions I had about the blockchain.
The functionality we built is able to serve more use cases than we originally intended. For example, a developer who wants to monitor their change without the noise that is not their account. Or investors researching the issuers they are about to invest in, etc...
On performance, once all the information is loaded, the interaction with the charts is nearly instant. We're proud to spend the extra effort to optimize the performance so that users can have a better experience using explorer to find the answers they need.
What's more, we manage to keep to the original design and architecture. There are no third-party dependencies and services needed. This makes it easy for other developers to clone and redeploy for their own XRP network.
What's next for Insight Block for XRP
Once the demand grows, there will be a need to analyze a bigger range of the (from/to) LedgerIndex. When that happens, I foresee we could build a service to process the ledger into SQL-liked DB for quicker query time.
Built With
- vercel
- vue
- xrpl.js


Log in or sign up for Devpost to join the conversation.