-
-
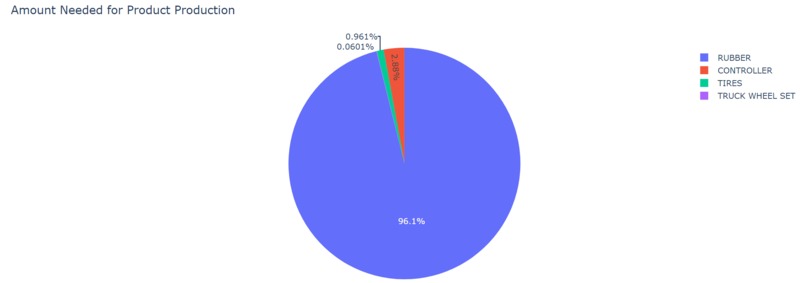
Amount Needed for Product Production
-
Amount needed and consumed for the required raw materials
-
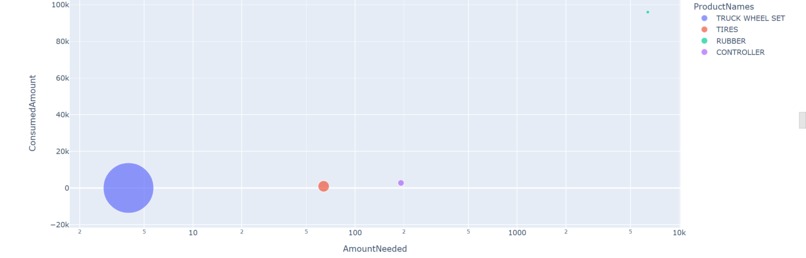
Production Capacity Analysis
-
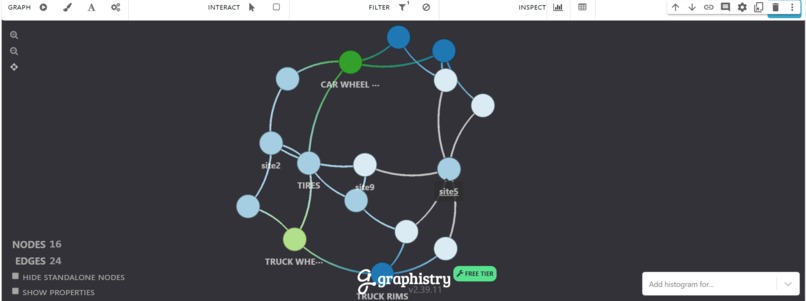
Analyze the effect of one site down on other products and sites.
-
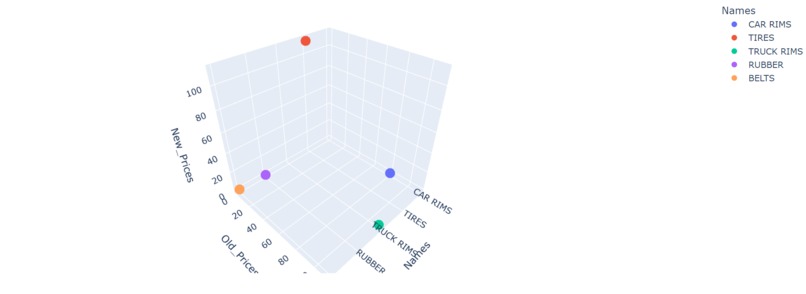
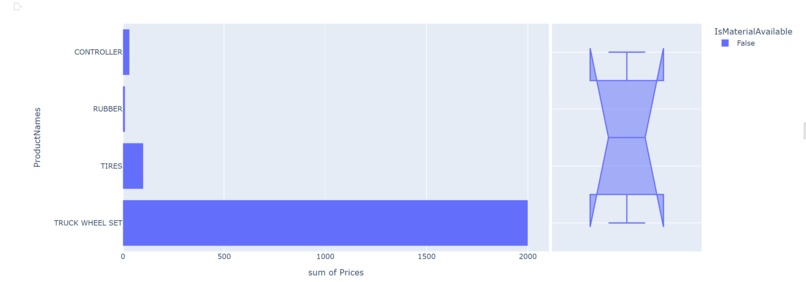
Comparative analysis of products new price and old price
-
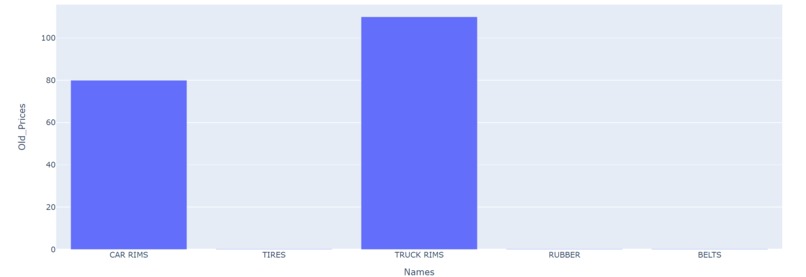
Old prices of products
-
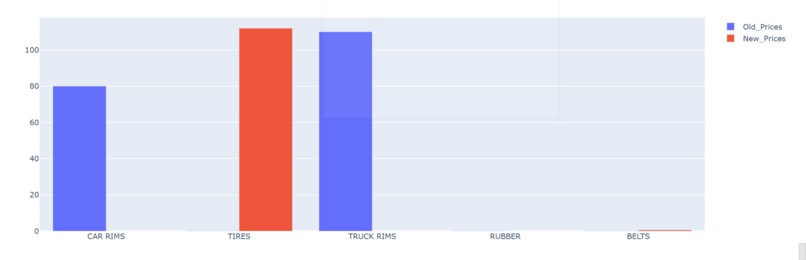
Comparative analysis of products new price and old price


Inspiration
Graph database transforms a complex web of dynamic data into meaningful relationships to help deliver real-time insight and action. This hackathon inspired me to explore TigerGraph and develop interesting application using it. So, I chose to built analytics solution on supply chain. As we all know, supply chain plays a vital role in delivering goods and services to the customers. Some of the key challenges involved in supply chain are:
- Effect of one or more manufacturing unit downtime on the entire supply chain
- Current production capacity may not be able to meet the increased product demand
- Effect of increased price of raw materials on product manufacturing and product price
What it does
Supply Chain starter kit is used for this hackathon, in which various analytical aspects of the data are showcased with interactive UI using tools such as Graphistry, plotly, etc.
- showWholeGraph: return all the edges and vertices of the graph
- checkStocking: calculate the amount of raw material needed to produce the required quantity of product and if the current production capacity is capable of fulfilling the requested demand.
- impactAnalysis: analyze the effect of site down on other products and sites.
- pricePrediction: analyze if the price of one or more product changes, how will it effect the prices of other products.
How we built it
- Backend : Installed GSQL queries in TigerGraph database
- Frontend : Jupyter notebook and Visualizations tools such as Graphistry, Plotly,etc. Pandas for data transformation
Challenges we ran into
Integration of TigerGraph queries and Graphistry with Jupyter notebook was challenging for me.
Accomplishments that we're proud of
Got to learn lot about TigerGraph, Graphistry and Plotly. Happy to submit application which is useful in real-world scenario.
What we learned
Got to learn lot about TigerGraph, Graphistry and Plotly.
What's next for TigerSupplyChainStream
Converting it into web application and increasing data size.
Built With
- graphistry
- pandas
- plotly
- python
- tigergraph


Log in or sign up for Devpost to join the conversation.