Why the butterflies in the Netherlands are disappearing
2025
For de Volkskrant
QGIS, Illustrator, Photoshop
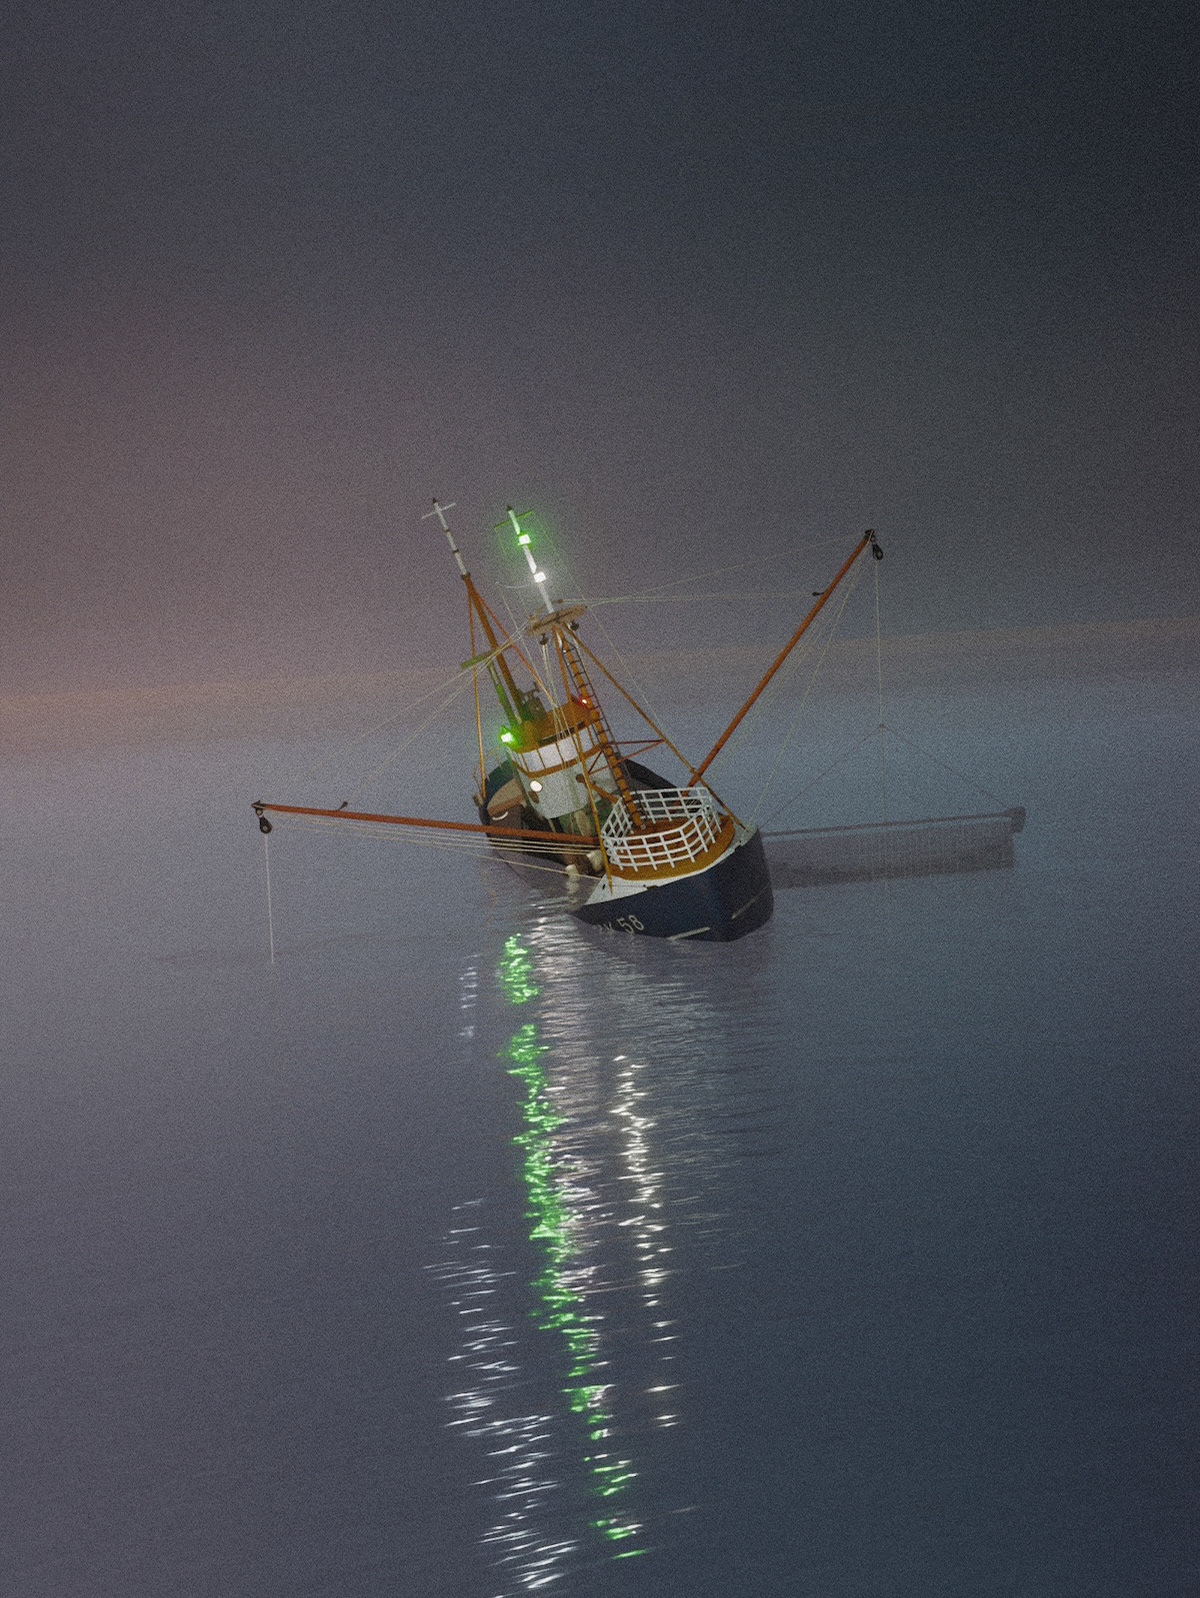
3D model of a sunken ship
2025
For de Volkskrant
Blender, QGIS, Illustrator, Photoshop
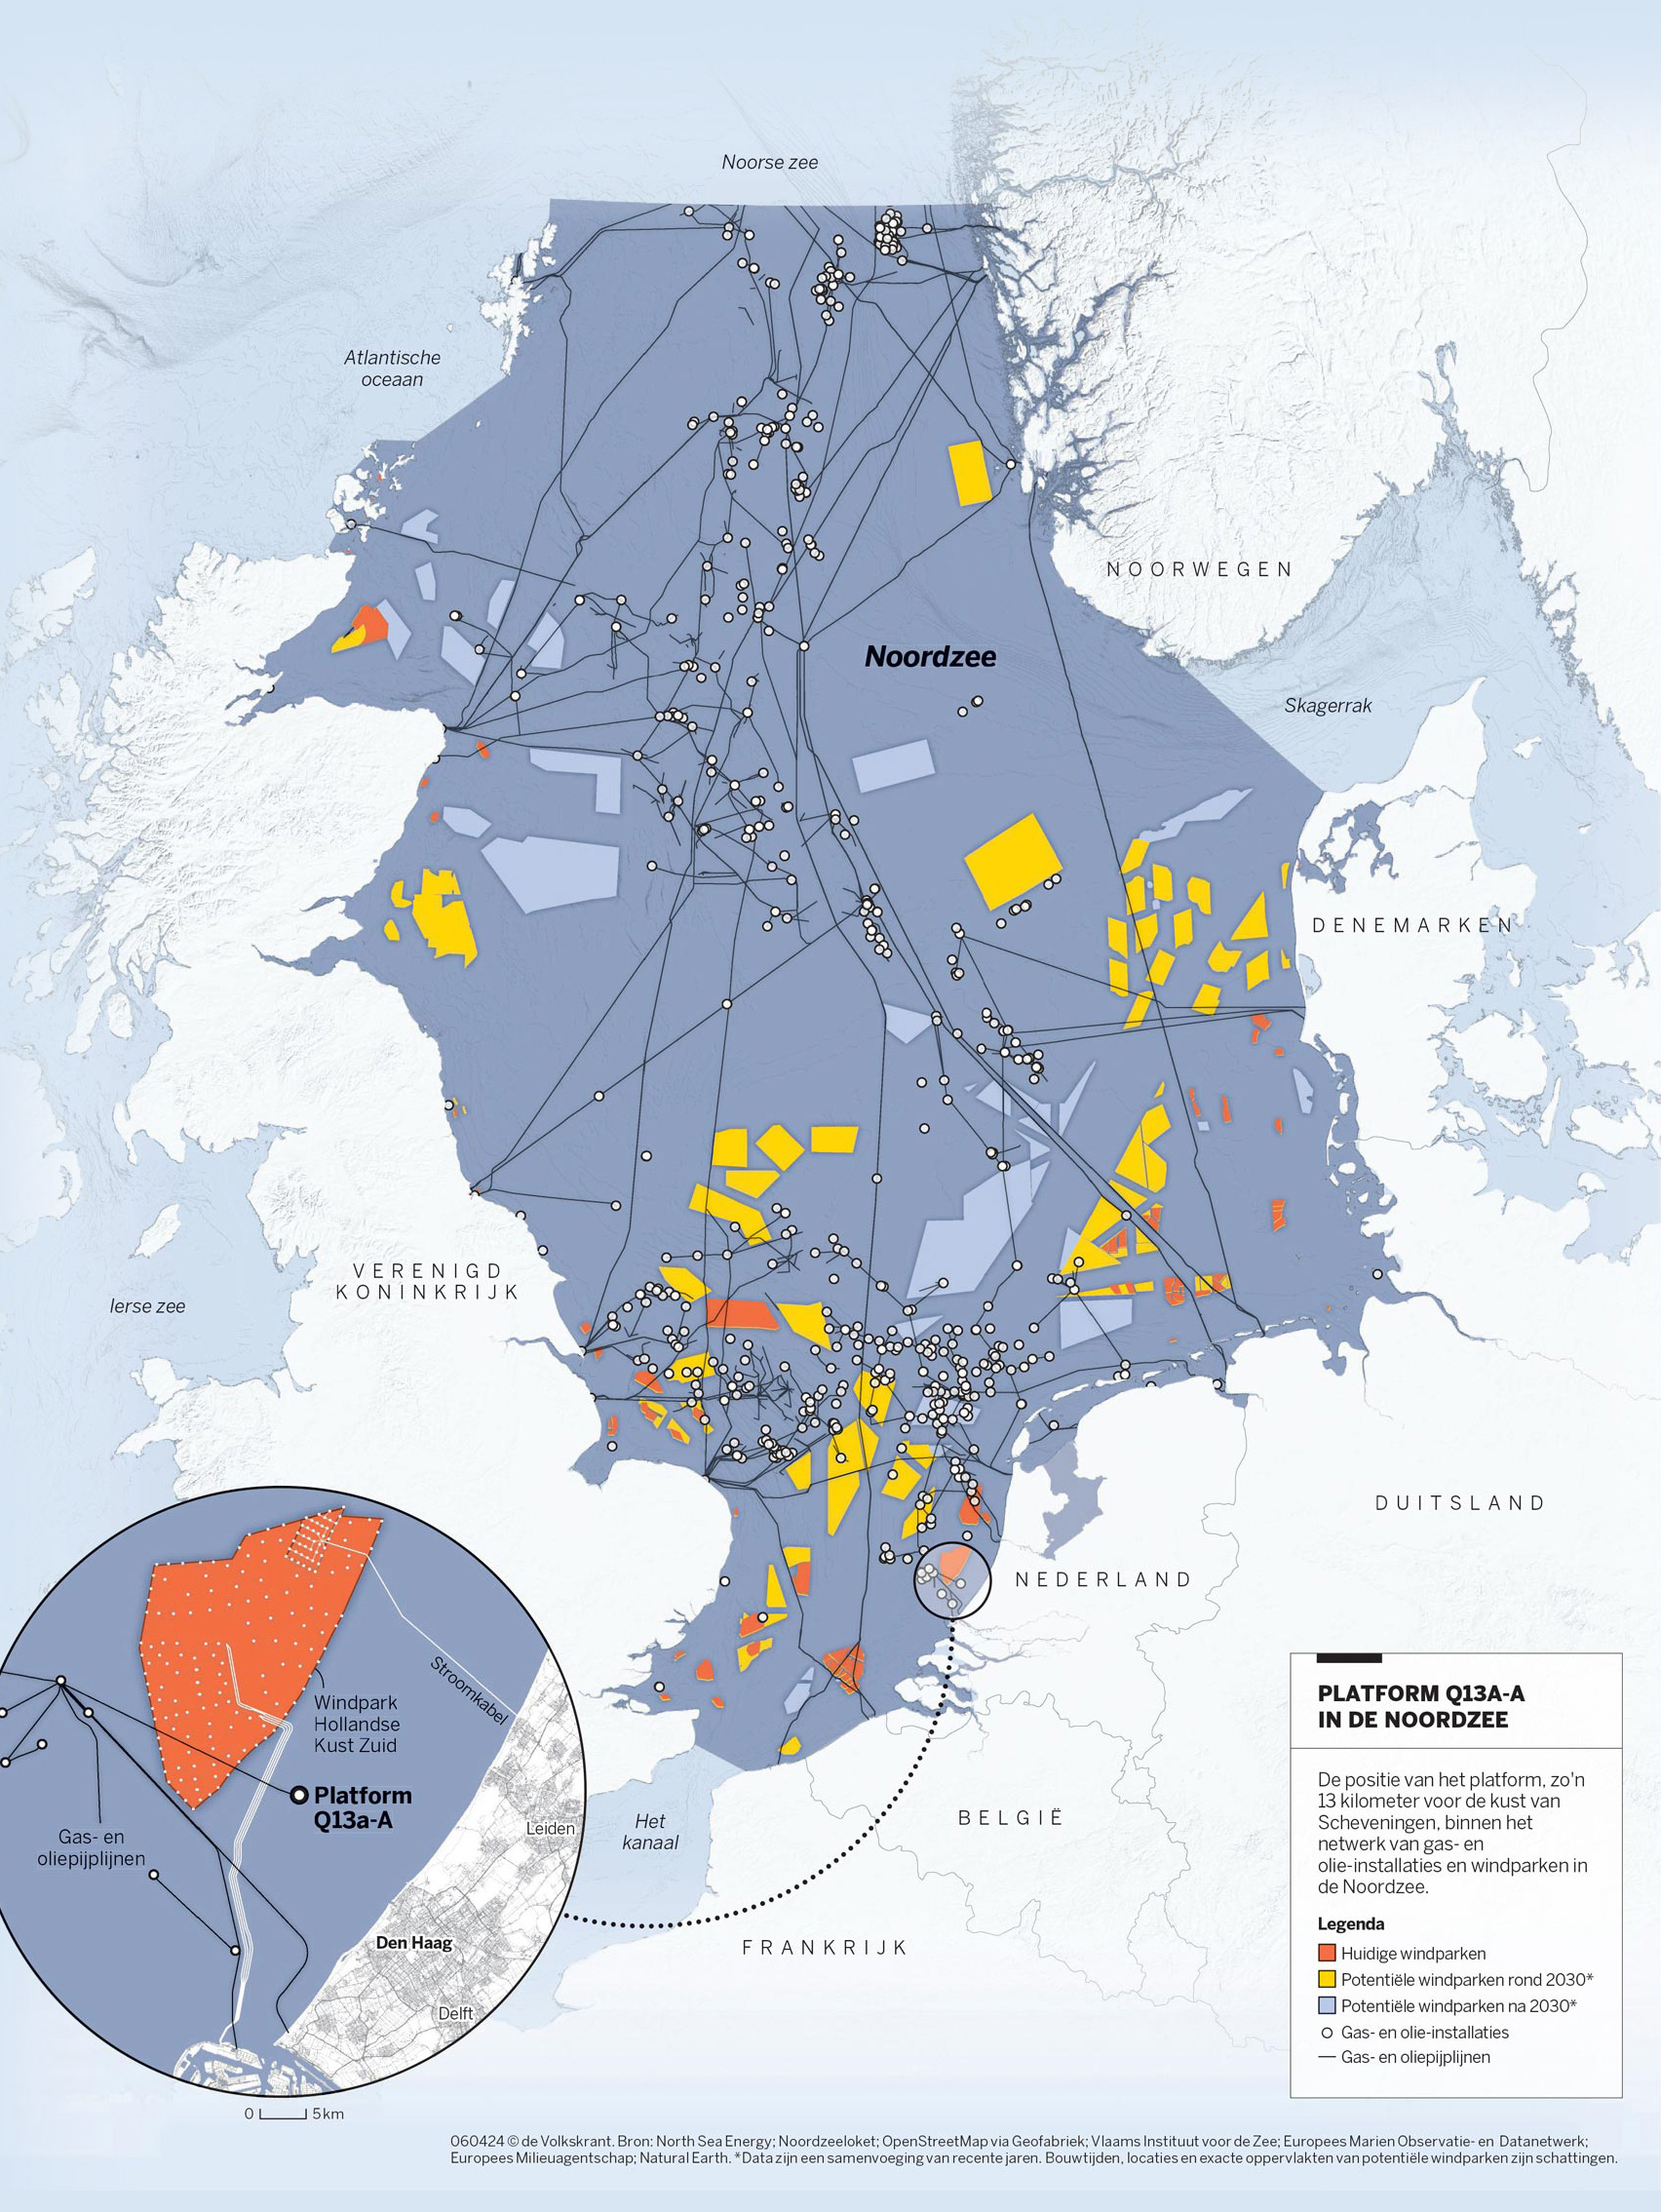
News Graphics for De Volkskrant
2024
Infographics and diagrams for De Volkskrant, a Dutch national newspaper
QGIS • Illustrator • Javascript
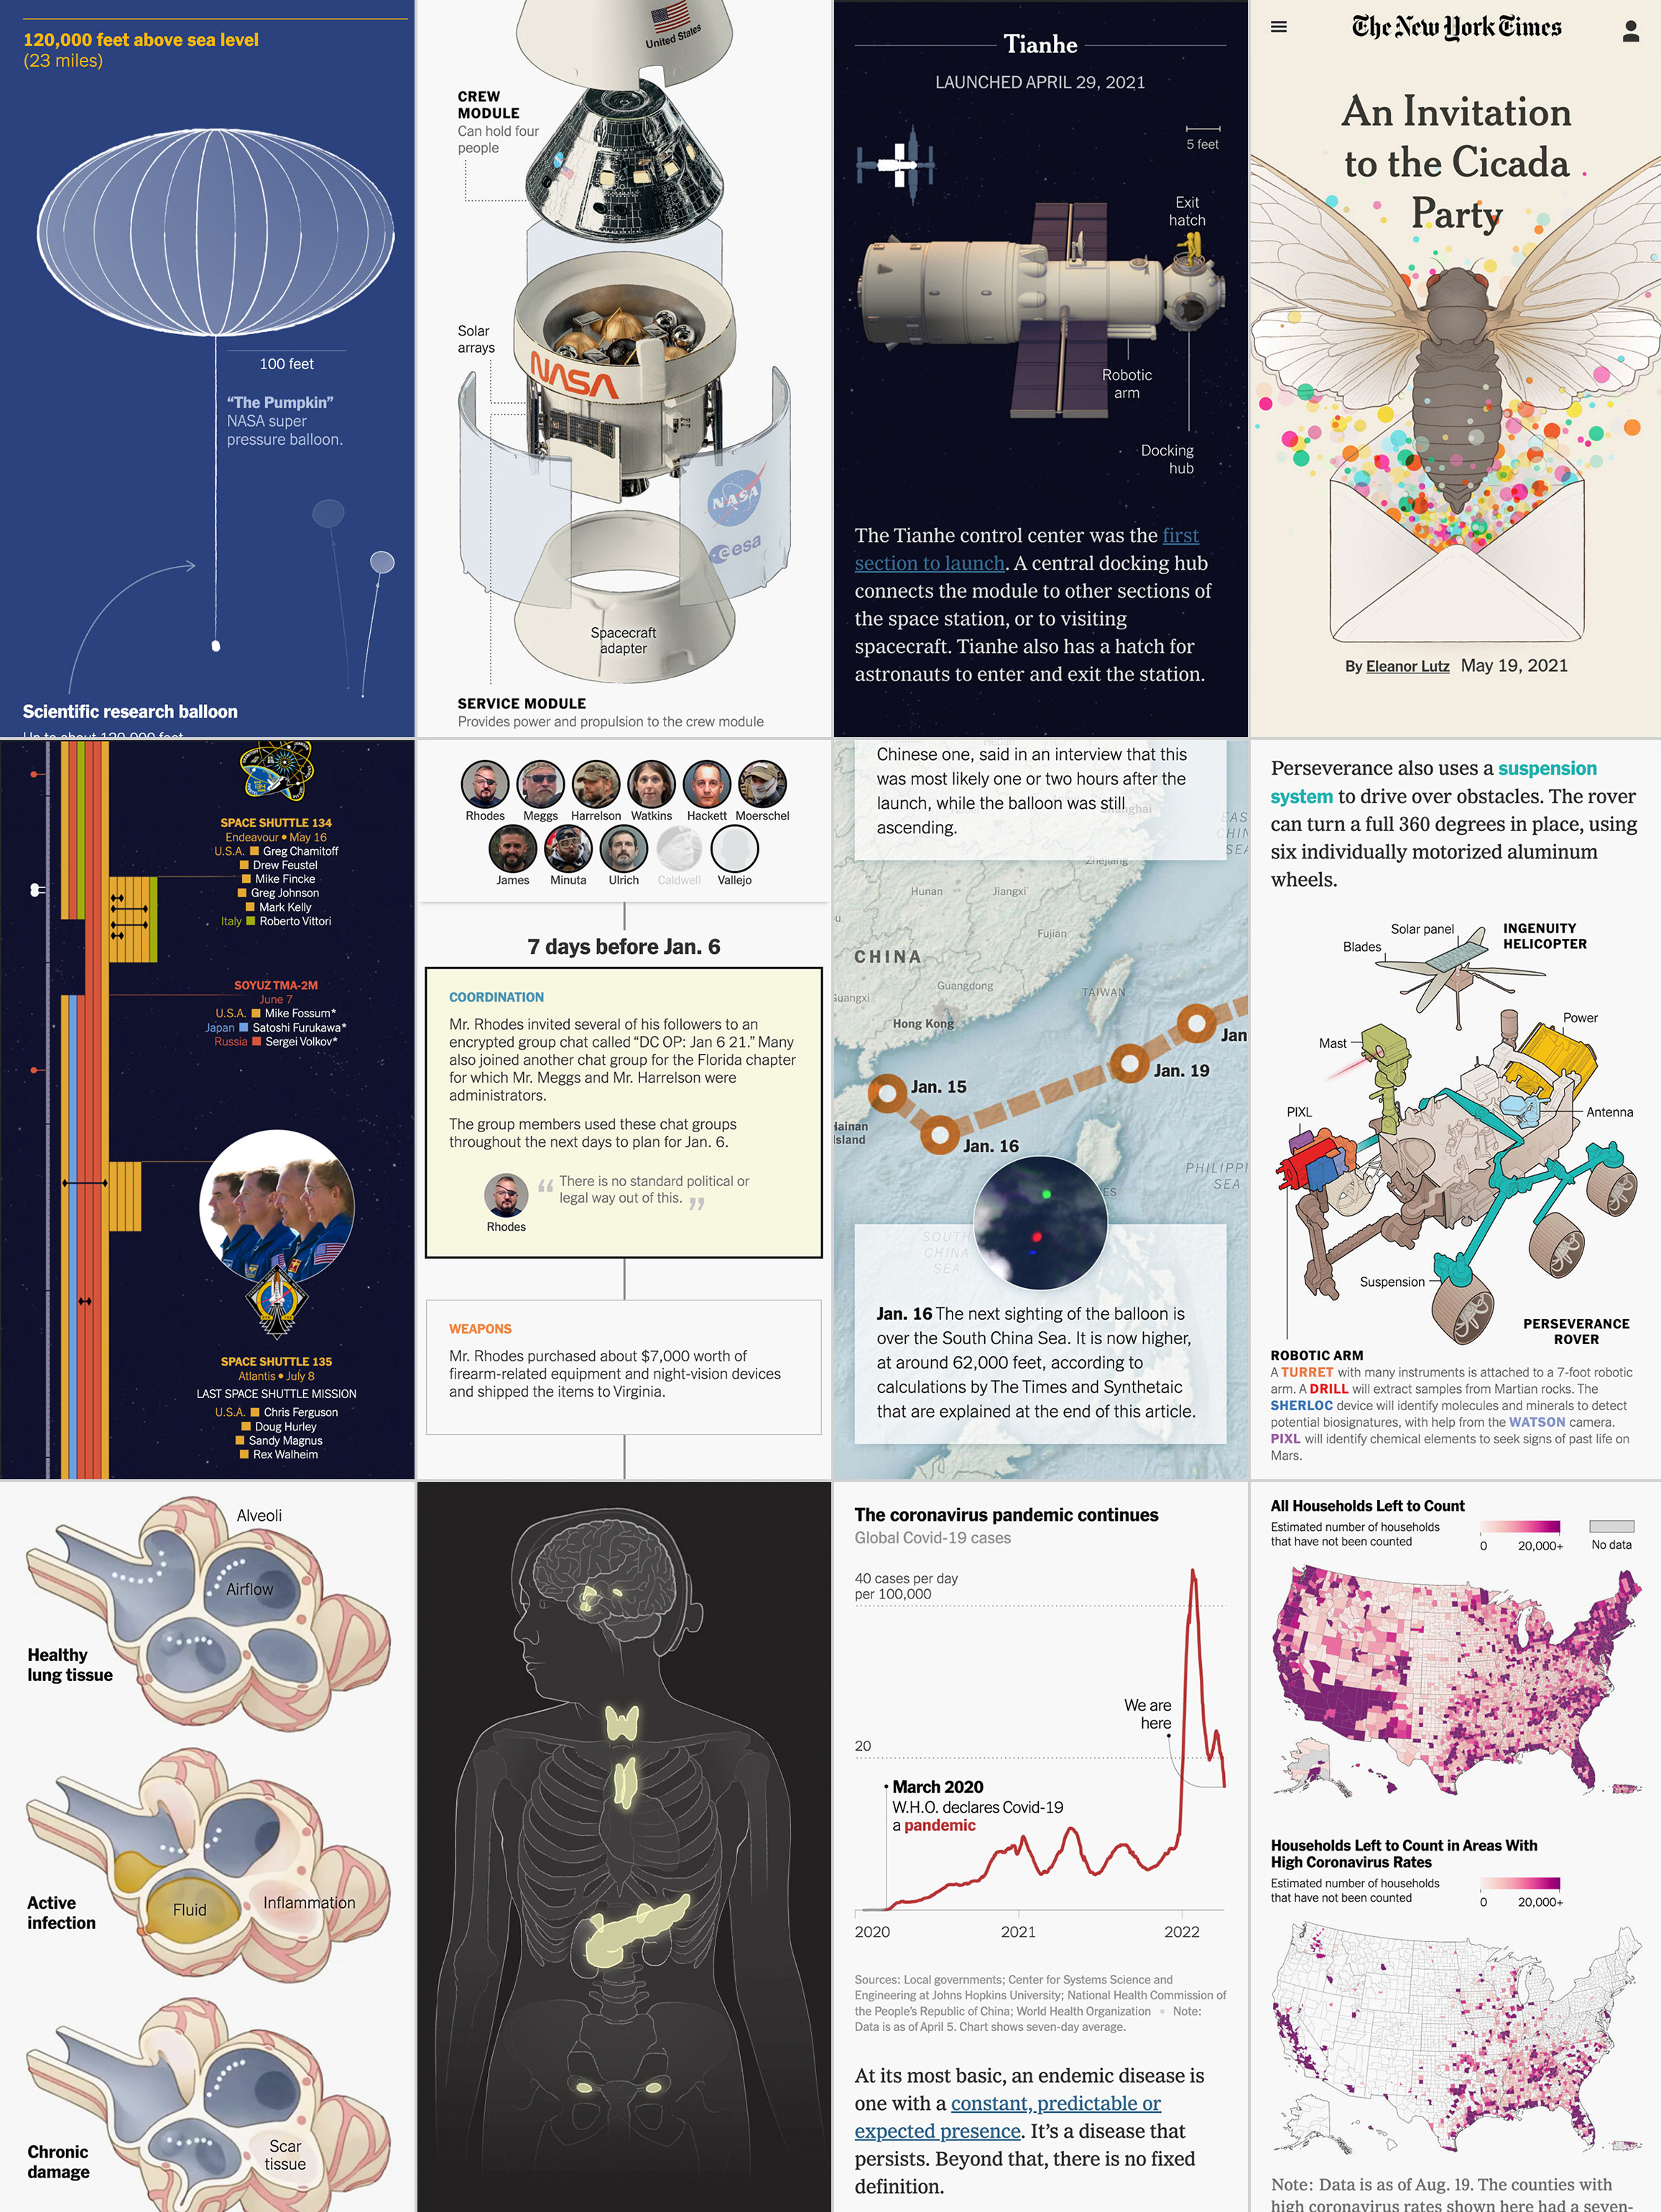
Mobile News Design for The New York Times
2023
Infographics and diagrams for The New York Times, with an emphasis on mobile-friendly graphics.
Python • Illustrator • Svelte • Javascript
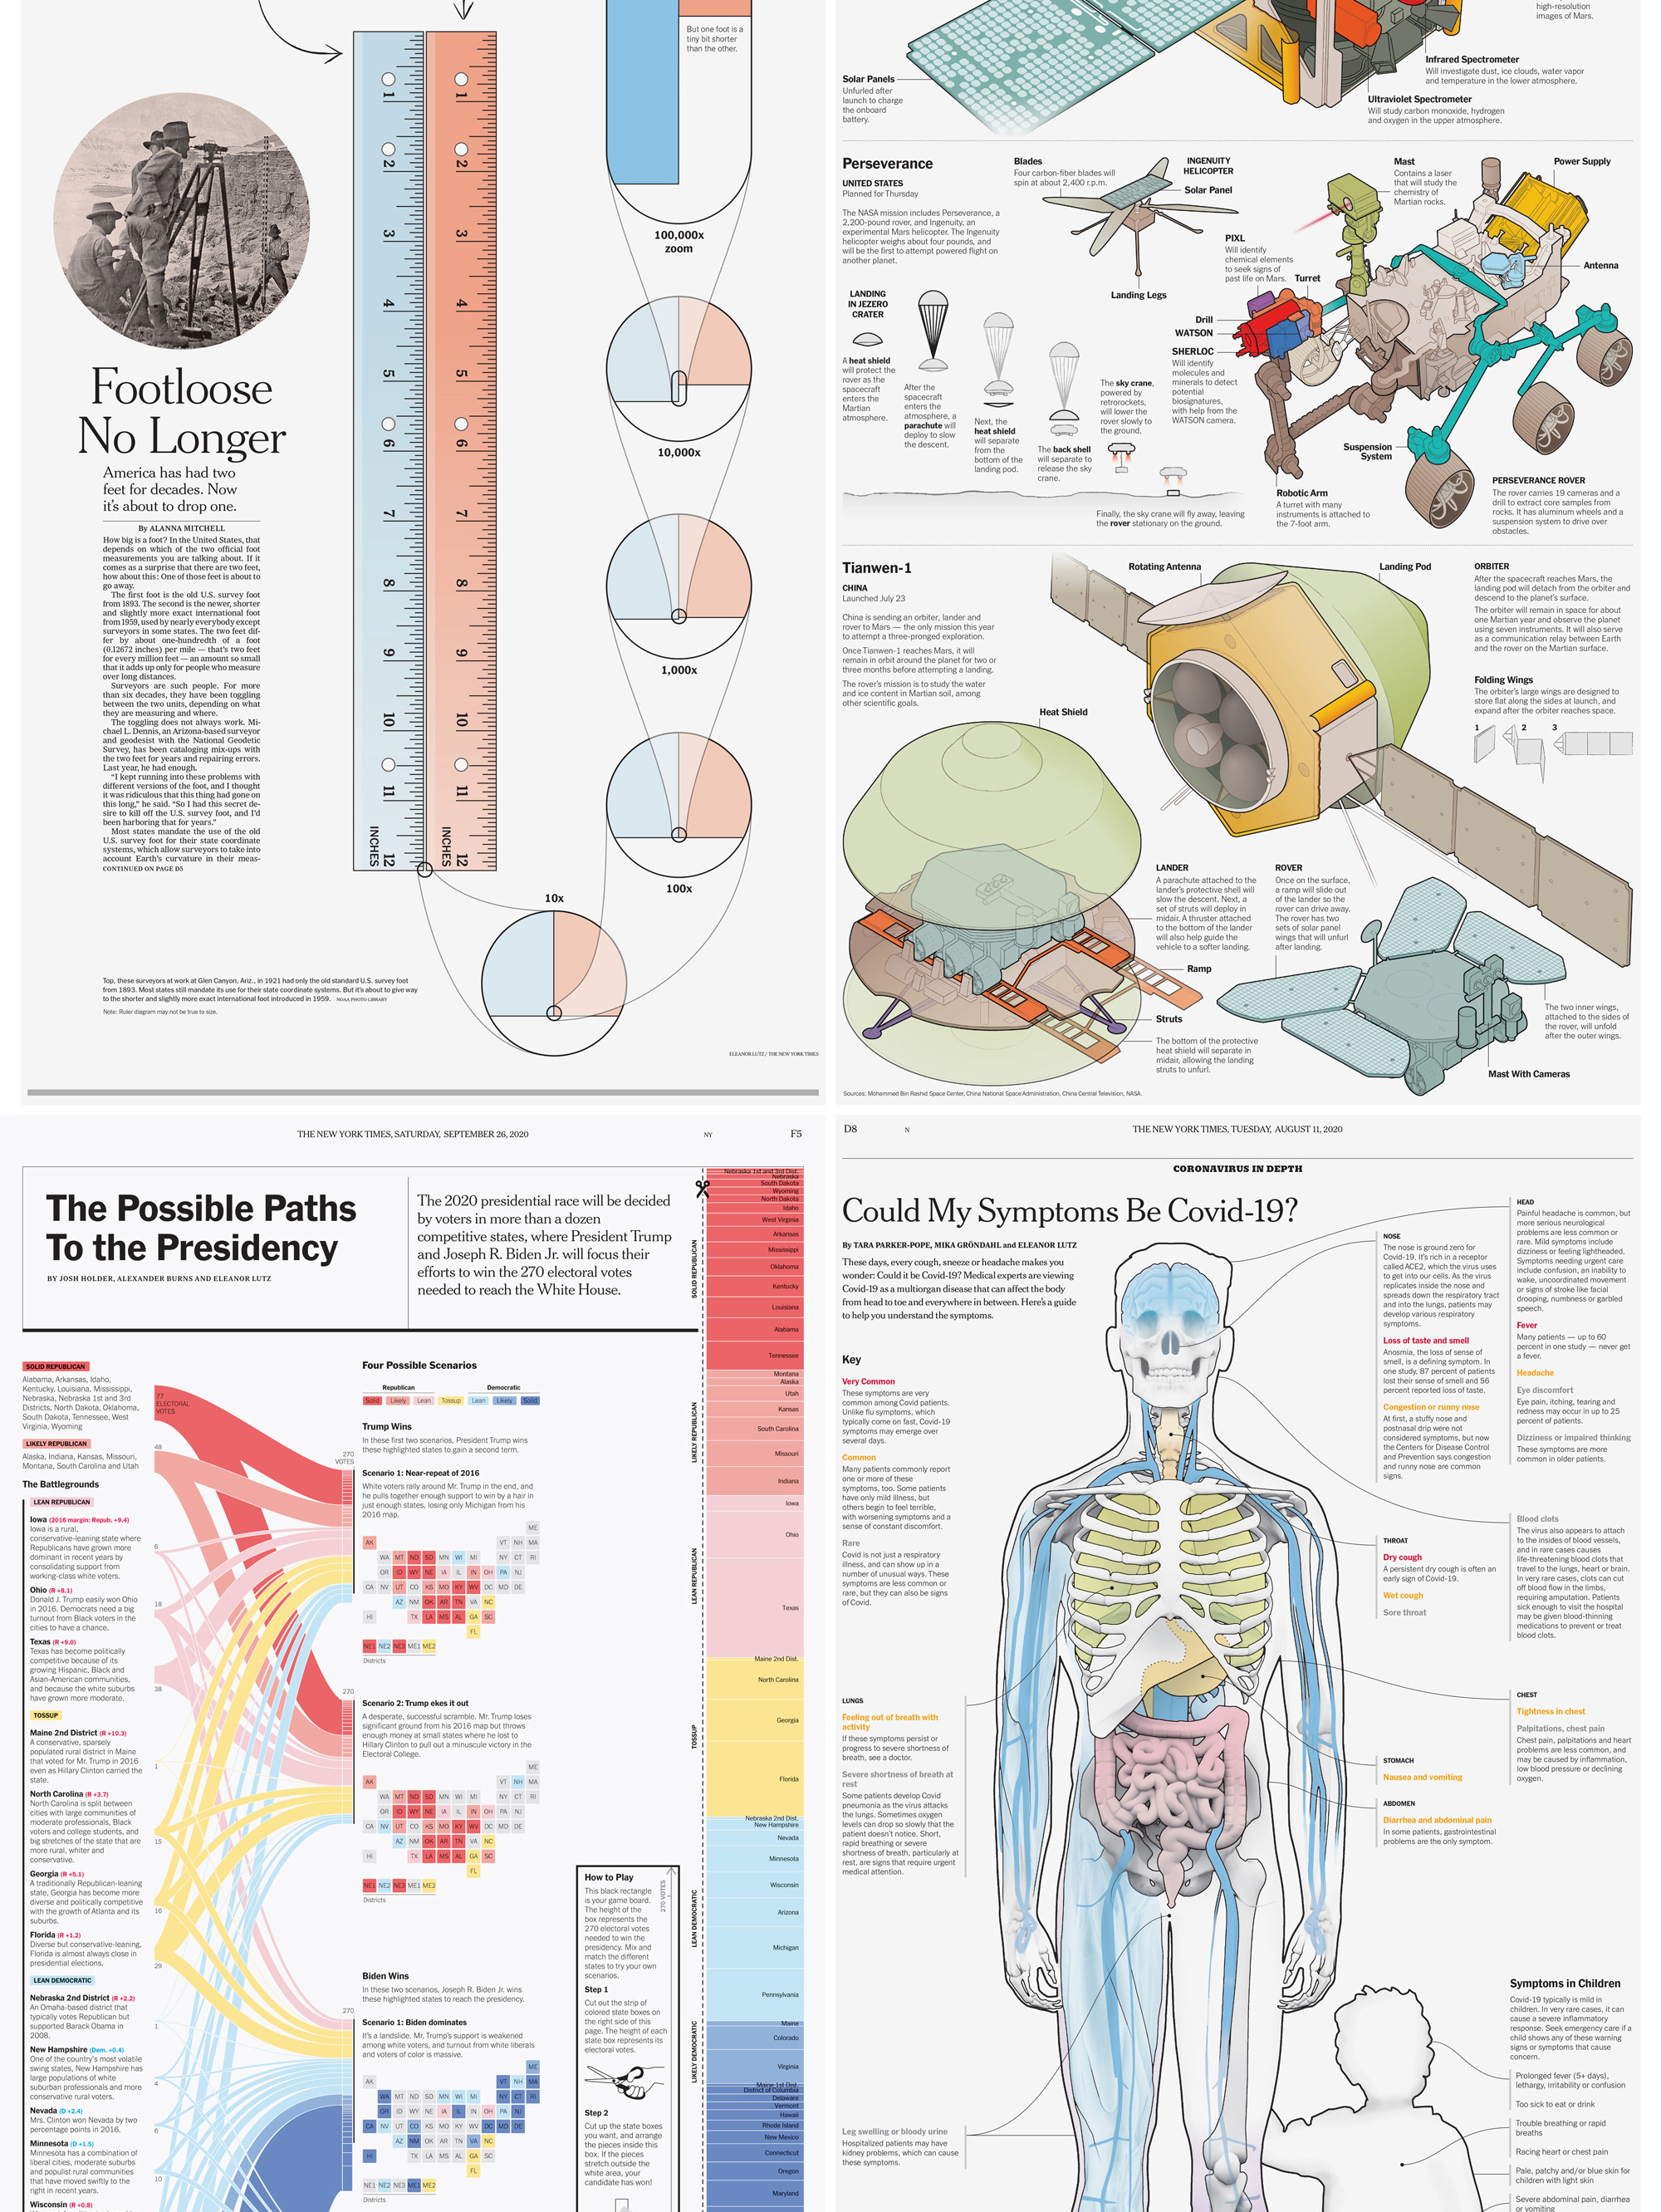
Print Design for The New York Times
2023
Infographics and diagrams for The New York Times, print edition
Python • Illustrator • Photoshop
Data Trackers for The New York Times
2022
Automated data dashboards developed for The New York Times
Python • AWS • Javascript
The Seasons of Earth
2019
An animated map of the ebb and flow of ice sheets throughout the year.
Python • Illustrator • Photoshop
Data: NASA • Natural Earth
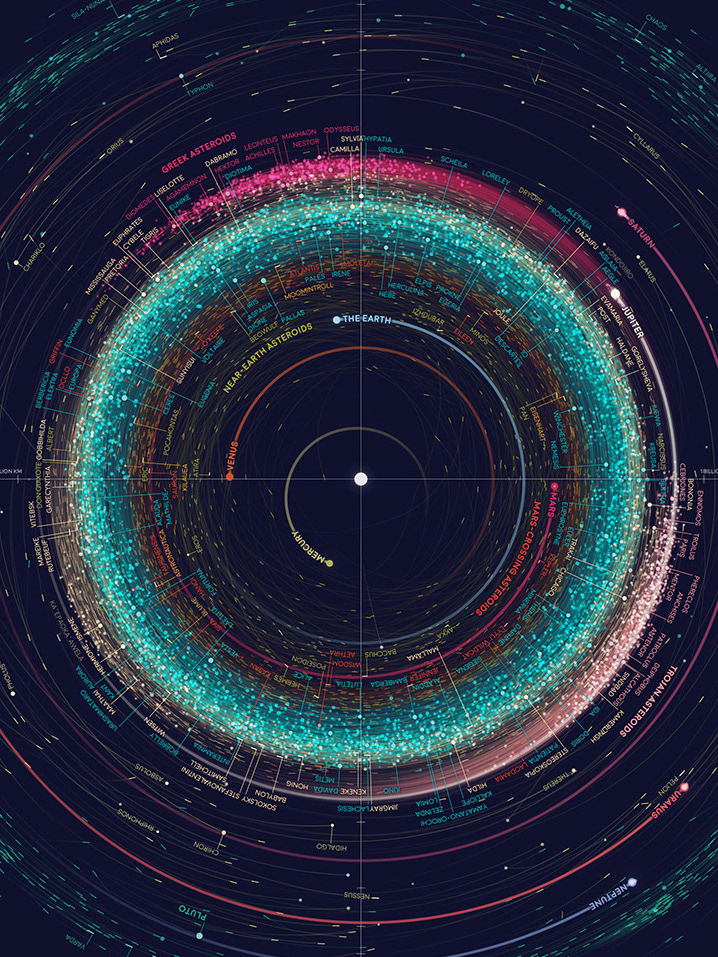
An Orbit Map of the Solar System
2019
A map visualizing the orbit paths of 18,000 asteroids in the solar system.
Python • Illustrator • Photoshop
Data: NASA • JPL • CalTech
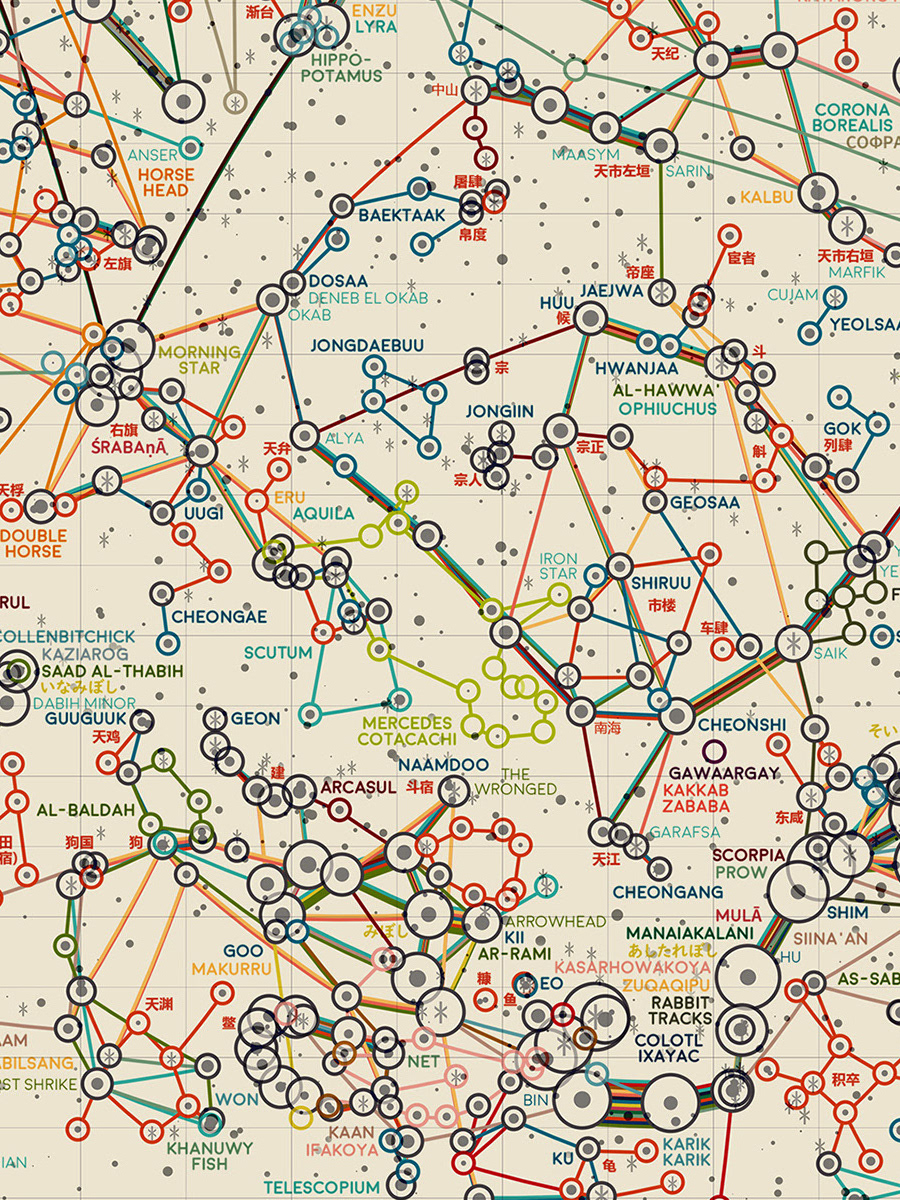
World of Constellations
2019
A map of constellations from more than 30 cultures from around the world.
Python • Illustrator • Photoshop
Data: HYG Database • Stellarium
Virus Trading Cards
2016
Animated trading cards showing the molecular structure of different viruses.
UCSF Chimera • Photoshop
Data: Worldwide Protein Data Bank
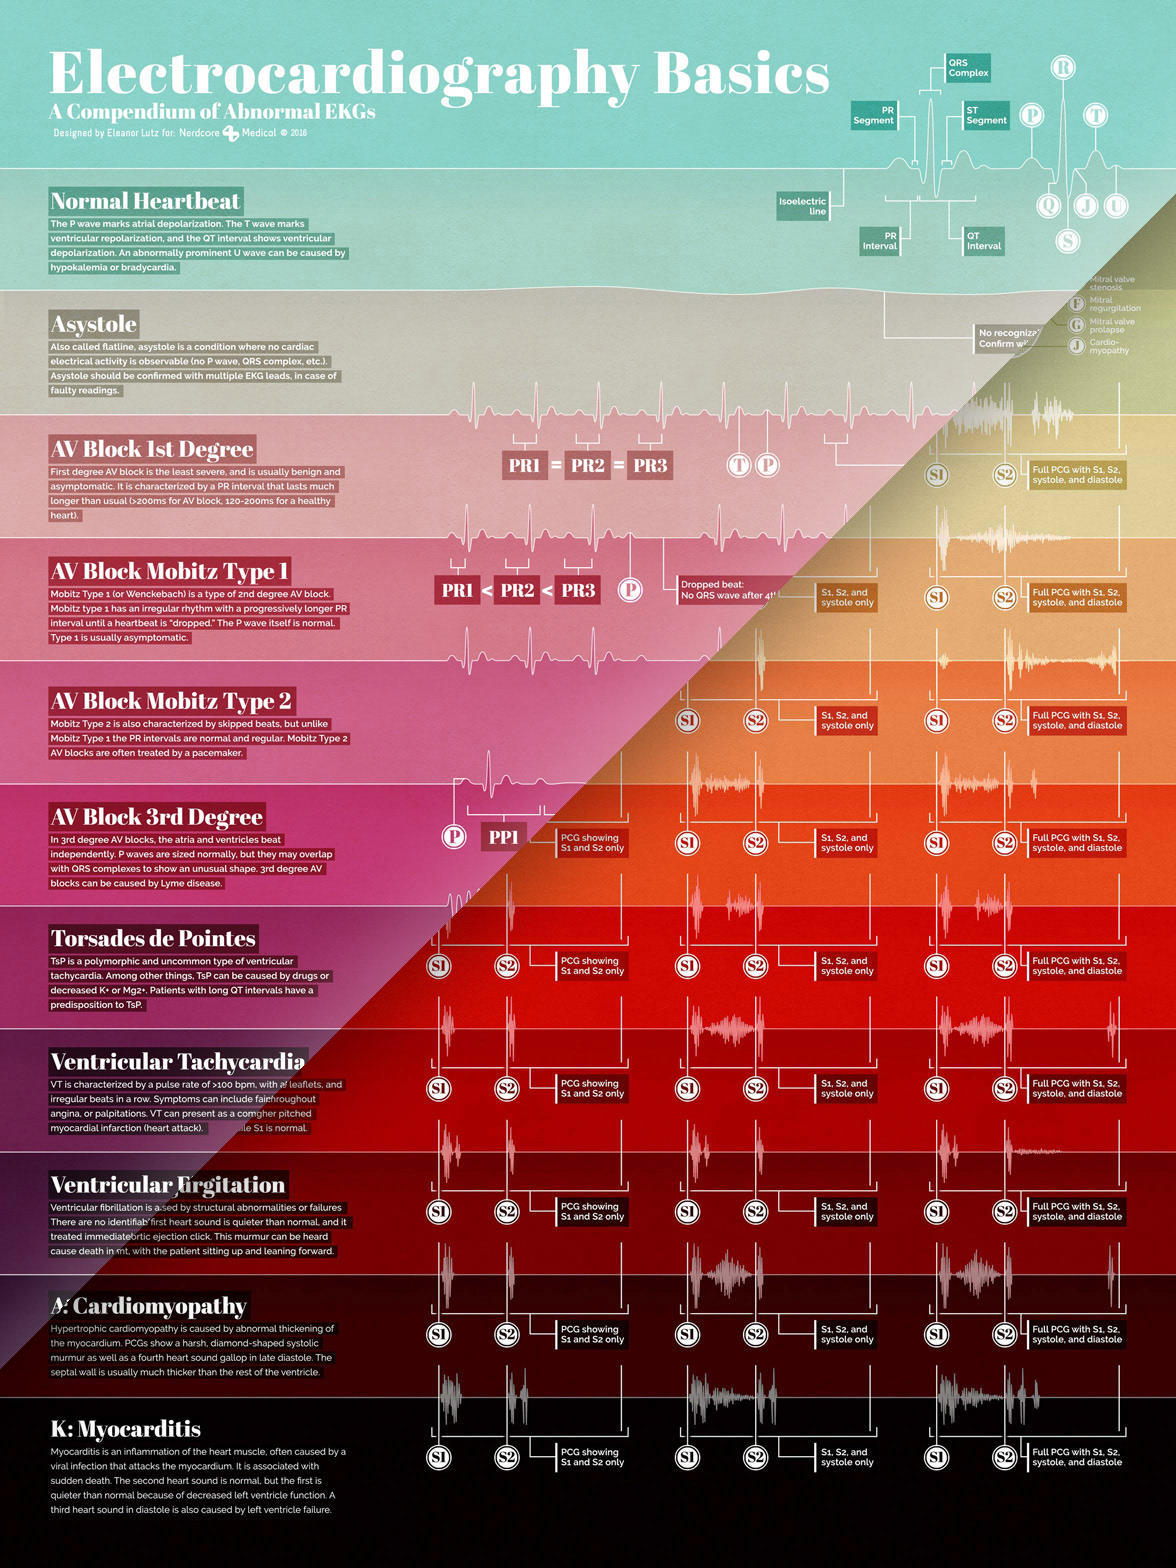
Waveform Visualizations
2016
Visualizing EKG and ECG waveform data for medical students.
Photoshop • Illustrator
Client: Nerdcore Medical
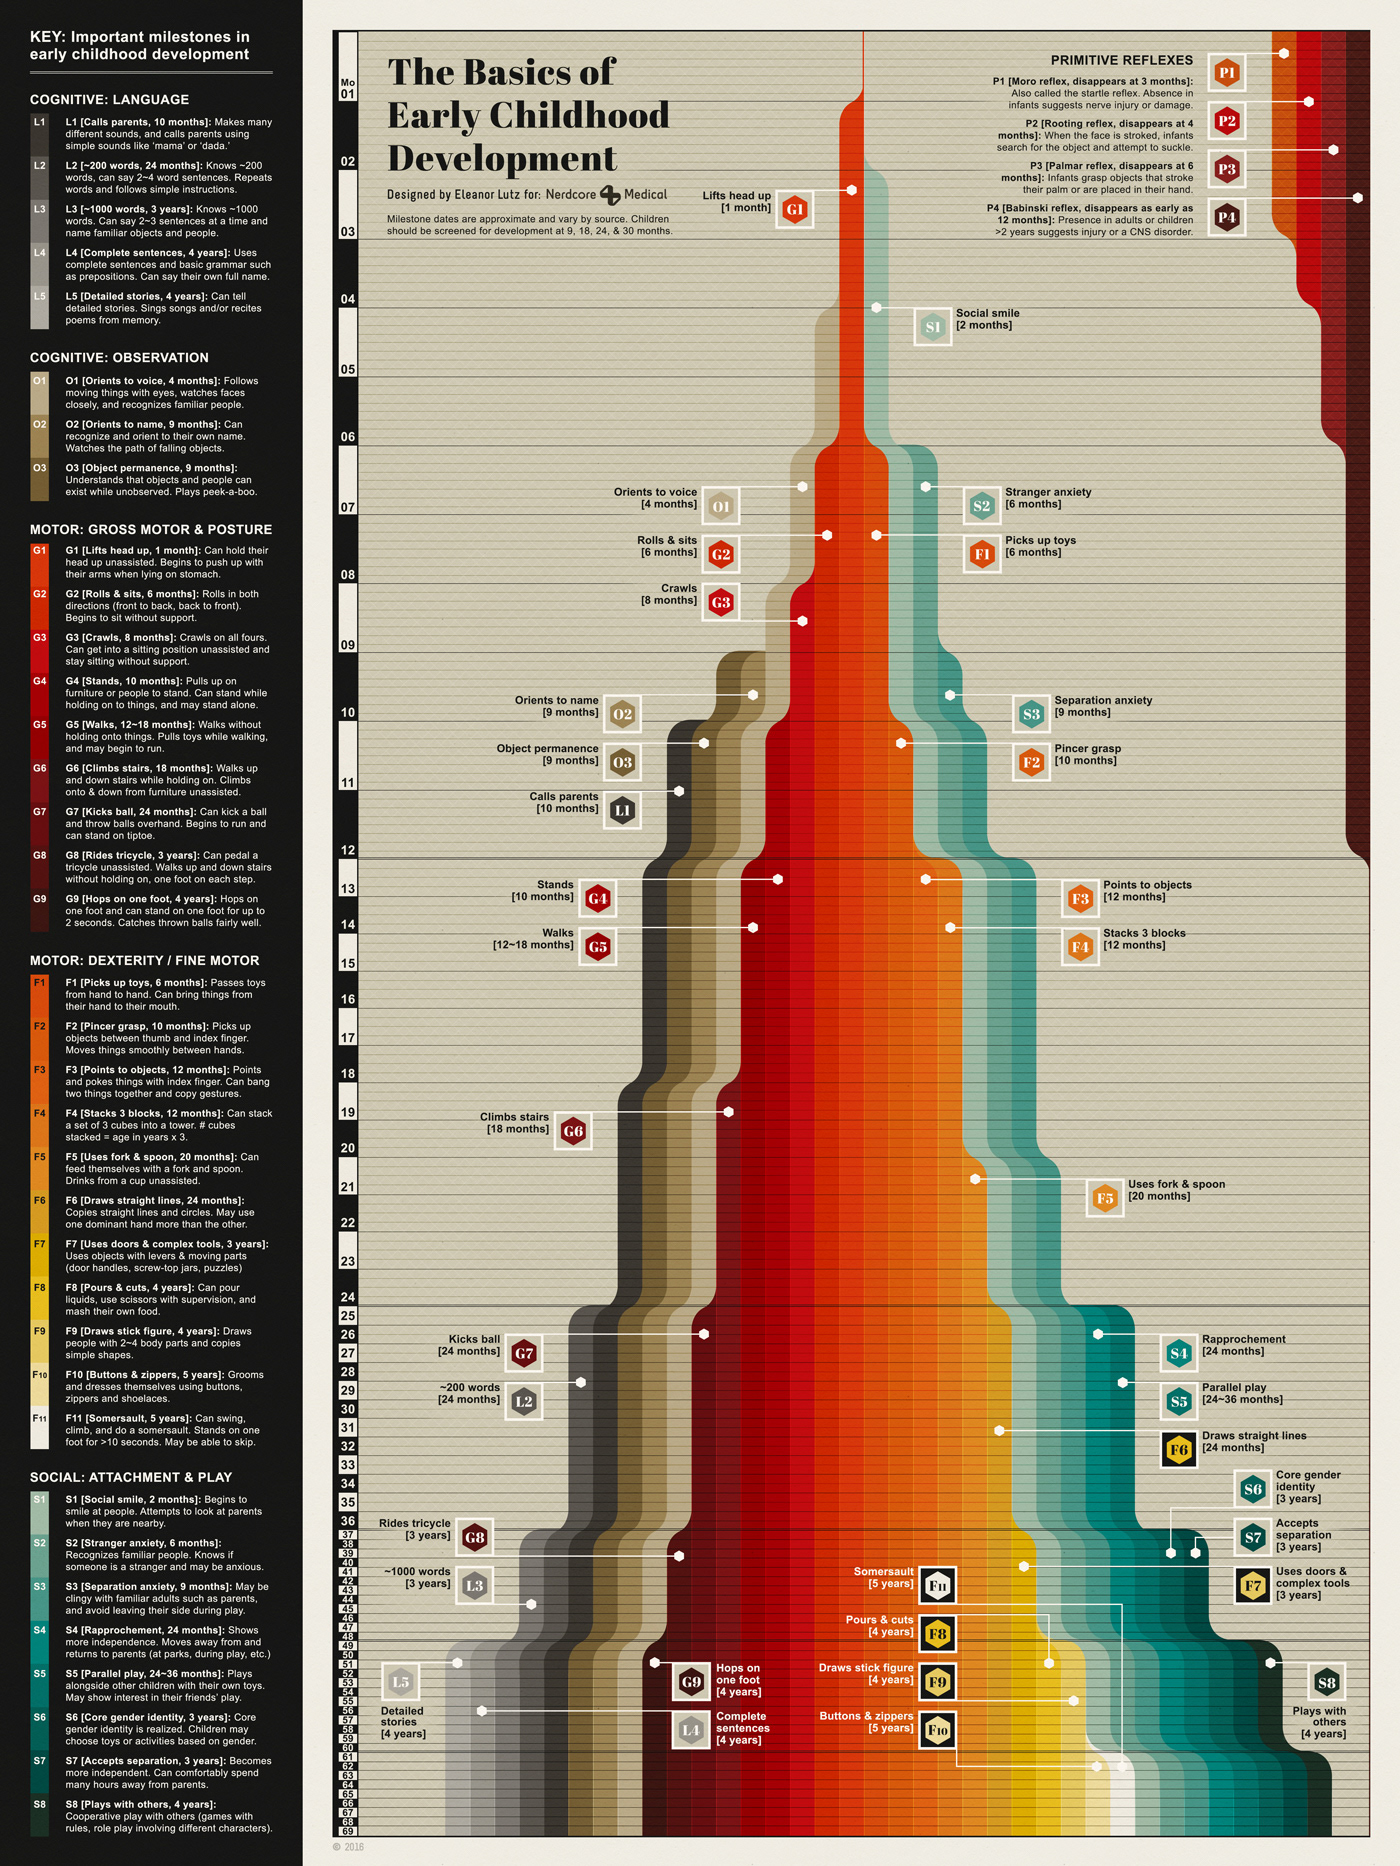
Waterfall Timeline
2016
A timeline of child development inspired by waterfalls and streamgraphs.
Photoshop
Client: Nerdcore Medical
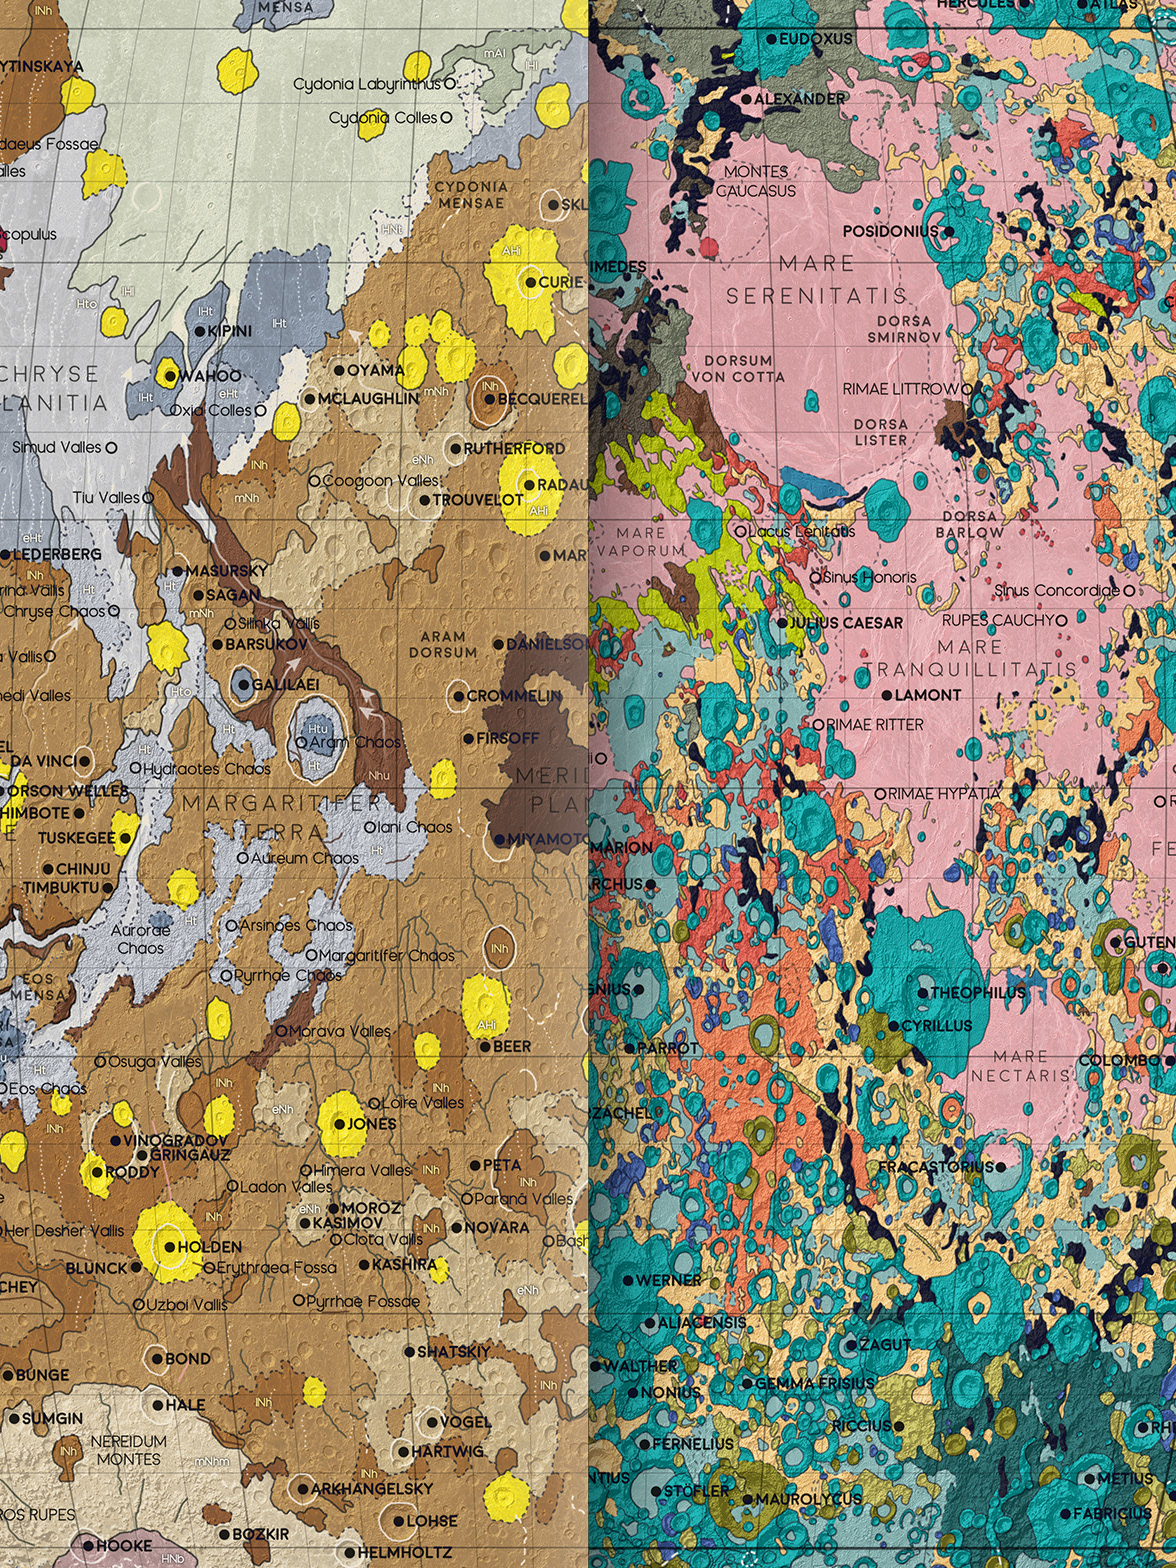
Geologic Maps of Space
2019
Labeled geologic maps featuring the Mars and the Moon.
Python • GDAL • Illustrator • Photoshop
Data: USGS • IAU • NASA
Butterfly Identification Chart
2014
An animated infographic visualizing 42 butterfly species.
Photoshop

Visualizing Fire Ecology
2017
Using paper and fire sculptures to explain fire ecology to the general public.
Paper • Fire • Photoshop
Collaboration with Wired
Animated Science Infographics
2014
Animated infographics explaining breathing, flight, and muscle movement.
Photoshop
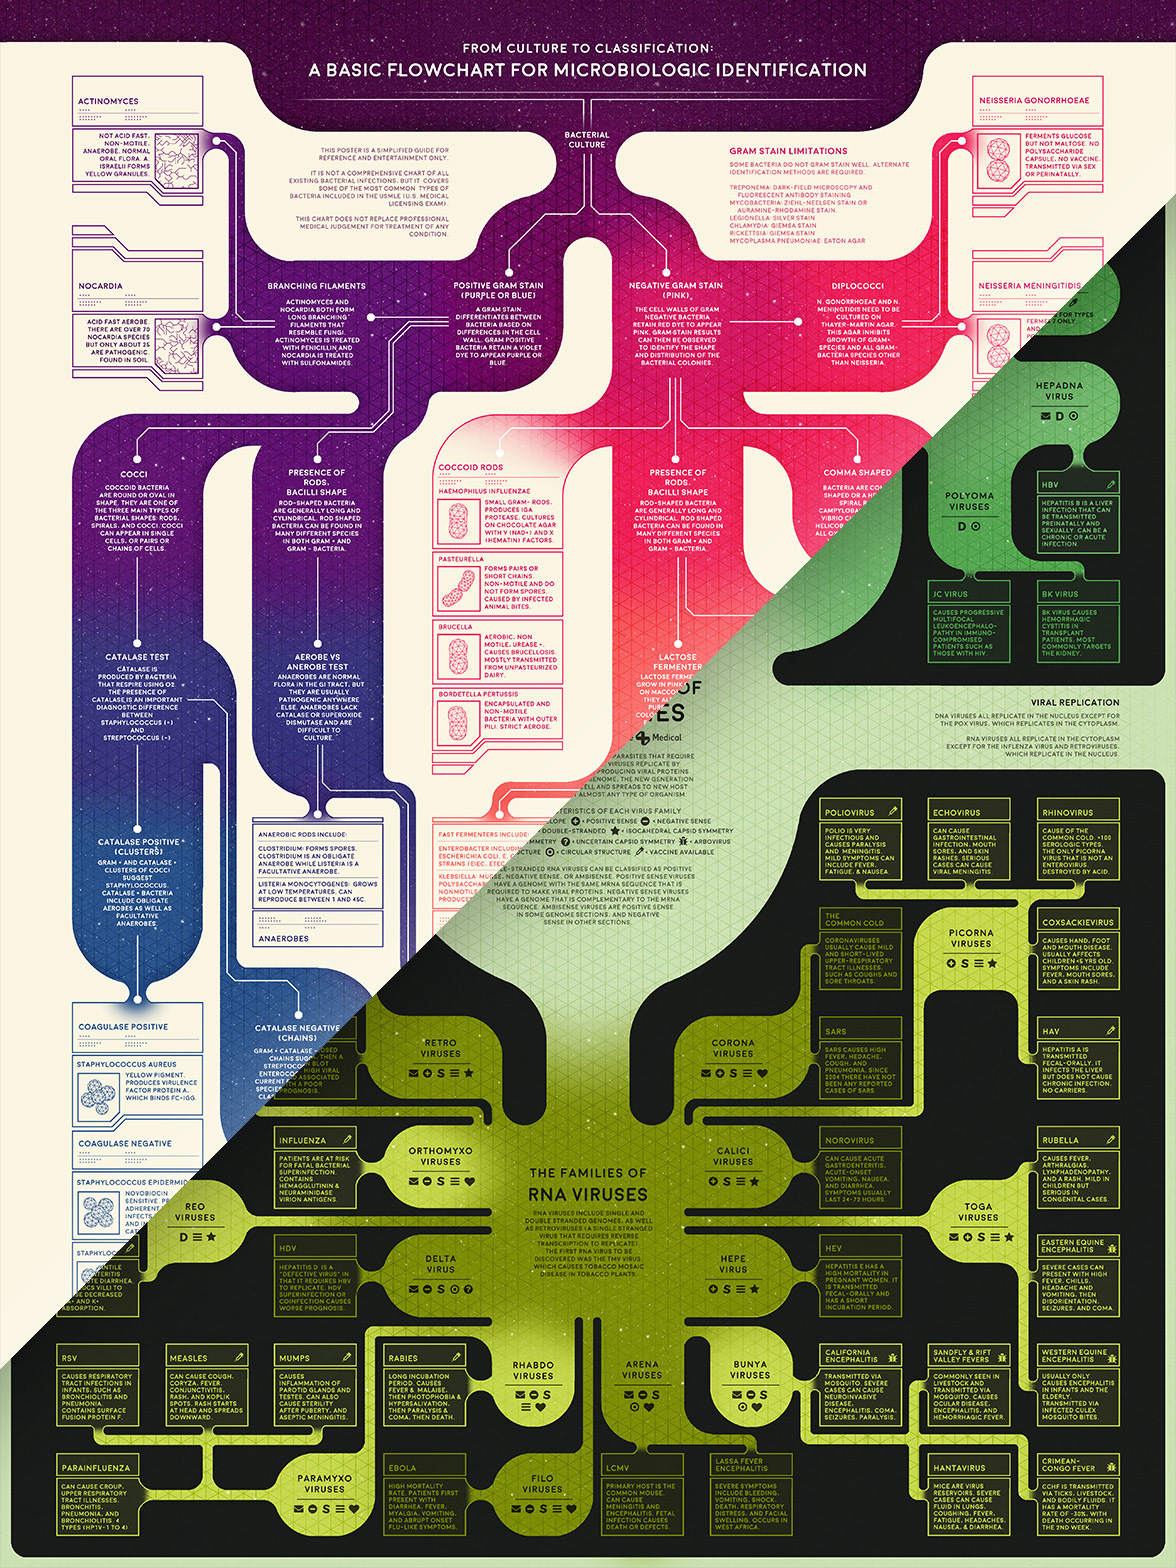
Flowchart Design
2016
Flowchart diagrams explaining viruses and bacteria for medical students.
Photoshop
Client: Nerdcore Medical
Automating Color Design
2019
An algorithm that automatically generates color schemes and digital sketches.
Python
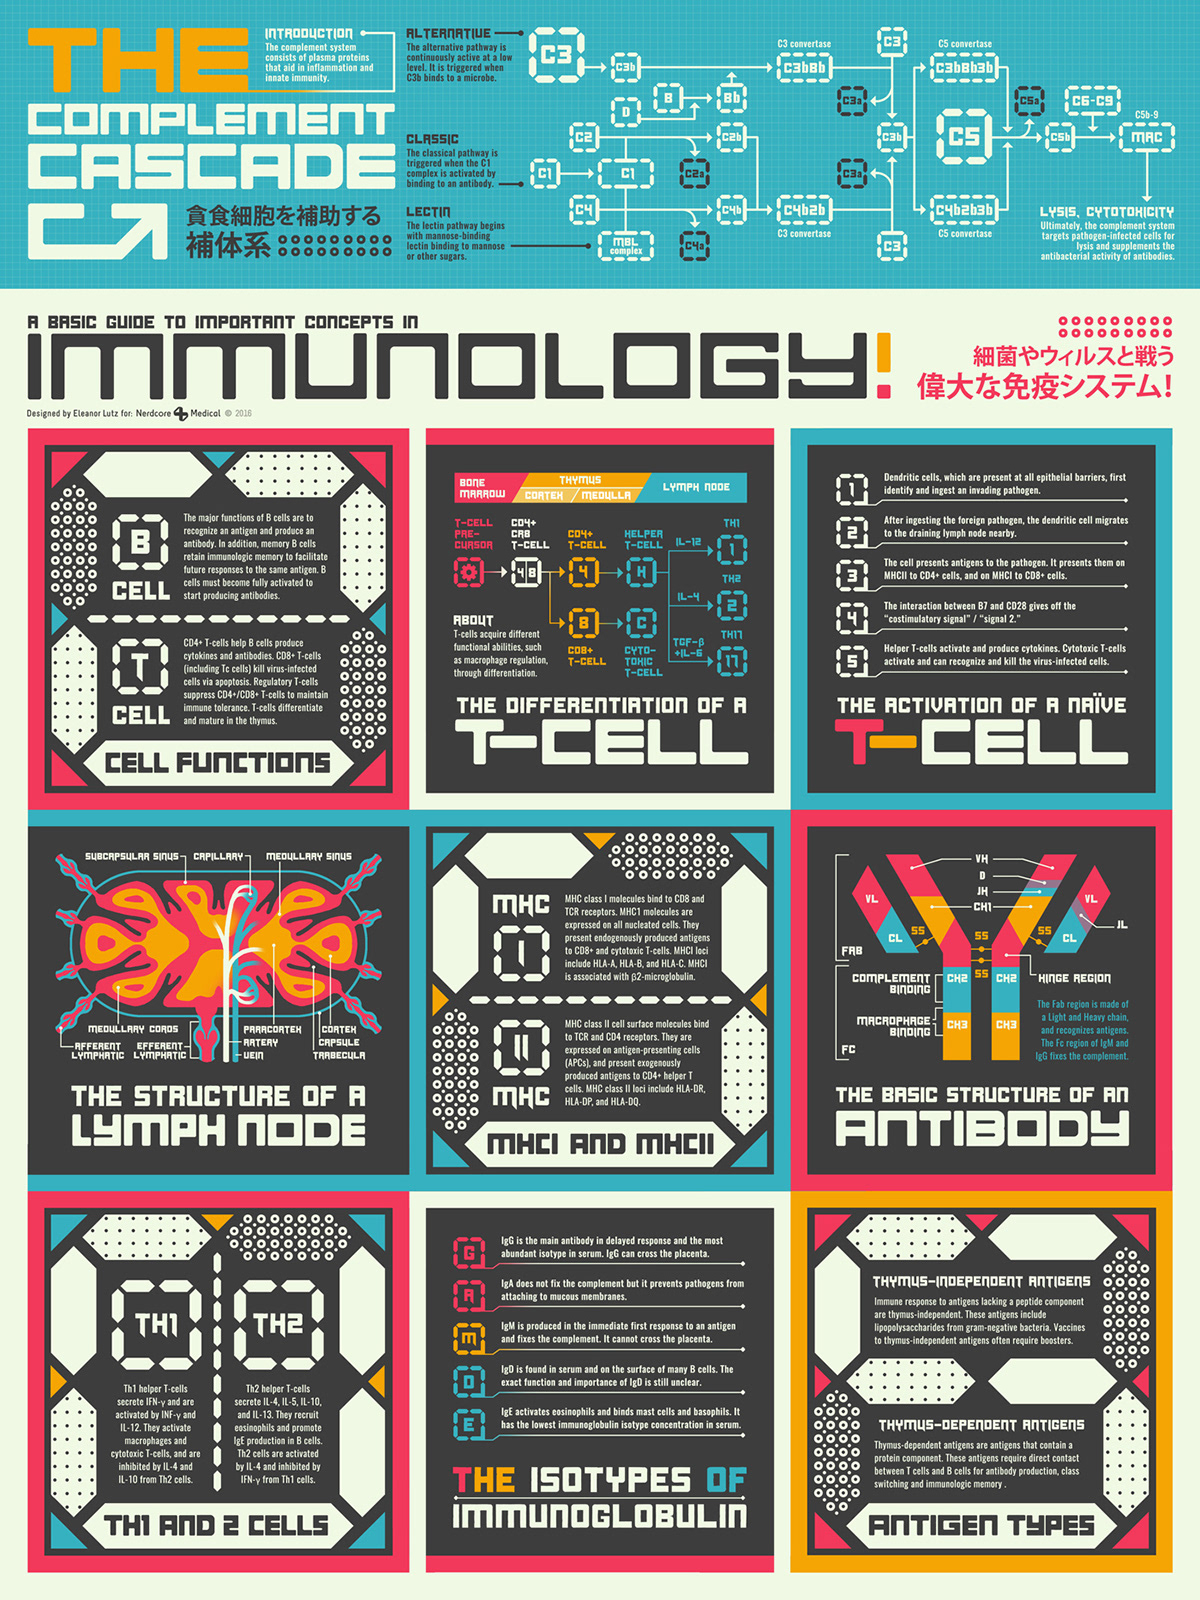
Stylized Science
2016
An infographic for medical students inspired by retro pop art.
Photoshop
Client: Nerdcore Medical
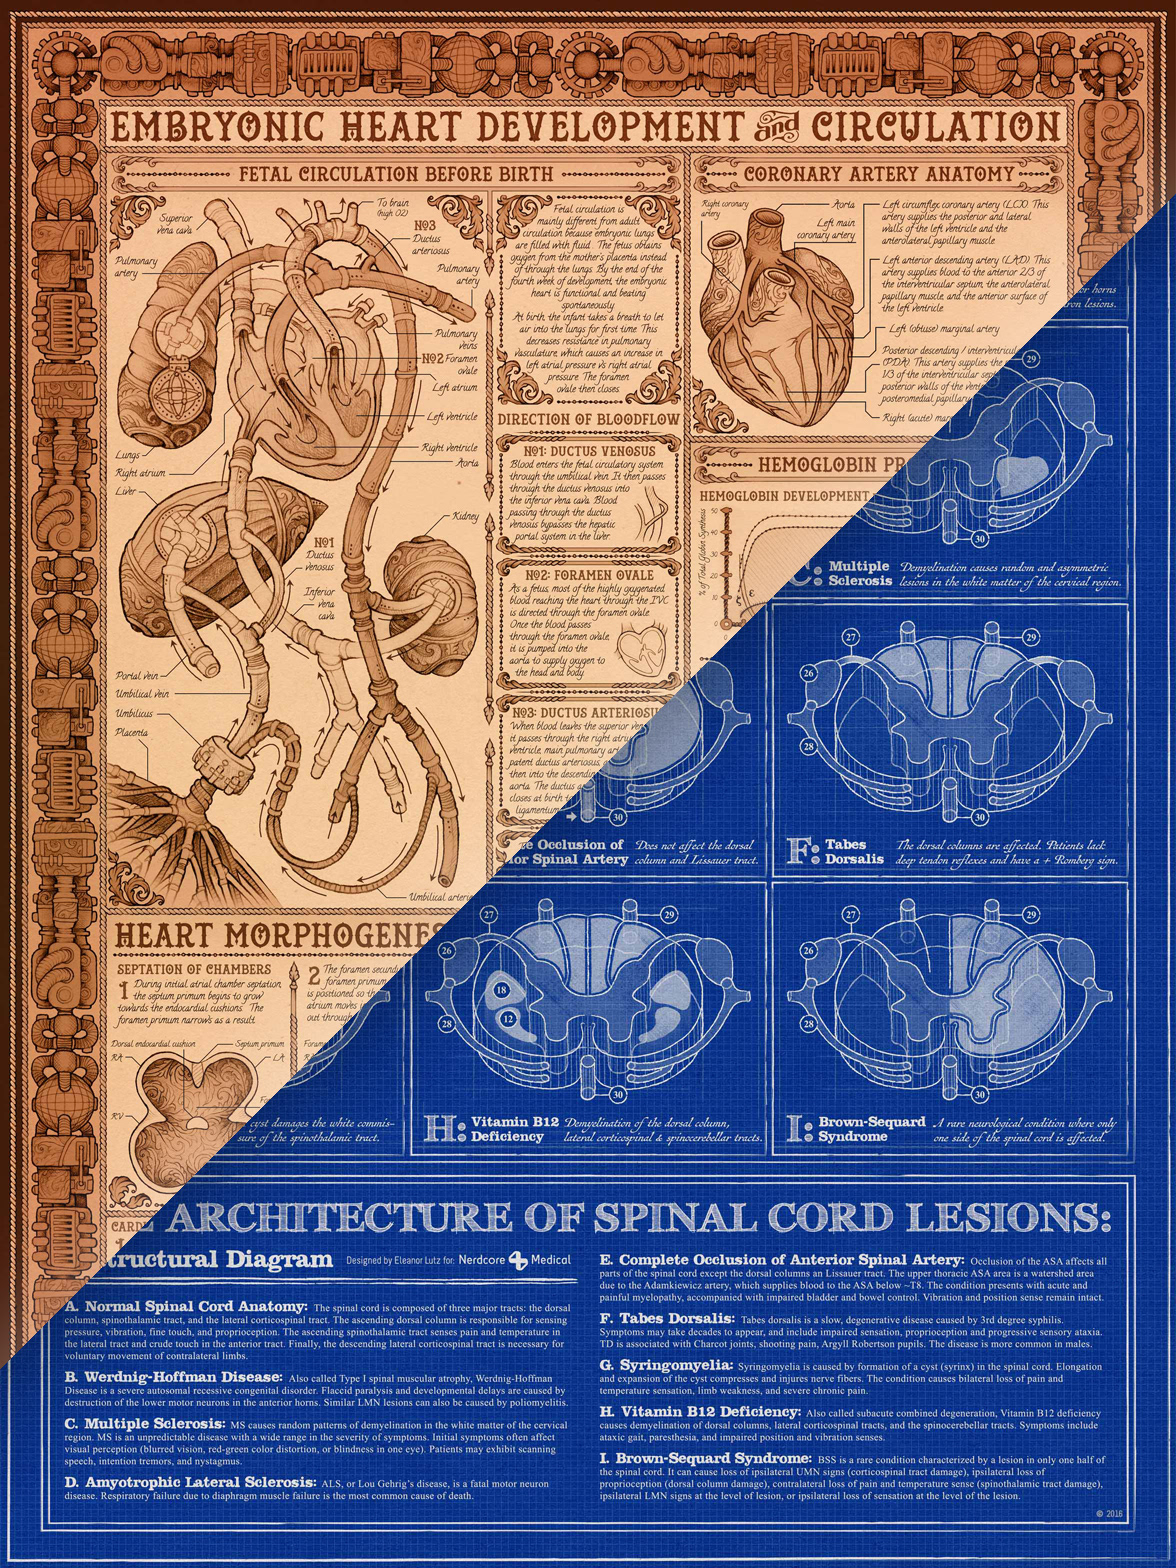
Monochromatic Design
2016
Anatomy infographics designed in monochromatic design styles.
Graphite • Illustrator • Photoshop
Client: Nerdcore Medical
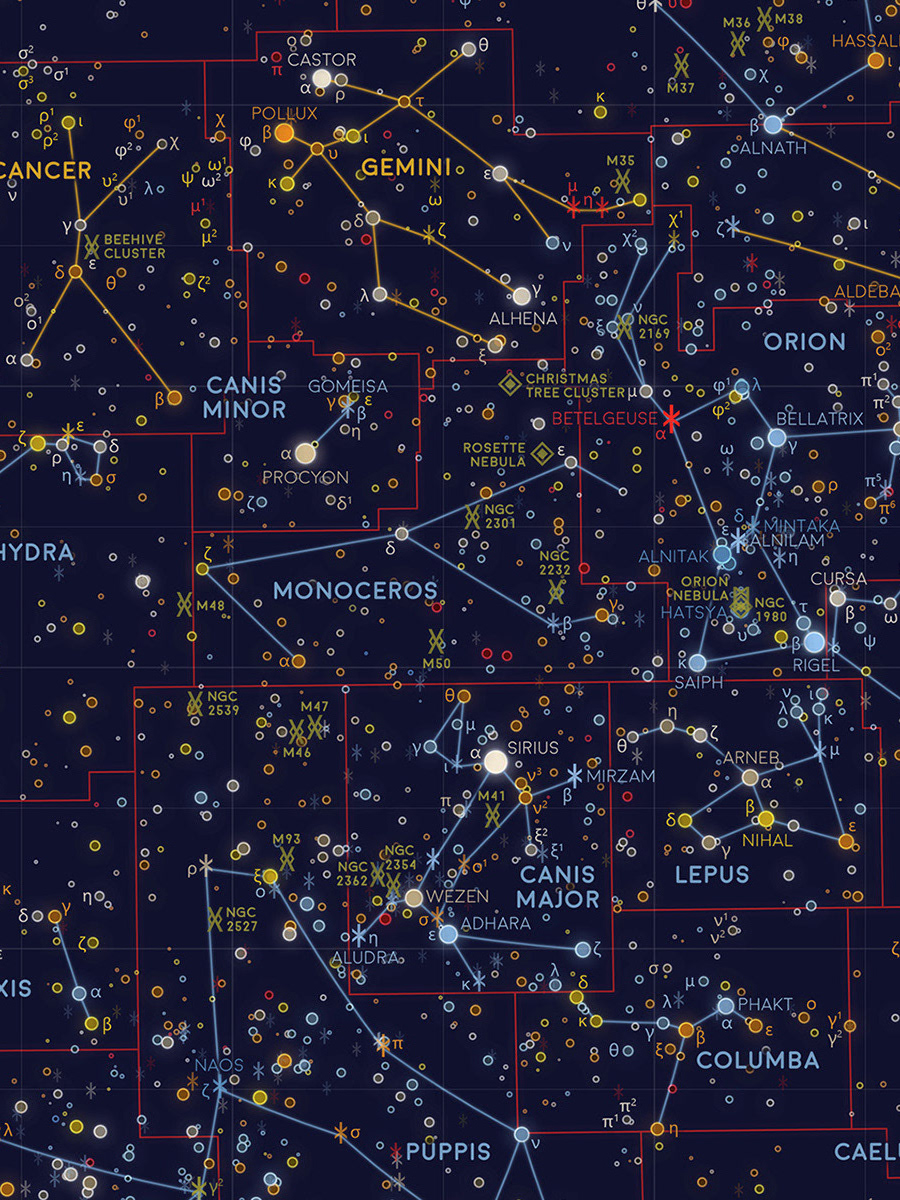
Mapping Constellations
2019
A map of every star visible from Earth with the naked eye.
Python • Illustrator • Photoshop
Data: HYG Database • Stellarium
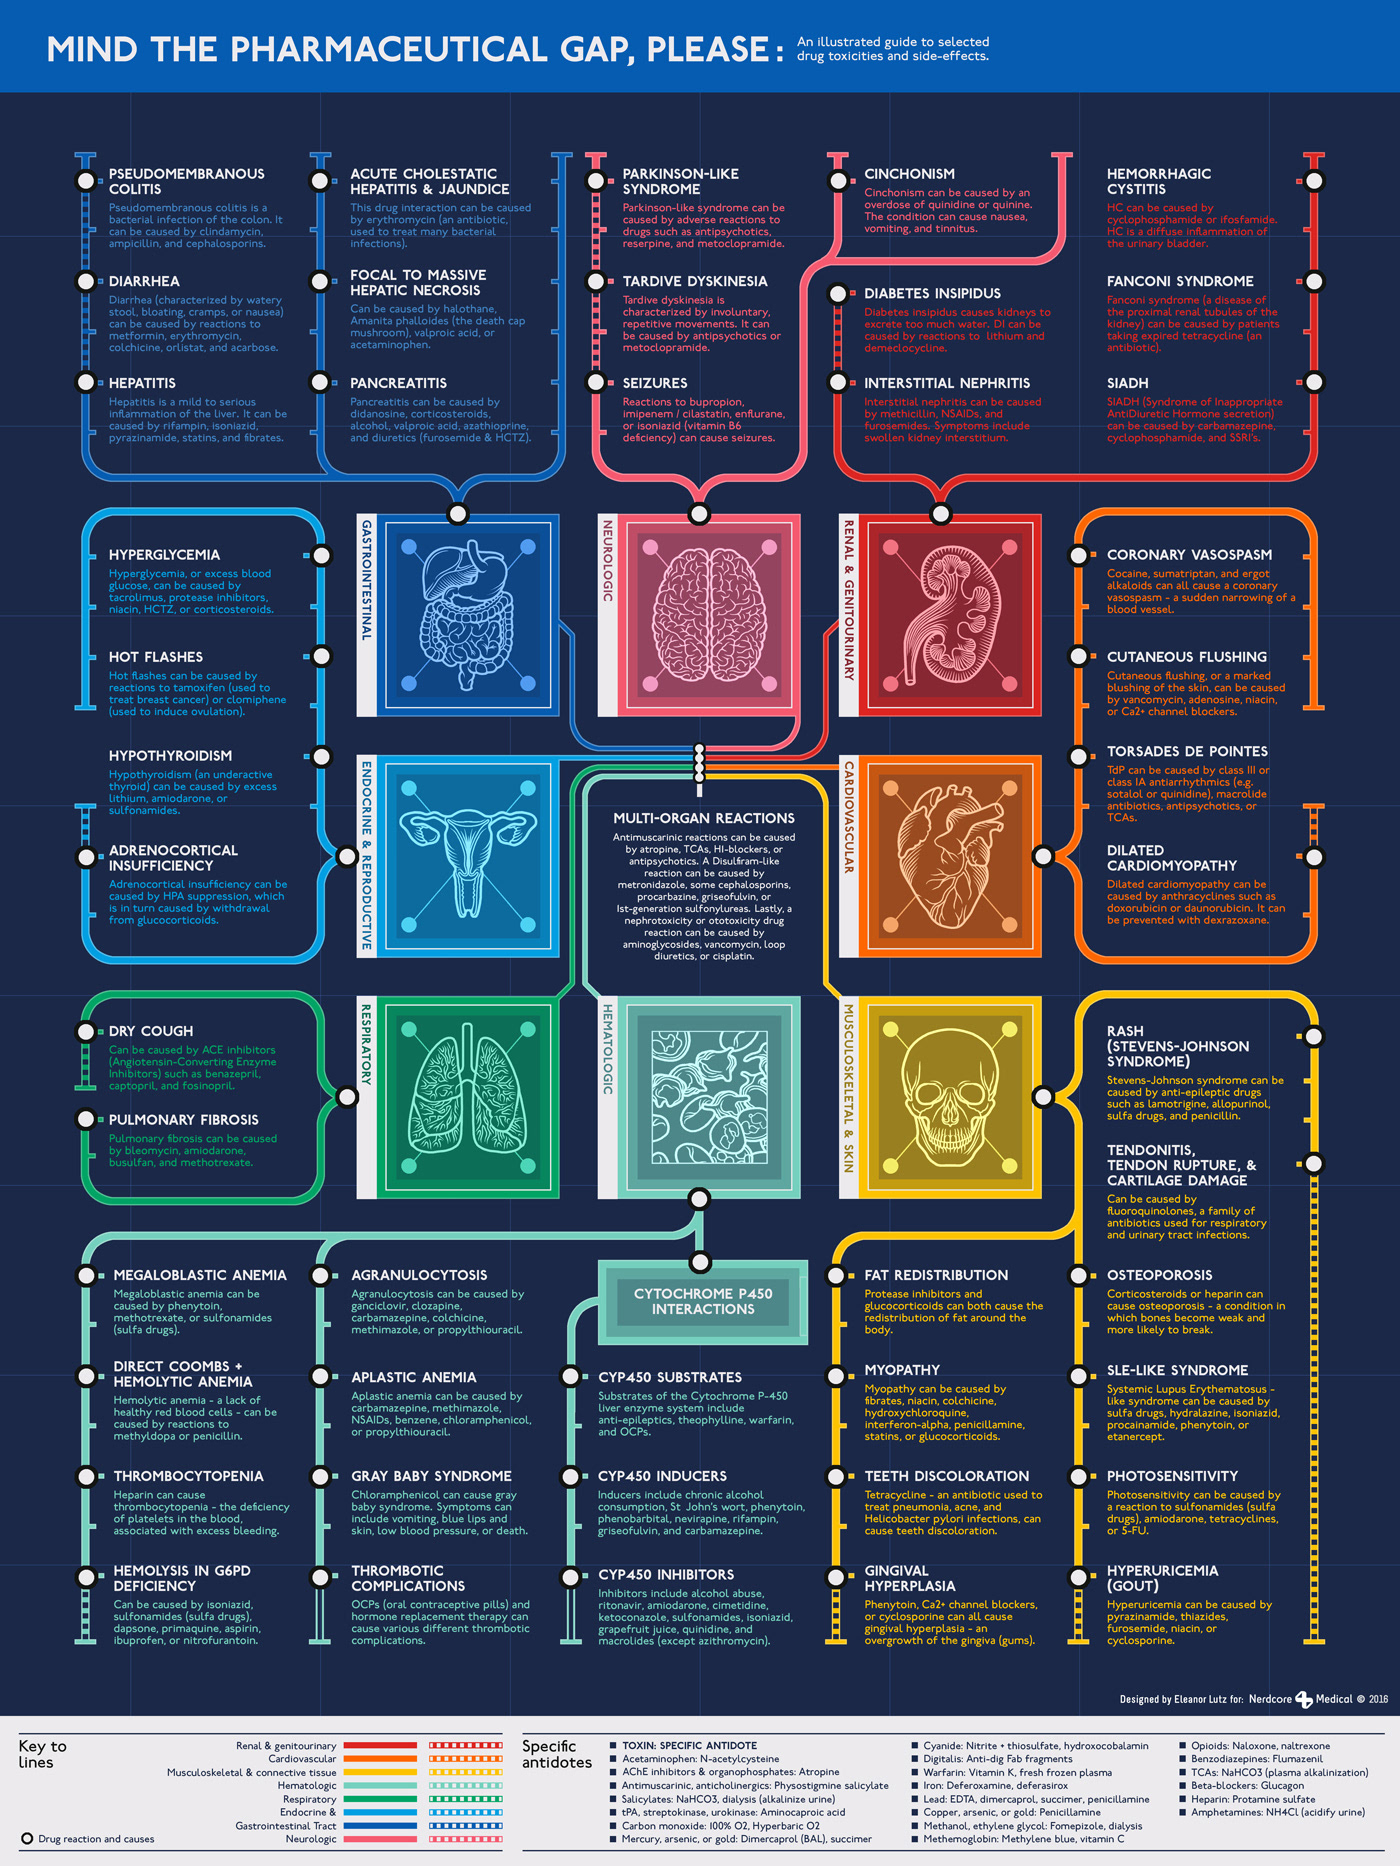
Typographic Design
2016
Infographics describing pharmacology, psychology, and statistics.
Photoshop
Client: Nerdcore Medical
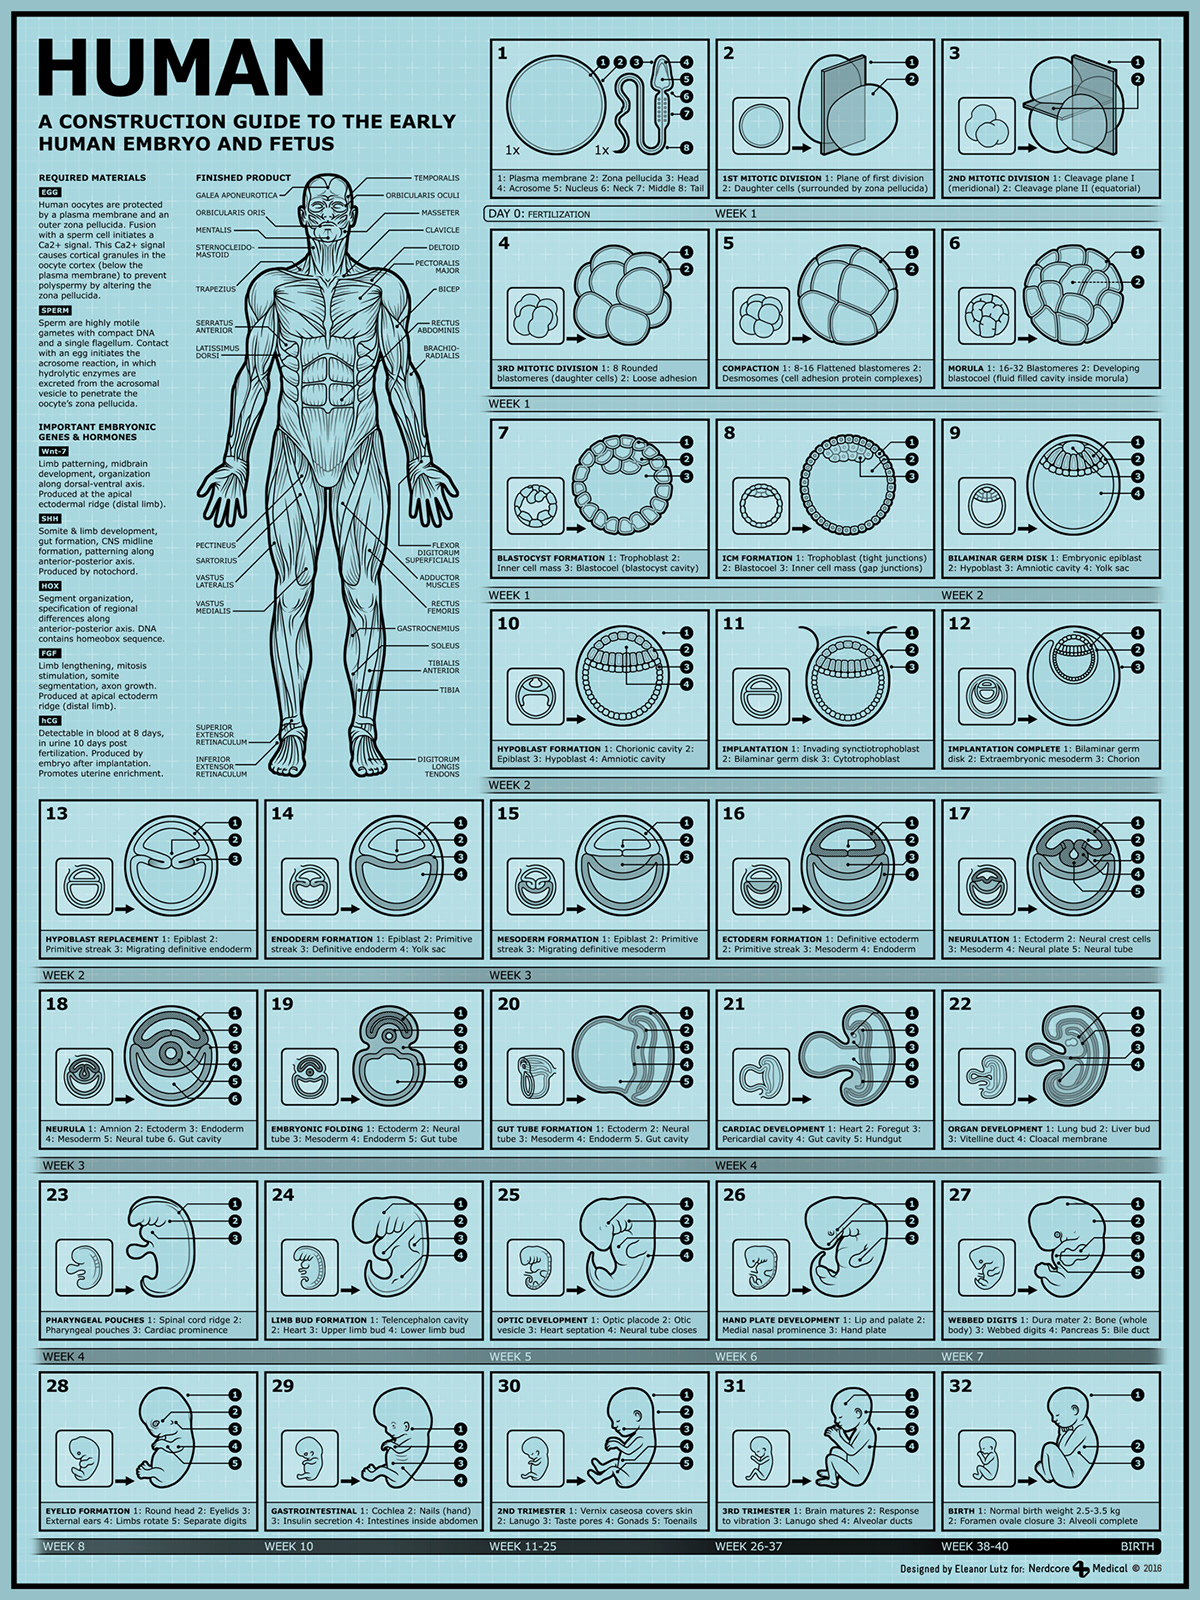
How to Build a Human
2016
Describing human development as an animated GIF and a static poster.
Photoshop
Client: Nerdcore Medical
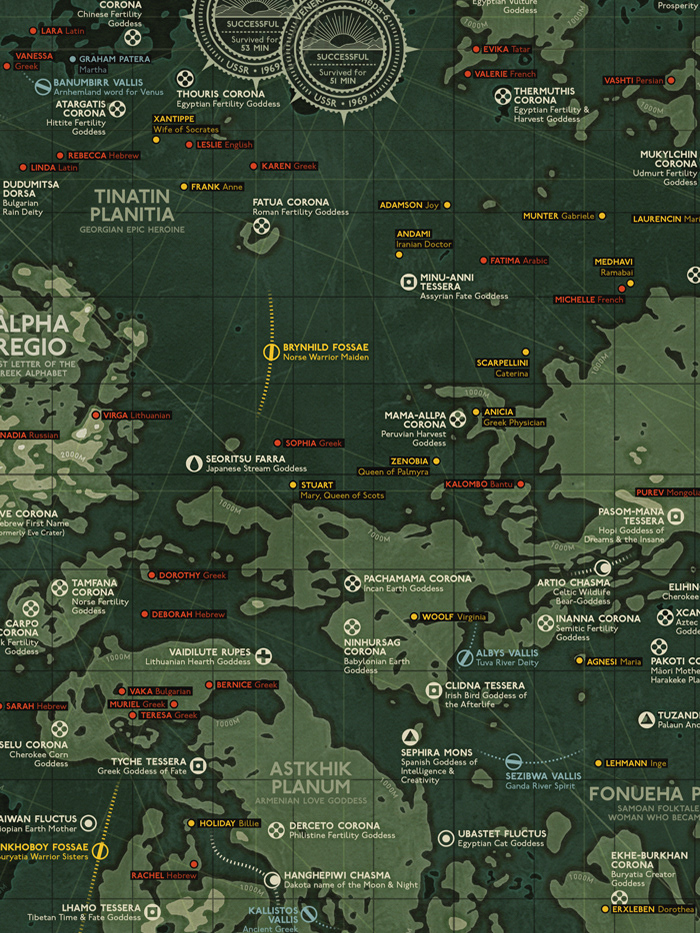
Topographic Maps of Space
2019
Labeled topographic maps of Mars, Mercury, Venus, and the Moon.
Python • Illustrator • Photoshop
Data: USGS • IAU • NASA
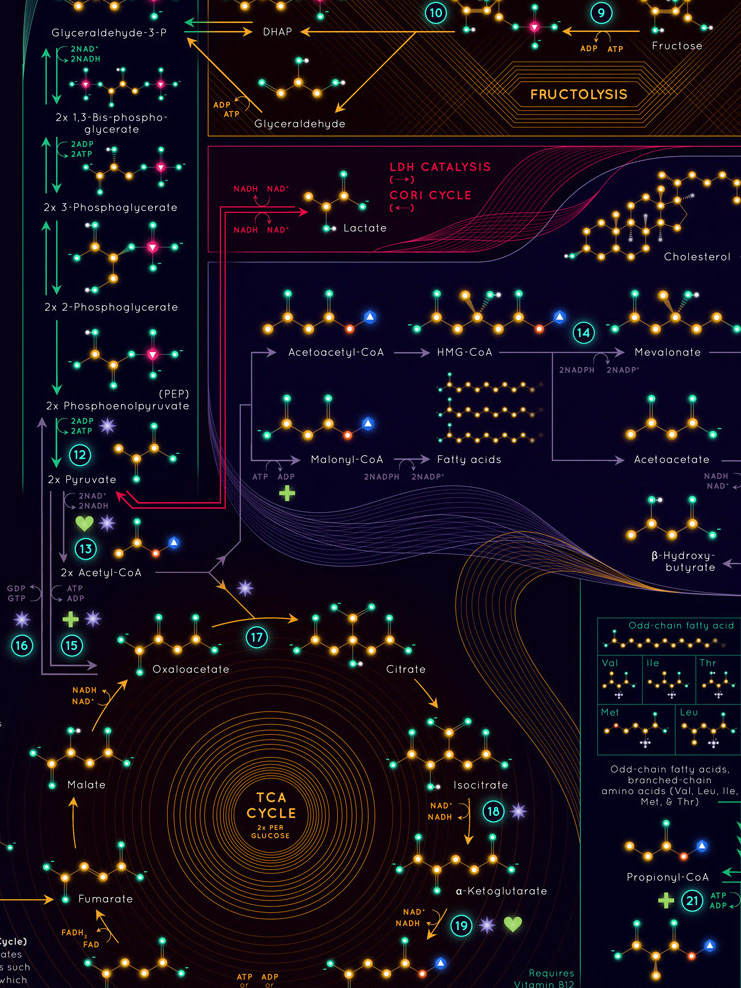
Complex Timeline Design
2016
Complex infographic diagrams about molecular biology and blood clotting.
Photoshop
Client: Nerdcore Medical
Illustrations
2013
Non-infographic illustrations from both commissioned and personal projects.
Photoshop • Illustrator