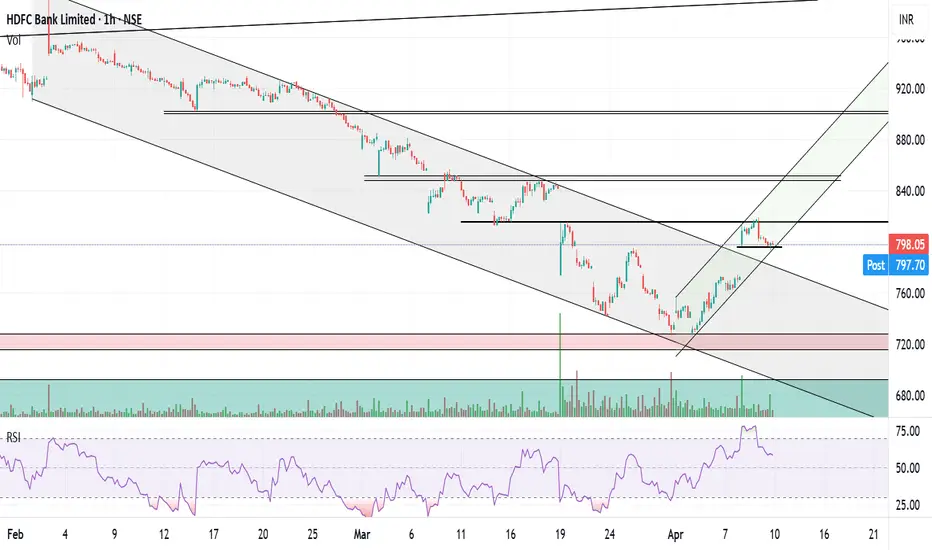
HDFCBANK - BULLISHHDFCBANK was moving in a descending zone, but it has now moved out and is now in an ascending zone. in the last 1 hour candle a hammer has been clearly formed - confirming the zone. the volume in the last 1 hour candle -which was green - was also much higher than average hourly volume.
the formatio

The best trades require research, then commitment.
Get started for free$0 forever, no credit card needed

Scott "Kidd" PoteetPolaris Dawn astronaut

Where the world does markets
Join 100 million traders and investors taking the future into their own hands.
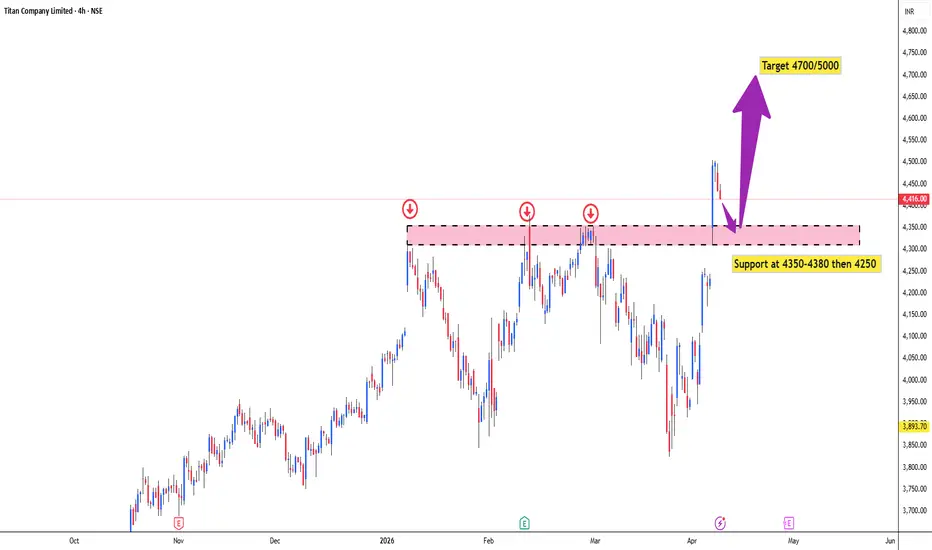
#Titan cash - Fundamental and technical view given belowTitan Company – Simple Fundamental & Technical Analysis
Fundamental View
Titan Company is one of India’s strongest consumer brands under the Tata Group umbrella. It operates mainly in jewellery through Tanishq, along with watches, eyewear, and emerging segments like wearables. The biggest strength
CUMMINSIND Price Action1. Trend Bullish
2. Set up - Breakout
3. Entry early gives edge for small SL and big profits
4. Over all market is also positive

Adani Energy Sol (D): Strong Bullish, Multi-Year Base BO AttemptTimeframe: Daily | Scale: Linear
The stock is making a highly aggressive attempt to break out of a massive 3-year consolidation base. Today's price action, backed by a significant volume anomaly, suggests that institutional buyers are stepping in to absorb the historical overhead supply.
📈 1. Th

Gold (XAUUSD) – Triangle Structure Near Key SupportGold is currently forming a triangle pattern on the 1H timeframe after a strong bullish move. Price recently faced rejection from the upper boundary, showing short-term weakness, and is now pulling back toward a rising trendline support.
The highlighted zone around 4660–4670 acts as a key dynamic s

GMDC#GMDC
Chart Pattern: Pole & Flag
Flag: Inverted Head And Shoulder
T1 : 733
T2 : 836
Note:
The stock price, entry, stop-loss (SL), and target levels shared are strictly for educational and observation purposes only.
This is not investment advice. Please do your own research or consult a registere

XAUUSD | 4H Technical Outlook: Rejection From SupplyXAUUSD | 4H Outlook
Price is trading below a key resistance zone, keeping short-term bearish pressure intact.
Sell Zone:
4,690 – 4,700 rejection can lead to downside toward 4,590 – 4,565.
Buy Zone:
If price reacts strongly from 4,580 – 4,565, a short-term bounce back into resistance is possible.

Titan(Weekly) – Wave 5 in Final Stage at All-Time HighsTimeframe: Weekly
Current Price: ₹4,246
Elliott Wave Analysis
From the major low of ₹1,825.05, Titan has completed a clear 5-wave impulsive rally:
Wave 1 : ₹2,791
Wave 2 : ₹2,269.60 (sharp retracement)
Wave 3 : ₹3,886.95 (exact 1.618 extension of Wave 1)
Wave 4 : ₹2,925 (WXY double zigza

ABB – Double Bottom Attempt | Watch BreakoutABB is forming a potential double bottom near demand, with improving momentum and volume support.
However, the structure remains incomplete until a neckline breakout.
🔹 Key Level: 6200
🔹 Entry: Above 6200 (confirmation)
🔹 SL: 5850
🔹 Targets: 6600 → 7200
👉 Early accumulation visible, but confirmation

Nifty long term perspective by weekly chart analysis.NIFTY 50 WEEKLY CHART ANALYSIS.
As we can see after the covid 2020 fall, Nifty 50 index recovered and respected the the support Trendline. This Trendline has just broken in recent weeks due to war situation.
If we see just before covid fall same thing happened and the Market fell sharply. In that

See all editors' picks ideas
CVD Profiles [TradingIQ]Hello Traders!
🔹 CVD Profiles
CVD Profiles is a profile-based order flow visualization tool designed to show how participation distributes across price levels - not just over time, but through price itself .
Think volume profile data + TPO time segmenting!
Instead of looking at cumulative delt
Pine Script® indicator

Volume Bubbles [QuantAlgo]🟢 Overview
The Volume Bubbles indicator is a multi-layered volume cluster detection system that identifies statistically significant volume events directly on your price chart, classifying them by magnitude (Small, Medium, Big) and direction (Buy, Sell, Mixed). By combining adaptive percentile t
Pine Script® indicator

Monte Carlo CT [SS]This is the Monte Carlo CT indicator.
CT stands for "central tendencies" and is the real distinguishing characteristic of this indicator against other Monte Carlo based indicators.
In statistics, Central Tendency is a single value that attempts to describe a set of data by identifying the central
Pine Script® indicator

HTF Volume Spike & Imbalance Projection [LuxAlgo]The HTF Volume Spike & Imbalance Projection indicator provides a comprehensive multi-timeframe analysis tool that projects higher timeframe (HTF) candle structures, volume spikes, and volume profiles directly onto the current chart. This script aims to bridge the gap between different time horizon
Pine Script® indicator

Swing Structure Forecast [BOSWaves]Swing Structure Forecast - Statistical Swing Projection System with Volatility-Adaptive Support and Resistance Detection
Overview
Swing Structure Forecast is a statistically-driven swing analysis system that maps directional price structure through confirmed pivot identification, where supp
Pine Script® indicator

TASC 2026.04 A Synthetic Oscillator█ Overview
This script implements a Synthetic Oscillator as presented by John F. Ehlers in the April 2026 TASC Traders' Tips article "Avoiding Whipsaw Trades". The indicator aims to provide a smooth, low-lag oscillator for timely trading signals by dynamically mapping a sine wave to price data
Pine Script® indicator

Volume Spread Analysis IQ [TradingIQ]Hello Traders!
🔹Volume Spread Analysis IQ
This indicator was most voted on for our indicator competition - so here it is! Hope you guys like it :D
Volume Spread Analysis IQ is a chart-reading tool built to help traders judge effort, result, and background context in a way that is visual and
Pine Script® indicator

Market Microstructure AnalyticsThe Hidden Toll on Every Trade
Every time you buy or sell a financial instrument, you pay a cost that never appears on your brokerage statement. It is not a commission. It is not a fee. It is the spread between the price at which someone is willing to sell to you and the price at which someone is
Pine Script® indicator

Fair Value Gap Profile + Rolling POC [BigBeluga]🔵 OVERVIEW
FVG Profile builds a price-level profile based on detected Fair Value Gaps (FVGs) over a fixed lookback period.
Instead of measuring traded volume alone, this tool aggregates bullish and bearish FVG occurrences into horizontal bins, allowing traders to see where price inefficienci
Pine Script® indicator

PineScript integration with Notepad++ (UDL)THIS IS NOT AN INDICATOR!
This is PineScript integration with Notepad++ text editor (NPP). It supports PineScript v6 as of January 2026. Provides autocompletion, function list and syntax highlighting for *.pine files.
Why would anyone need this?
Pine Editor doesn't provide function list yet
Pi
Pine Script® indicator

See all indicators and strategies
Community trends
CUMMINSIND Price Action1. Trend Bullish
2. Set up - Breakout
3. Entry early gives edge for small SL and big profits
4. Over all market is also positive
#Titan cash - Fundamental and technical view given belowTitan Company – Simple Fundamental & Technical Analysis
Fundamental View
Titan Company is one of India’s strongest consumer brands under the Tata Group umbrella. It operates mainly in jewellery through Tanishq, along with watches, eyewear, and emerging segments like wearables. The biggest strength
HDFCBANK - BULLISHHDFCBANK was moving in a descending zone, but it has now moved out and is now in an ascending zone. in the last 1 hour candle a hammer has been clearly formed - confirming the zone. the volume in the last 1 hour candle -which was green - was also much higher than average hourly volume.
the formatio
BUY TODAY SELL TOMORROW for 5%DON’T HAVE TIME TO MANAGE YOUR TRADES?
- Take BTST trades at 3:25 pm every day
- Try to exit by taking 4-7% profit of each trade
- SL can also be maintained as closing below the low of the breakout candle
Now, why do I prefer BTST over swing trades? The primary reason is that I have observed that

Groww has given breakout from rounding bottomGroww has given a breakout from rounding bottom in daily timeframe.
RSI and MACD both showing momentum.
target - 218, SL- 180.
This is only for educational purpose.

KIRLOSKER PNEUMATICS CO. LTD - A multi factorial analysis NSE:KIRLPNU
Price above all EMA/s on Daily and weekly
RSI showing strength and divergence on weekly
Price strength make capable to escape the AI Cloud on Weekly
Delta Table on Daily expressing good accumulations
Ideal to wait till clear daily close above 1220
Warning:
Trading without

Sbin The price opened with a gap up, unable to sustain and fall down towards the support zone 1030 - 1040. How the price reacts at this level will decide the trend direction. We can see the confluence of channel and support at the 1035 zone.
The daily chart shows the price is near the trend line support.

Parallel Channel + S/R Flip Zone — Price Action StudyDescription
📊Left Chart — Weekly Timeframe | Parallel Channel Structure
- The weekly chart presents a textbook descending parallel channel, formed through a series of Lower Lows (LL) and Lower Highs (LH) — the classic definition of a prevailing downtrend in price action theory. What makes this chan

Cochin Ship 1 hr chartThe stock was earlier in a clear downtrend with price consistently trading below the 10 & 20 EMA, showing sustained selling pressure. However, a strong reversal from the bottom is visible, supported by a rounding pattern formation and improving structure.
Now price has moved above both EMAs, and EM

Inox India cmp 1223.90 by the Daily Chart view since listedInox India cmp 1223.90 by the Daily Chart view since listed
*Technically Bullish Chart Setup*
- Cup and Handle
- Head and Shoulders
- Repeated Rounding Bottom
- Support Zone 1100 to 1205 Price Band
- Resistance Zone 1260 to 1360 Price Band
- Resistance Zone acting major hurdle for fresh breakout

See all stocks ideas
Apr 13
SWARAJENGSwaraj Engines Ltd
Actual
—
Estimate
—
Apr 13
JUSTDIALJust Dial Ltd.
Actual
—
Estimate
16.68
INR
Apr 14
NUVOCONuvoco Vistas Corporation Limited
Actual
—
Estimate
4.80
INR
Apr 14
ICICIPRULIICICI Prudential Life Insurance Co. Ltd.
Actual
—
Estimate
2.56
INR
Apr 14
EIMCOELECOEimco Elecon (India) Ltd.
Actual
—
Estimate
—
Apr 14
TARILTransformers and Rectifiers (India) Limited
Actual
—
Estimate
—
Apr 15
GTPLGTPL Hathway Ltd
Actual
—
Estimate
—
Apr 15
ELECONElecon Engineering Co. Ltd.
Actual
—
Estimate
—
See more events
Community trends
BTCUSD 10th April Prediction | ICT Concept: Liquidity & OBWith a sweep of high, followed by a market structure shit. Price is heading back to a valid order block formed at 15 minutes. With stop loss above the previous swing high, target 1:3 for swing low.

Ethereum Price Action TradeCryptos have been struggling in a range for a long time. Ethereum tried to break out once many times and the chart structure shows that ETH is again trying to breakout of the range. ETH has even formed range within range and has given breakout of the small range.
Now, we do not want to complicate

BTC BUY OR SELL PLAN AT CURRENT LEVELBTC now at approx 71100-71300
if it breaks 71600 and closed above 15 min candle - GO LONG with SL 71000
or if it breaks 71000 and close 15 min candle below this- GO SHORT with sl 72000

72k Highest OIHello to Fellow Traders
As seen in last idea We have placed Bids For both Long and short, But as of now at 72k is acting as a huge resistance with increasing call writing at extreme level. We can initiate a short at around 72k once the price reaches at that point.
For more clarity kindly refer to

Bitcoin Bybit chart analysis APRIL 9Hello
It's a Bitcoin Guide.
If you "follow"
You can receive real-time movement paths and comment notifications on major sections.
If my analysis was helpful,
Please click the booster button at the bottom.
This is the Bitcoin 30-minute chart.
The Nasdaq indicators will be released shortly at 9

BTC/USD: Breaking the Consolidation for a Move to 100KBitcoin is currently exhibiting a potent bullish reversal after a period of significant consolidation. Following a volatile start to 2026, the script has reclaimed the critical $70,000 support zone, bolstered by a temporary US-Iran ceasefire that has restored global risk appetite.
Technically, the

BTCUSD Swing Long Setup | Targeting 77.8K and 80.4KSharing my current BTCUSD long setup on the daily timeframe. Entry zone is around 72,700, with risk defined below 70,150. The chart suggests buyer strength after repeated support reactions, and I am watching for a move toward 77,880 as the first target and 80,416 as the second target.
This is a cle

BTC Bullish Hi,
My view on Bit coin is positive side; bitcoin ready to give huge move in upcoming days.
Buy bitcoin on current market price.
SL 69700
Target 80300
Thanks

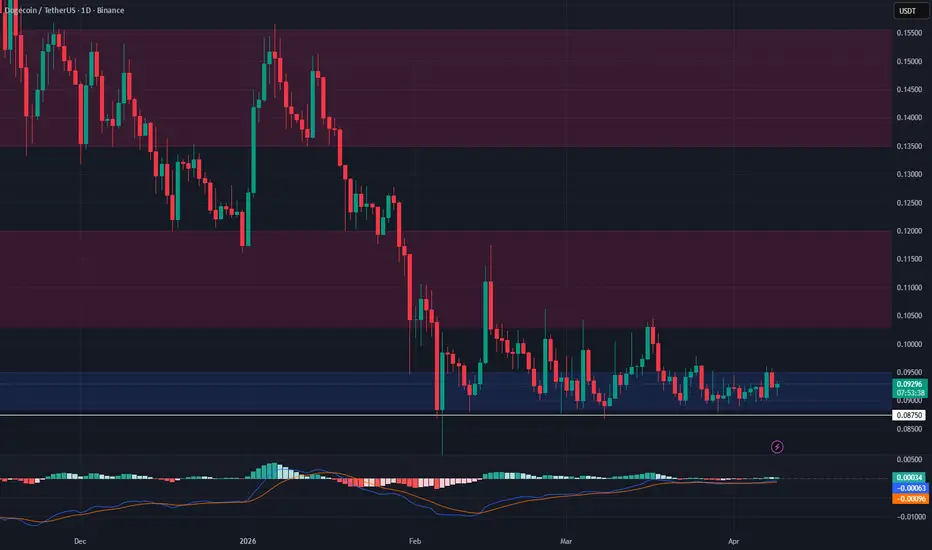
DOGE Break & Retest Above $0.095 for Long OpportunityDOGE is approaching a key resistance area. A confirmed break and retest of $0.095 as support could provide a solid long spot opportunity, especially if the broader crypto market stays strong.
Trading Levels:
Entry: Break and retest of $0.095 into support
TP1: $0.103 – $0.12
TP2: $0.135 – $0.155
St

See all crypto ideas
GOLD PRINTS GREEN BUT STILL TRAPPED 4760 Resistance HoldsYesterday gold printed a green candle, closing near 4763. Encouraging.....but the 50% Fib at 4760 and the major resistance zone at 4760-4800 is still not cleanly broken on a closing basis. We've now had multiple attempts at this zone over the past week. Every time bulls push in, they get faded by th

XAUUSD — Recovery Stalls Below ResistanceXAUUSD — Gold rebounds, but the chart is now testing a tighter decision zone
Gold is trying to recover after the recent pullback, but the structure is no longer in a clean expansion phase.
The latest U.S. core PCE reading came in at 3.0% YoY for February, in line with expectations and slightly lowe

Gold Trading Strategy for 10th April 2026💰 GOLD INTRADAY TRADING PLAN 💰
🟢 BUY ABOVE 4795
If the 30-minute candle closes above 4795, it indicates bullish strength.
👉 Enter a buy trade only after price breaks the high of that candle.
🎯 Upside Targets:
💵 $4810 – First resistance target
💵 $4825 – Second profit level
💵 $4845 – Final extended t

Increasing uncertainty for Crude OILHey Folks,
I am back after a quite long time. Had to take care of some work at my home. so couldn't do trades from past 2 months.
Now as i am back, i was though tracking the geopolitical event as much as i could. and with the recent truce call of Mr. Trump "again" with Iran had Oil crashed nearly

XAUUSD – Structure before CPIXAUUSD – Holding Structure Ahead of CPI, Liquidity Still Above
Gold is stabilizing after the recent pullback, with price now holding above a key intraday base. The structure is not breaking down — instead, it is compressing just below resistance, suggesting the market is preparing for the next move

XAUUSD Wave C forming — correction before move?Gold is showing a clear Elliott Wave corrective structure (A–B–C) after completing a strong impulsive move to the upside. Price is now approaching a key sell zone around 4780–4800, aligning with the upper trendline.
Technical structure (Elliott view) Previous impulse (1–5) appears completed Current

High volatility, stay calm and composed.International gold is trading in a narrow high-range consolidation today, with sideways action between $4750 and $4780 in the early session. It faced pressure and pulled back after testing the $4800 level overnight. Market participation remains cautious ahead of the key US March CPI data due at 20:3

Elliott Wave Analysis of #USOILA strong decline is expected to complete the wave 3 on USOIL. As wave C of a zigzag contains five waves, it is expected that the price drops below the minutte wave A.

Gold4-Hour Chart Bullish Dominance Inside an Ascending Channel📊 From the 4-hour K-line structure, international gold has completely shifted from a downtrend to an uptrend. It is currently trading within a clear Uptrend Channel, with strong and established bullish control.
📈 After breaking below the lower bound of the downward channel in mid-March, gold formed

Gold pullback or CPI trap before move?Gold is still holding a bullish H1 structure, but price is pulling back inside a small descending channel after rejecting near 4,831.
Today’s real catalyst is US CPI, scheduled for 8:30 a.m. ET on April 10. Recent previews point to a potentially hotter inflation print, largely because of the oil sh

See all futures ideas
USD/JPY Still in Wait & See ModeUSD/JPY traded within a limited range during today's Asian session, failing to break through the 159.00 level but remaining above the critical 158.00 level.
-------------------------------------------------------------------------------------------
✅ Key Catalysts: Lebanon Tensions & the Strait of

NZDUSD Multi Time-Frame Analysis Hi traders, this is the complete multi-time frame analysis for this pair. Please feel free to ask any questions in the comment section below. The entry will only be made if all strategy rules are met.

USDJPY Short Trade IdeaDirection: Short
Entry: 159.408
Stop-Loss: 69 points (0.069) above entry
➡️ SL = 0.438 %
Risk-Reward: 1 : 2.35
USDJPY has reacted strongly from the premium supply zone and is showing signs of exhaustion near the upper trendline of the descending structure.
Current price action suggests a potential

AUDUSD - 15M - LONGFOREXCOM:AUDUSD
Hello traders , here is the full multi time frame analysis for this pair, let me know in the comment section below if you have any questions, the entry will be taken only if all rules of the strategies will be satisfied. wait for more Smart Money to develop before taking any pos

EUR/USD Bearish for one more fall in 4hr timeframeEUR/USD is forming an flat(Corrective pattern).Looks like one more fall for an target of 1.14840

Rising Wedge Chart PatternOverview
This chart illustrates a Rising Wedge pattern, where price is moving upward within two converging trendlines, indicating weakening bullish momentum.
⸻⸻⸻⸻⸻⸻⸻⸻⸻⸻⸻
📘 Concept
• Price forms Higher Highs (HH) and Higher Lows (HL), but the range starts to contract.
• The narrowing structure

Elliott Wave Analysis of #EURUSDA triangle is unfolding in the wave 4 in EURUSD. The fifth will be to the downside as the larger trend.

GBPNZD ANALYSIS ON (06 APR 2026)#XAUUSD UPDATEDE
Current price - 2.31700
If price stay above 2.31300 then next target 2.32150,2.32600 and 2.33000 and below that 2.30000
Plan1;If price break 2.31700-2.31600 area,and stay above 2.31700 we will placed buy order in GBPNZD with target of 2.32150,2.32600 and 2.33000 & stop loss shoul

Smart Money Exit on EURUSD – Bearish Move Loading### 📊 **Context**
* Market was in a **strong uptrend** (clear ascending trendline).
* Price tapped a **major resistance / supply zone** (~1.19–1.20).
* Strong **bearish rejection candle** formed at the top.
* Trendline **break + structure shift** already initiated.
---
## 🎯 **Trade Plan**
### 🔹

GBPUSD trade ideaSeeing potential longs on the higher timeframe but counter trend(Hybrid trading for the shorts at the current moment. #FalconFx #Falcontradingguidance #HybridTrader

See all forex ideas
Trade directly on Supercharts through our supported, fully-verified, and user-reviewed brokers.


