> For the complete documentation index, see [llms.txt](https://docs.codeocean.com/user-guide/llms.txt). Markdown versions of documentation pages are available by appending `.md` to page URLs; this page is available as [Markdown](https://docs.codeocean.com/user-guide/code-ocean-apps/visualization.md).

# Visualization

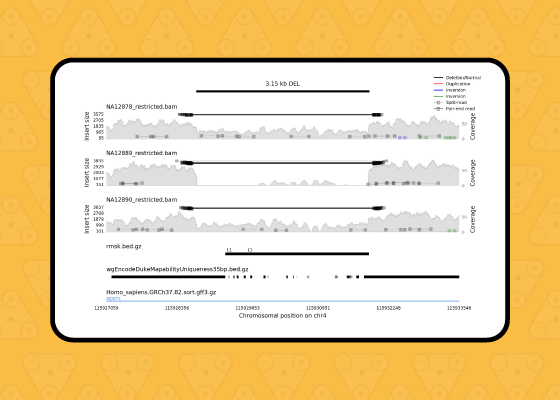
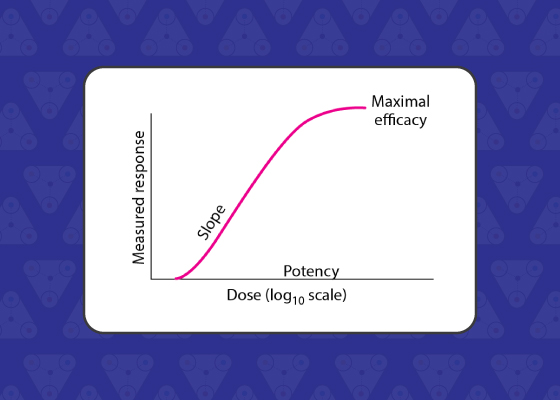
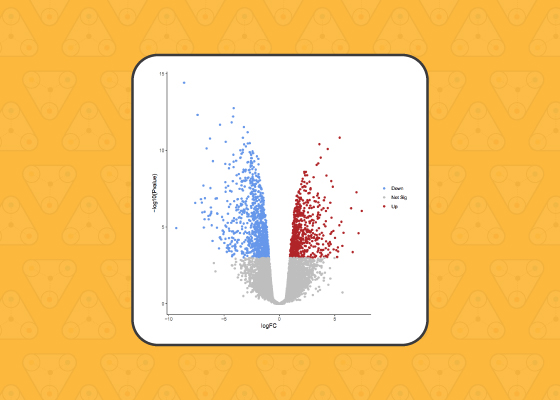
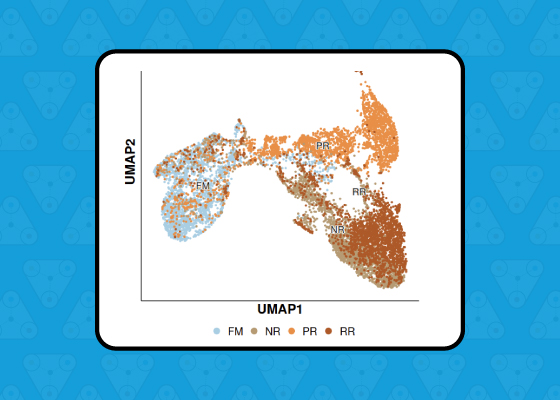
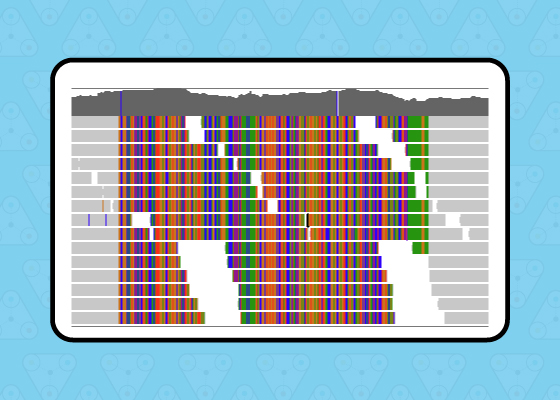
<table data-full-width="true"><thead><tr><th width="366.33333333333337"></th><th width="175">Title</th><th width="201">Description</th><th>Input Data</th><th data-hidden>Description</th><th data-hidden></th></tr></thead><tbody><tr><td><img src="https://content.gitbook.com/content/IXW7wvn1GtkljhxGS08z/blobs/L4S8rrBQ3dx1bwaPVyHD/App%20library%20banners%20560x400-phase%202%20part2_Wally%20visualization.jpg" alt=""></td><td>Wally visualizations</td><td>This Capsule creates a genomic alignment plot of reads in a specified region mapped to a reference. The visualization of genomic alignments was heavily inspired by IGV, and customized to visualize structural variation and CNVs.</td><td><ul><li>Genome .fasta reference and .fai file</li><li>.bam files</li></ul></td><td>Wally creates a genomic alignment plot of reads in a specified region mapped to a reference. The visualization of genomic alignments was heavily inspired by IGV, and customized to visualize structural variation and CNVs.</td><td></td></tr><tr><td><img src="https://content.gitbook.com/content/IXW7wvn1GtkljhxGS08z/blobs/nTJ9WPuFjTjOyNSJLEHA/image.png" alt="" data-size="original"></td><td>Samplot Visualization (from coordinates)</td><td>This Capsule is a command line tool for rapid, multi-sample structural variant visualization.</td><td><p></p><ul><li>compare sheet</li><li>.bam files</li></ul></td><td></td><td></td></tr><tr><td><img src="https://content.gitbook.com/content/IXW7wvn1GtkljhxGS08z/blobs/2iC1cjjDKHooqg8tQEwk/App%20library%20banners%20560x400-phase%202_Dose%20Response%20Capsule.jpg" alt=""></td><td>Dose response</td><td>This Capsule produces dose response curves that describe the magnitude of the response as a function of exposure (dose) to a condition after a certain exposure time.</td><td><ul><li>.csv file containing gene expression and treatment dosage (see README for details)</li></ul></td><td>Produces dose response curves that describe the magnitude of the response as a function of exposure (dose) to a condition after a certain exposure time.</td><td></td></tr><tr><td><img src="https://content.gitbook.com/content/IXW7wvn1GtkljhxGS08z/blobs/Zud8gp3L0VgLMJ83c0QQ/App%20library%20banners%20560x400-phase%202_DESeq2.jpg" alt=""></td><td>DESeq2</td><td>This Capsule performs differential gene expression analysis with potential input types: 1. Transcript abundance; 2. Counts data; 3. HTseq-counts data; 4. Summarized experiment in RDS format.</td><td><ul><li>Input varies depending on the source (i.e., Seurat vs RSEM) see README for details.</li></ul></td><td>Differential gene expression analysis with potential input types: 1. Transcript abundance; 2. Counts data; 3. HTseq-counts data; 4. Summarized experiment in RDS format.</td><td></td></tr><tr><td><img src="https://content.gitbook.com/content/IXW7wvn1GtkljhxGS08z/blobs/Lx8xXVBu2dYT8Pv0LmE0/App%20library%20banners%20560x400-phase%202%20part2_MolStar%20Viewer.jpg" alt=""></td><td>Mol* Viewer for PDB Files</td><td>This Capsule allows you to view PDB files interactively on a Streamlit cloud workstation using the Mol* 3D Viewer.</td><td><ul><li>Protein structure files in .pdb format</li></ul></td><td>View PDB files interactively on a Streamlit cloud workstation using the Mol* 3D Viewer</td><td></td></tr><tr><td><img src="https://content.gitbook.com/content/IXW7wvn1GtkljhxGS08z/blobs/XySo86RHQxUIfI0WGCwY/App%20library%20banners%20560x400_Tensorboard.jpg" alt=""></td><td>TensorBoard GPU</td><td><p>This Capsules allows users to view model experiment metrics like loss and accuracy, visualizing the model graph, project embeddings to a lower dimensional space and more. This capsule shows an example from the Tensorboard website.  </p><p></p><p>This Capsule runs on GPU instances and comes preloaded with Tensorflow.</p></td><td><ul><li>None</li></ul></td><td><p>View model experiment metrics like loss and accuracy, visualizing the model graph, project embeddings to a lower dimensional space and more. This capsule shows an example from the Tensorboard website.  </p><p><br></p><p>This capsule runs on GPU instances and comes preloaded with Tensorflow.</p><p><br></p></td><td></td></tr><tr><td><img src="https://content.gitbook.com/content/IXW7wvn1GtkljhxGS08z/blobs/6VAdA4vQN9o7mJwHfRno/App%20library%20banners%20560x400_RShiny%20Cell-.jpg" alt=""></td><td>RShiny Cell</td><td>ShinyCell is an R package that allows users to create interactive Shiny-based web applications to visualize single-cell data.</td><td><ul><li>Single cell .rds inputs from Seurat (see README)</li></ul></td><td>ShinyCell is an R package that allows users to create interactive Shiny-based web applications to visualise single-cell data</td><td></td></tr><tr><td><img src="https://content.gitbook.com/content/IXW7wvn1GtkljhxGS08z/blobs/tMh00RgNNTH7ARrsEbVo/App%20library%20banners%20560x400_Scanpy.jpg" alt=""></td><td>1-3. Single Cell Analysis Tutorial (Scanpy &#x26; Seurat)</td><td><p>Tutorials to describe working with Single Cell data for Scanpy and Seurat: </p><p></p><p>1. Preprocessing and clustering 3k PBMCs </p><p>2. Core Plotting Functions </p><p>3. How to preprocess UMI count data with analytic Pearson residuals</p></td><td><ul><li>Tutorial datasets (see README for details)</li></ul></td><td><p>Tutorials to describe working with Single Cell data for Scanpy and Seurat: </p><p></p><p>1. Preprocessing and clustering 3k PBMCs </p><p>2. Core Plotting Functions </p><p>3. How to preprocess UMI count data  with analytic Pearson residu</p></td><td></td></tr><tr><td><img src="https://content.gitbook.com/content/IXW7wvn1GtkljhxGS08z/blobs/tMh00RgNNTH7ARrsEbVo/App%20library%20banners%20560x400_Scanpy.jpg" alt=""></td><td>5-6. Single Cell Analysis Tutorial (Scanpy)</td><td>Tutorials demonstrating how to regress cell cycle effect and how to simulate data using a literature-curated boolean gene regulatory network.</td><td><ul><li>Tutorial datasets (see README for details)</li></ul></td><td>utorials demonstrating how to regress cell cycle effect and how to simulate data using a literature-curated boolean gene regulatory network</td><td></td></tr><tr><td><img src="https://content.gitbook.com/content/IXW7wvn1GtkljhxGS08z/blobs/tMh00RgNNTH7ARrsEbVo/App%20library%20banners%20560x400_Scanpy.jpg" alt=""></td><td>7-10. Single Cell Analysis Tutorial (Scanpy) Advanced</td><td>Tutorials for advanced Single Cell processing.</td><td><ul><li>Tutorial datasets (see README for details)</li></ul></td><td>Tutorials for advanced Single Cell processing.</td><td></td></tr><tr><td></td><td></td><td></td><td></td><td></td><td></td></tr><tr><td><img src="https://content.gitbook.com/content/IXW7wvn1GtkljhxGS08z/blobs/ZiVlccQPXPRofuLmATQ5/App%20library%20banners%20560x400_MLFlow-.jpg" alt=""></td><td>MLflow Orchestrator Capsule</td><td>This is a central MLflow "Orchestrator" capsule that can be used to interactively view the results from multiple machine learning capsules using the same MLflow database.</td><td><ul><li>None</li></ul></td><td>This is a central MLflow "Orchestrator" capsule that can be used to interactively view the results from multiple machine learning capsules using the same MLflow database</td><td></td></tr></tbody></table>


---

# Agent Instructions
This documentation is published with GitBook. GitBook is the documentation platform designed so that both humans and AI agents can read, navigate, and reason over technical content effectively. Learn more at gitbook.com.

## Querying This Documentation
If you need additional information that is not directly available in this page, you can query the documentation by asking a question.

Perform an HTTP GET request on the following URL with the `ask` and `goal` query parameters:

```
GET https://docs.codeocean.com/user-guide/code-ocean-apps/visualization.md?ask=<question>&goal=<user_goal>
```

`ask` is the immediate question: it should be specific, self-contained, and written in natural language.
`goal` is what the user is ultimately trying to achieve, the reason they need the answer. Sharing it helps GitBook give you a better, more relevant answer. A goal is most helpful when it describes the outcome the user wants rather than restating the question. For example, with `ask=how do I create an API token`, a goal like `automate deployments from our CI pipeline` lets GitBook tailor the answer to that use case.

The response will contain a direct answer to the question and relevant excerpts and sources from the documentation.

Use this mechanism when the answer is not explicitly present in the current page, you need clarification or additional context, or you want to retrieve related documentation sections.