-
-
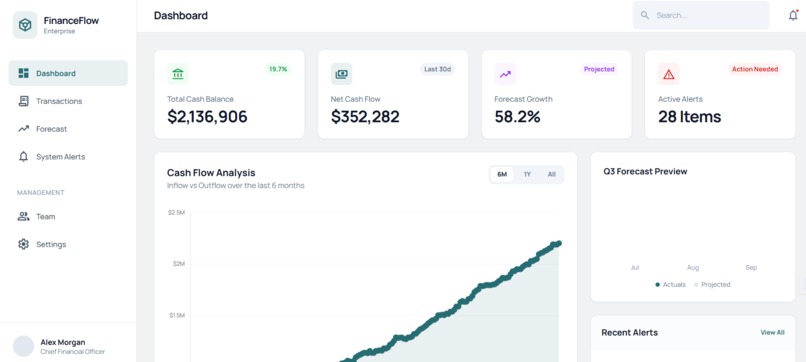
Real-time cash overview showing balance, inflows, outflows, and early risk signals at a glance.
-
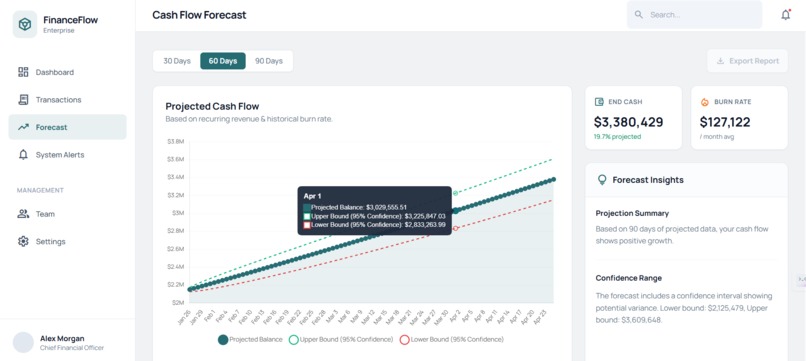
30–90 day cash flow forecast with best- and worst-case scenarios to anticipate shortfalls early.
-
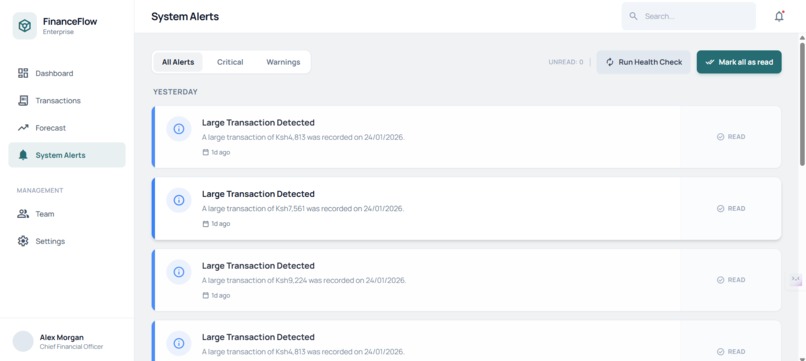
Automated alerts highlight low balances and upcoming cash flow risks before they become emergencies.
-
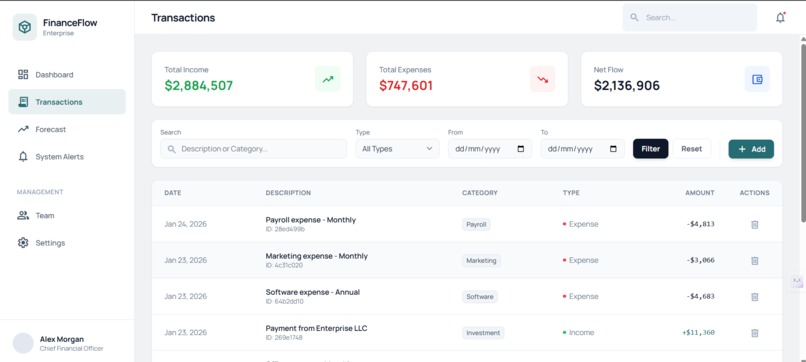
Simple transaction tracking for cash in and cash out, designed for clarity instead of accounting complexity.
-
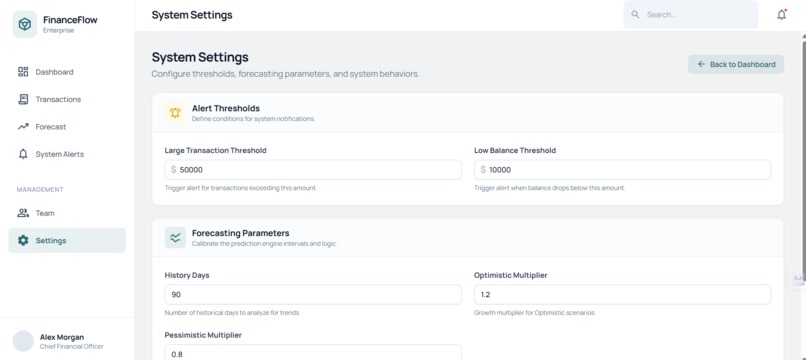
Configurable thresholds and preferences that adapt alerts and forecasts to each business’s cash reality.


Project Story; CashFlowDashboard
Inspiration
Picture a small business owner at the end of the month.
Sales look good. Customers are coming in.
But rent is due next week, payroll in two weeks, and three invoices are still unpaid.
That tension ;being profitable but unsure — is what inspired CashFlowDashboard.
Many small businesses don’t fail because they lose money.
They fail because they don’t see cash problems early enough to react.
I wanted to build something that answers a simple, practical question:
“If nothing unexpected happens, will this business still be okay in the next 30–90 days?”
What it does
CashFlowDashboard gives small businesses early visibility into their future cash position.
It helps users:
- See their current cash balance and recent trends
- Track income and expenses in one place
- Forecast cash flow 30–90 days ahead
- Understand best- and worst-case outcomes
- Receive alerts when projected balances become risky
Instead of focusing on accounting reports, the product focuses on what’s coming next.
How we built it
The system is built as a clean, server-rendered web application using ASP.NET Core MVC.
At the core is a simple but transparent forecasting approach:
- Historical cash flow is treated as a time-based signal
- A linear regression model projects future cash position
- Confidence bounds are shown to reflect uncertainty, not false precision
The application follows a layered structure:
- Controllers handle user requests
- Services contain forecasting and alert logic
- ViewModels shape data for the UI
- The database stores transactions and derived signals
This structure allowed fast iteration while keeping the system understandable and maintainable.
Challenges we ran into
Balancing simplicity and usefulness
It was tempting to add more features, but clarity mattered more than completeness.
Representing uncertainty honestly
Forecasts are never guarantees. Showing confidence ranges was important to avoid misleading users.
Time pressure
Hackathon constraints forced hard decisions about what to build — and what to leave out.
Accomplishments that we're proud of
- Delivering a working forecasting system with real transaction data
- Building a clean, calm UI that highlights risk instead of noise
- Keeping the math explainable rather than hiding it behind “AI”
- Maintaining a production-style architecture under time pressure
- Creating something that feels useful, not just impressive
What we learned
This project reinforced that:
- You don’t need complex machine learning to create value
- Early warning signals matter more than detailed reports
- Transparency builds more trust than sophistication
- Good systems reduce stress, not just display numbers
Most importantly, we learned that cash flow is emotional it affects decisions, confidence, and sleep.
What's next for CashFlowDashboard
Future improvements could include:
- PDF and CSV exports
- Bank feed integrations
- More advanced scenario modeling
- Email or mobile notifications
- Multi-tenant support for accountants and advisors
CashFlowDashboard doesn’t promise certainty.
It provides foresight and sometimes, that’s enough to change the outcome.

Log in or sign up for Devpost to join the conversation.