-
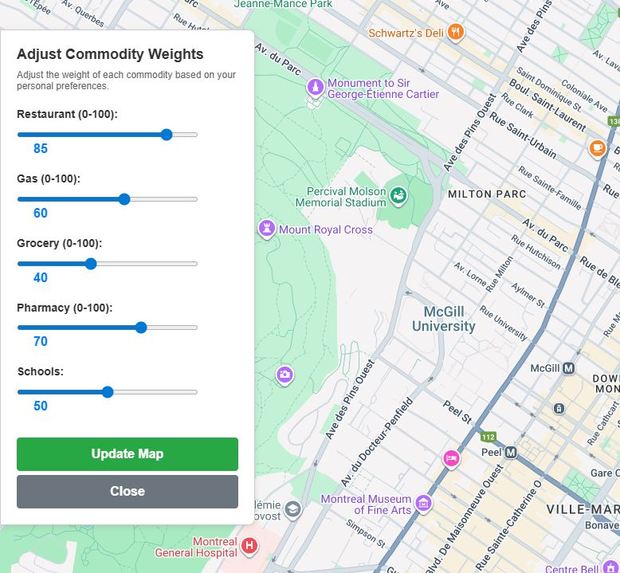
Preference adjustment
-
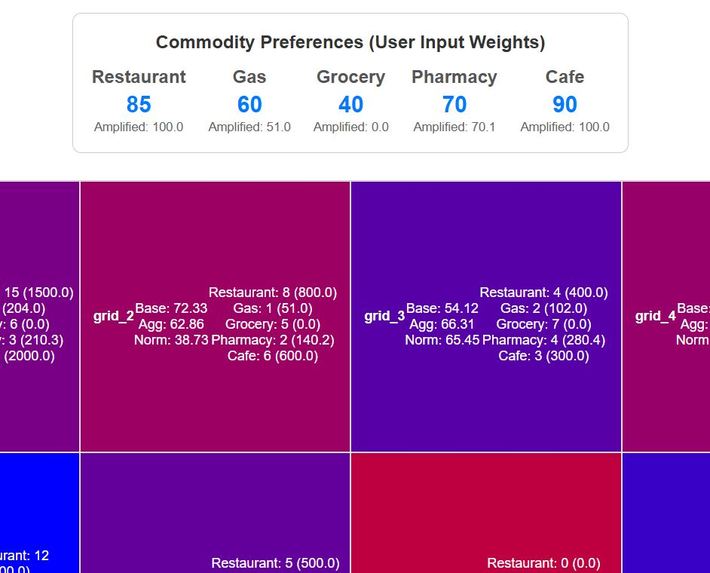
Scoring algorithm (normalized and weighted)


Find Your District
Context
In today’s rental market, it’s increasingly difficult to find affordable housing without sacrificing access to essential amenities. Renters are often forced to manually compare neighborhoods, prices, and nearby necessities such as transit, grocery stores, and healthcare — a process that is time-consuming and overwhelming.
We asked ourselves: why not build a tool that helps people find the best places to live within the same price range, based on what actually matters to them?
That question became Find Your District.
What it does
Find Your District is a map-based application that helps users identify and compare neighborhoods based on nearby amenities and overall livability.
- Users explore areas on an interactive map where neighborhoods are scored and visualized using color-coded heatmaps
- The system emphasizes popular and highly rated amenities (based on Google ratings and activity)
- Users can quickly visualize areas that match their interests
- Supports real-time district-level comparisons
How we built it
Data Fetching
We used the Google Maps API and Google Places API to collect amenity and commodity data.
Visualization
We used Deck.gl to render heatmaps that highlight high-value living areas.
Caching System
API calls are expensive, so we implemented a geohash-based grid caching system.
Small geographic grids are cached and reused to minimize redundant API requests.
Scoring Algorithm
We evaluate each data point relative to the mean and standard deviation of the dataset. Each area is scored based on:
- User preferences
- Amenity popularity and rating
- Distance to preferred amenities
Challenges we ran into
Accurate area representation required large amounts of data, which increased operational costs (approximately $32 CAD per 1,000 API calls). Additionally, each grid was evaluated against every amenity data point, significantly increasing time complexity and causing delays in user experience.
Designing a fair scoring system was also challenging. Not all amenities have equal importance, and balancing their weights required multiple iterations. We also faced difficulties with map rendering, API rate limits, and efficiently displaying large volumes of location data without overwhelming users or hurting performance.
Accomplishments we’re proud of
- Turning raw geographic and amenities data into an intuitive visual experience.
- Building a working heatmap that meaningfully reflects neighborhood value within a hackathon timeframe.
What we learned
Through this project, we learned how to:
- Work with real-world geospatial data using Google APIs
- Reduce time-complexity of recurring calculations
What’s next for Find Your District
In the next few months, we plan to:
- Optimize data-fetching to obtain more relevant and accurate data points
- Improve scoring efficiency and reduce time complexity toward O(log N)
- Enhance visualization to support better decision-making
Built With
- copilot
- css3
- docker
- geohash
- google-maps
- google-places
- html5
- javascript
- mongodb
- visual-studio-code


Log in or sign up for Devpost to join the conversation.