-
-
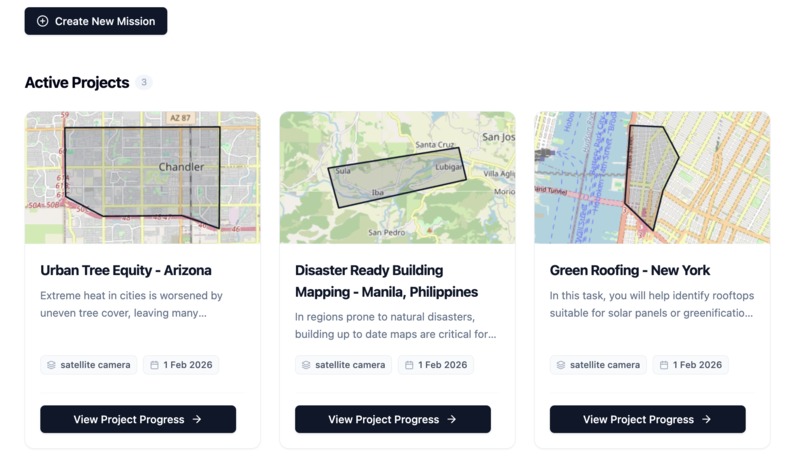
explore active missions
-
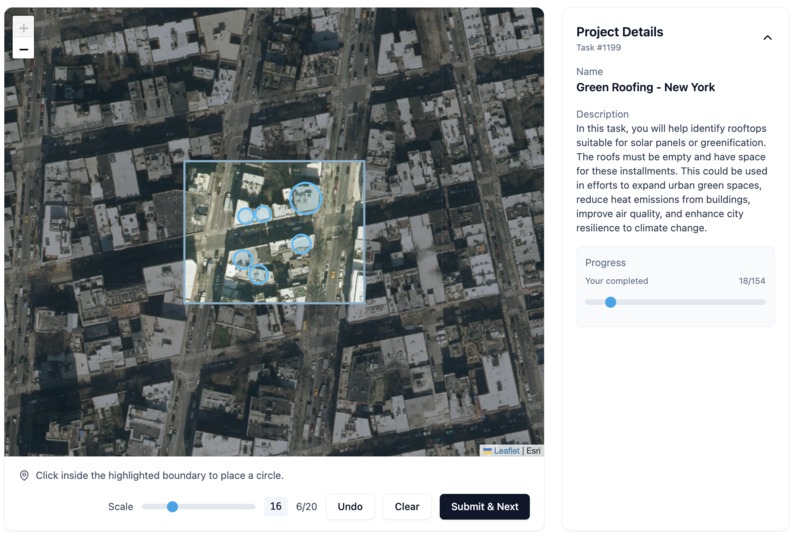
reviewers label according to project rules
-
mission creators receive geospacial dataset


Inspiration
eco-mapping was inspired by two areas: map-based games such as GeoGuessr and geospatial environmental platforms such as Global Fishing Watch.
A key influence was Global Fishing Watch, which shows how satellite imagery, human verification, and machine learning can be combined to monitor environmental activity at scale. The project began with volunteer ship labelling and later transitioned to automated detection using machine learning. This demonstrated that human-reviewed geospatial data can act as a foundation for scalable environmental systems. The core idea behind eco-mapping was to generalise this approach so it could be applied to other environmental problems.
To extend this concept, I planned to combine it with the mechanics of map exploration games like GeoGuessr. The intention was to use scoring and interaction to encourage participation, while simultaneously raising awareness and producing high-quality datasets.
What it does
eco-mapping is a web platform for crowdsourced annotation of satellite imagery.
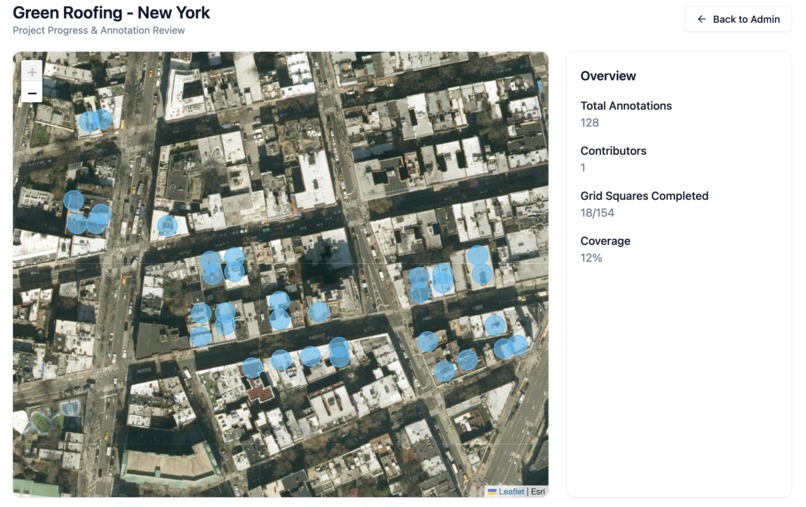
Mission creators define projects by selecting a geographic area, providing context about an environmental issue, and reviewing aggregated outputs through map visualisations.
Reviewers are assigned random map segments within a mission and draw annotations directly on satellite imagery. I planned to take the further by layering multiple submissions to form consensus-based heatmaps, producing geospatial labels that can be used for analysis or as training and validation data for machine learning models.
How we built it
Tech stack:
- Backend: FastAPI + PostgreSQL with PostGIS for spatial queries
- Frontend: React 18 + Leaflet for interactive maps + Tailwind CSS
- Infrastructure: Docker Compose
The system was designed before implementation, with a focus on structure and data flow. The planning stage included: UML class diagrams UML data diagrams UML flow diagrams Figma designs and low-fidelity mockups Once the architecture was defined, the backend was implemented with documented endpoints and basic testing. Frontend logic was then implemented to follow the predefined flow, ensuring consistency between user interactions and backend behaviour.
Challenges we ran into
This was my first time working with interactive draw tools and mapping tools. Key challenges included:
- Managing user-drawn geometries (creation, editing, and deletion)
- Ensuring correct spatial behaviour across zoom levels
- Geometry serialisation between PostGIS and GeoJSON
Accomplishments that we're proud of
Making a functioning MVP with key working components within the time limit!
What we learned
This was my first project using geospatial data in a full application. Key learnings included:
- Working with PostGIS spatial queries and WKT geometry handling
- Integrating Leaflet map rendering and draw tools
- Trade-offs between pixel based and meter based geometry rendering
What's next for eco-mapping
The main missing component is a scoring and evaluation system. Without consensus evaluation, users cannot currently be scored, which weakens the gamification aspect. The design exists, but it was not implemented within the available time.
- Additional next steps include:
- General polish and UX improvements
- Adding project editing and deletion
- Implementing CSV uploads for validation datasets, enabling integration with existing ML pipelines
Built With
- css
- fastapi
- postgis
- postgresql
- python
- sqlalchemy
- tailwind

Log in or sign up for Devpost to join the conversation.