Make smarter decisions, faster.
Connect, analyze, and act on your data, without the steep price or learning curve. Then give everyone access to the answers they need, fast.
Connect your data
Connect data from nearly any source, so all your company’s key metrics live in one place.
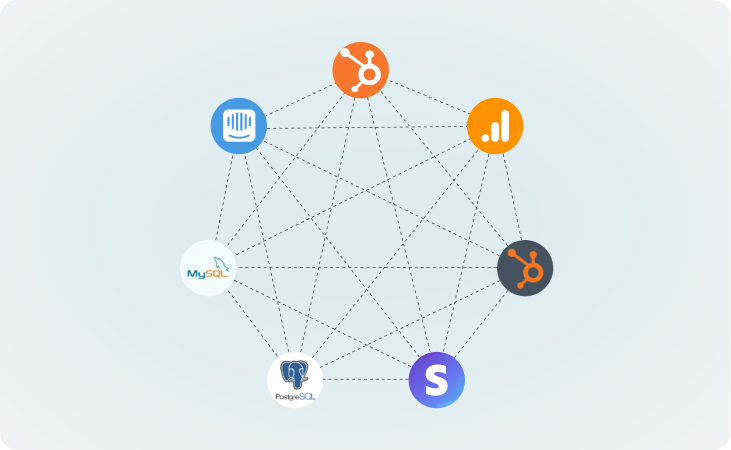
Connect the apps you use most
Sync data from 130+ pre-made integrations in a few clicks. We handle API changes, updates, and maintenance so you don’t have to.
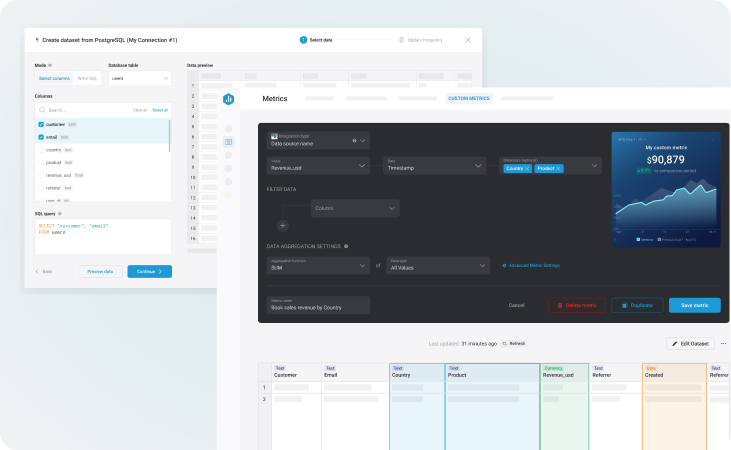
Connect databases & spreadsheets
Bridge the gap between your backend data and business decisions by creating metrics and dashboards from databases, cloud warehouses, and spreadsheets.
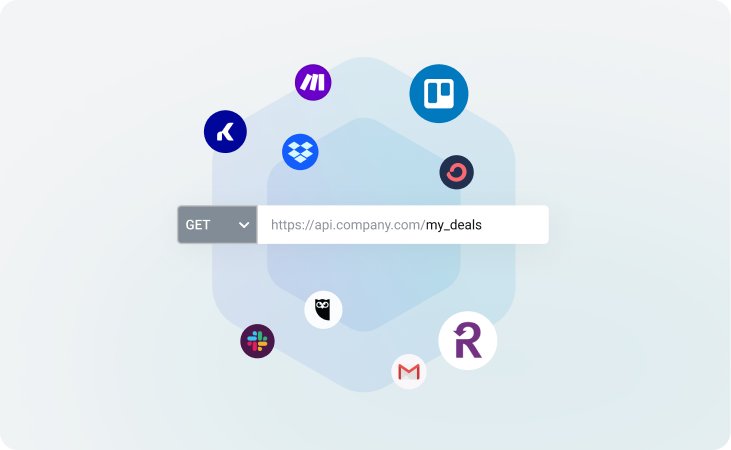
Use our custom API
No integration? No problem. Use our API to pull in the data that matters most to your company.
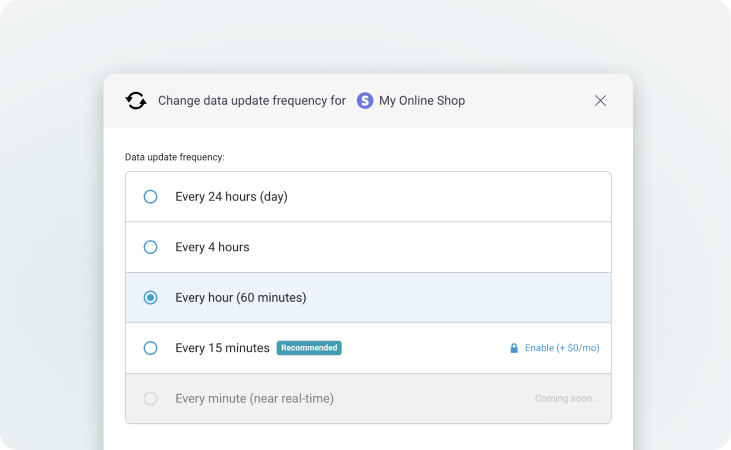
Select your sync frequency
Get the right data at the right time. Choose how often each source updates, from near real-time to every 24 hours.
Prepare your data for better analysis later
Clean, organize, and shape your data so every metric is reliable and built on a solid foundation.
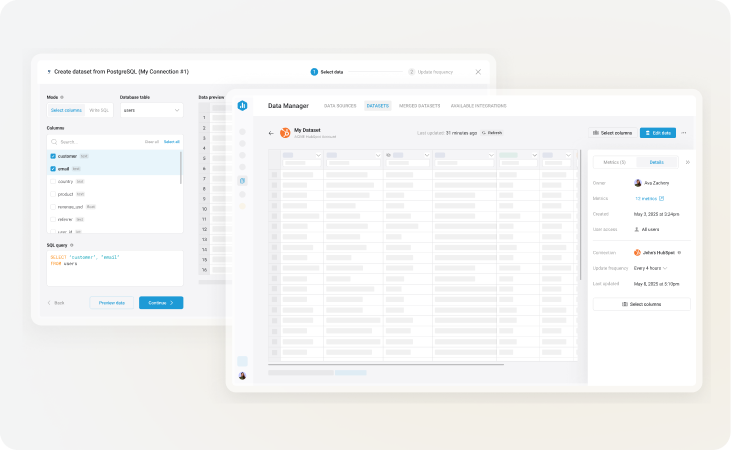
Prepare datasets
Create a custom table of raw, row-level data to analyze or build metrics from.
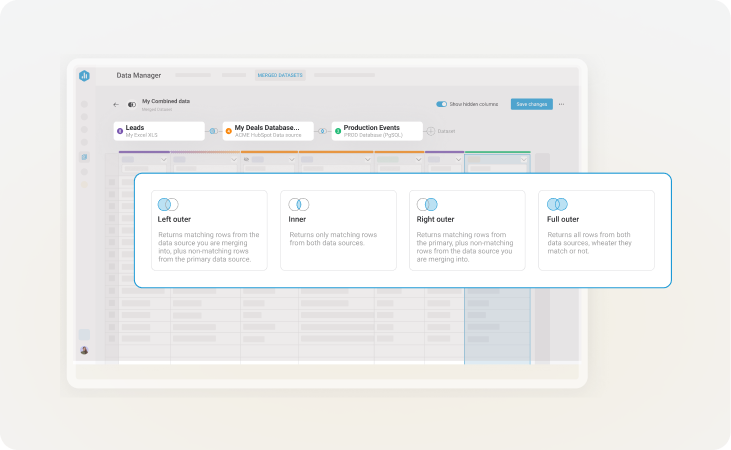
Merge datasets together
Blend data from multiple sources to uncover insights you can’t see in isolation.
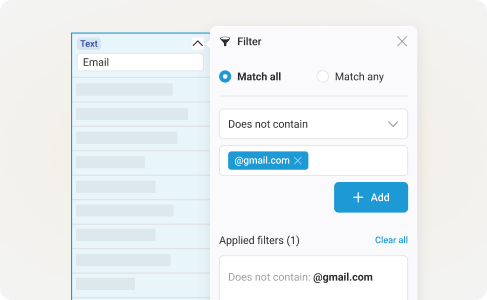
Filter out irrelevant data
Zero in on what matters most and remove the rest.
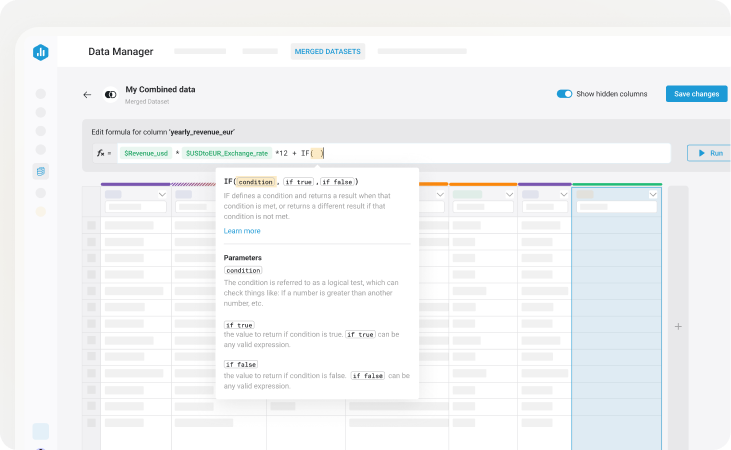
Calculate & create columns
Create derived metrics by calculating custom columns together.
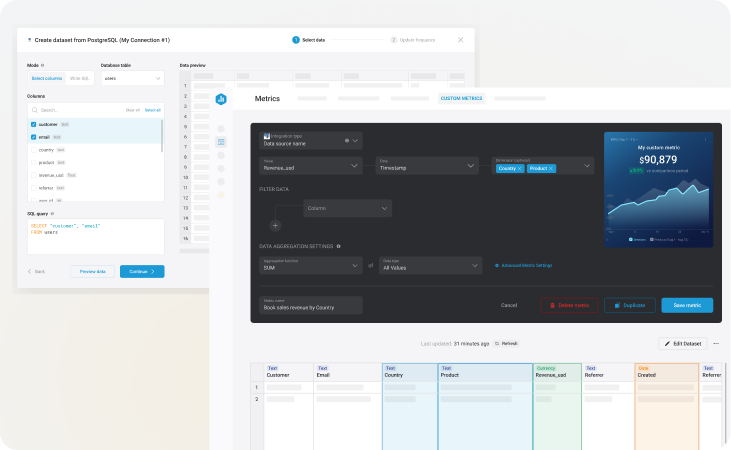
Build custom metrics
Create the metrics that matter most to your company, by adding multiple filters and dimensions or calculating metrics together.
Visualize key metrics
Drag and drop your metrics onto no-code dashboards, or view metric insights to dive deeper into a particular one.
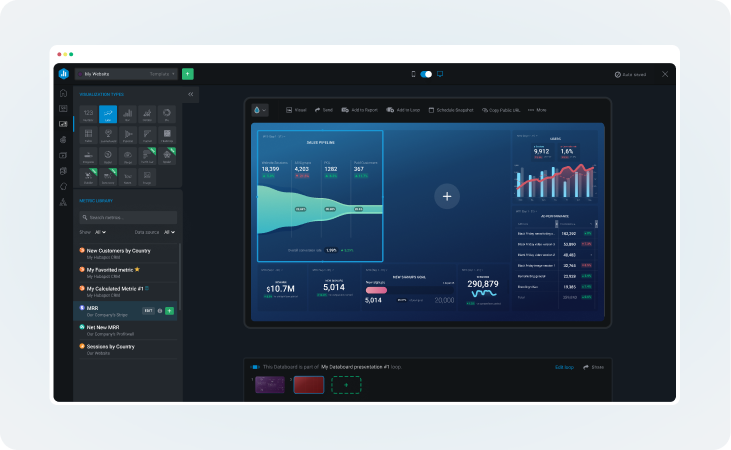
Build no-code dashboards
Create beautiful, highly customizable dashboards without code. Easily resize and rearrange metrics, or customize the styling to match your brand.
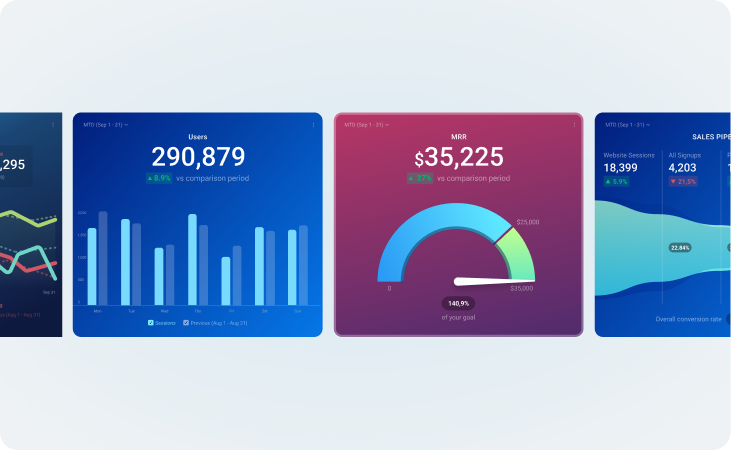
Find the perfect visualization
Choose from a variety of visualization types (including radial, pie, funnel, and more) to present your data clearly and uncover insights faster.
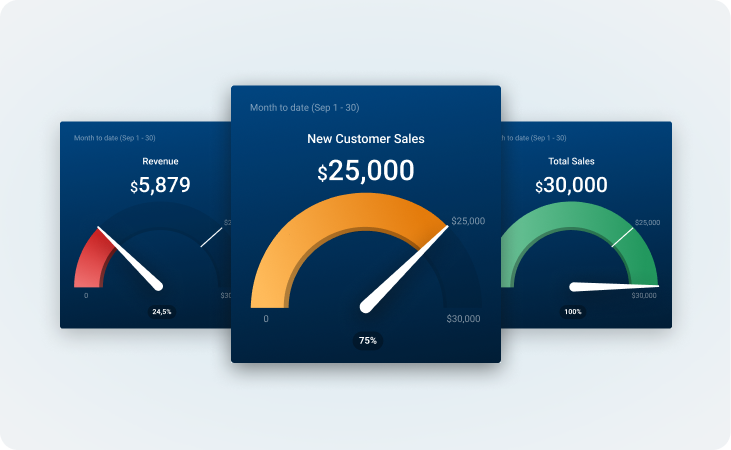
See goal progress
Add goals to your dashboards and reports to track progress visually with gauges and progress bars.
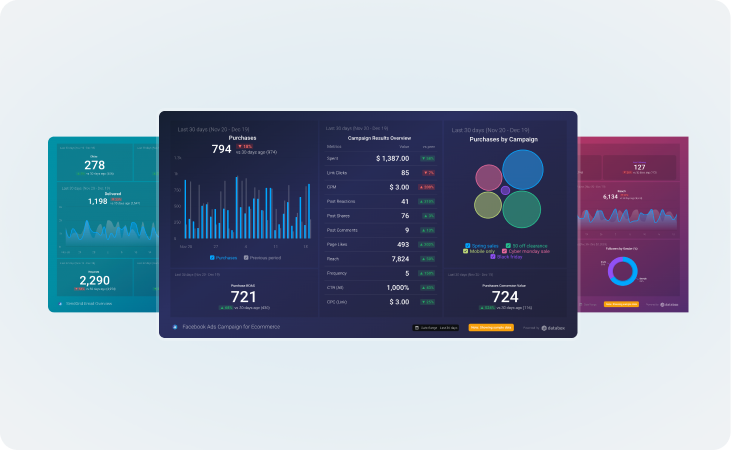
1-click templates
Start with a pre-made template to build a report or dashboard in one click, then customize it for your own needs.
Analyze trends and performance
Understand how your business is performing and why it’s performing that way.
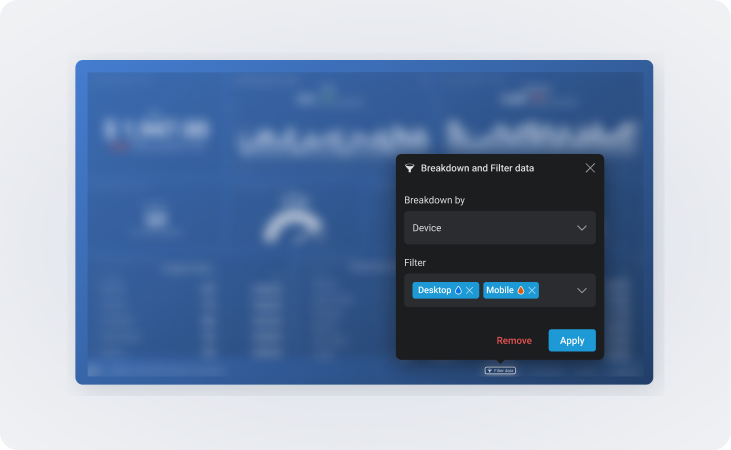
Analyze from various dimensions
Break down and filter entire dashboards, or the metrics on them, by different dimensions.
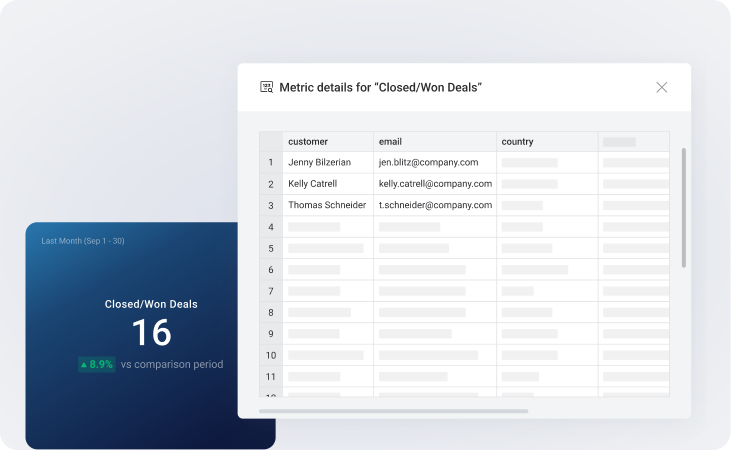
Drill into row-level data
Click a metric on a dashboard to drill down into the row-level data behind it, to understand what’s driving performance.
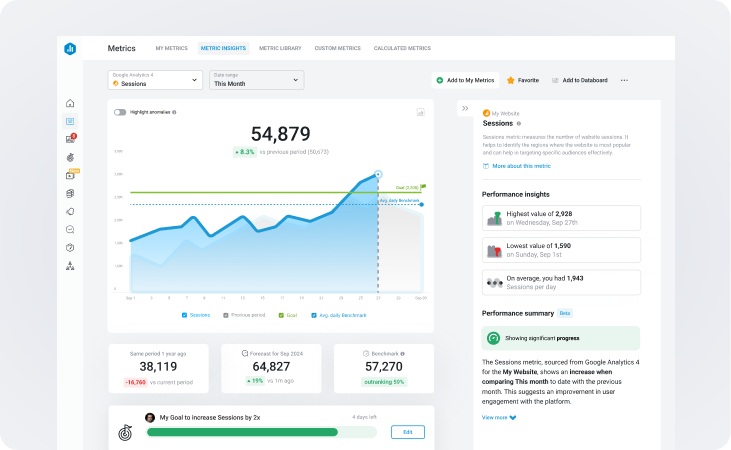
Dig deeper into a specific metric
Understand the why behind the what. Visualize a metric’s performance, uncover anomalies and view forecasted performance.
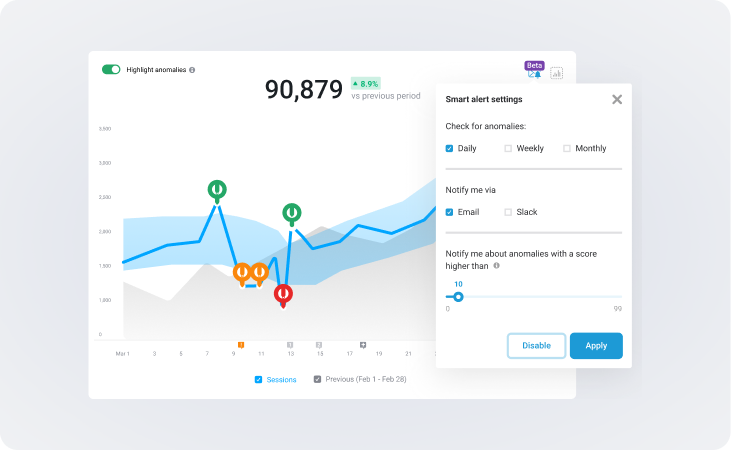
Spot anomalies early
See when performance deviates from typical patterns, so you can respond quickly and keep things on track.
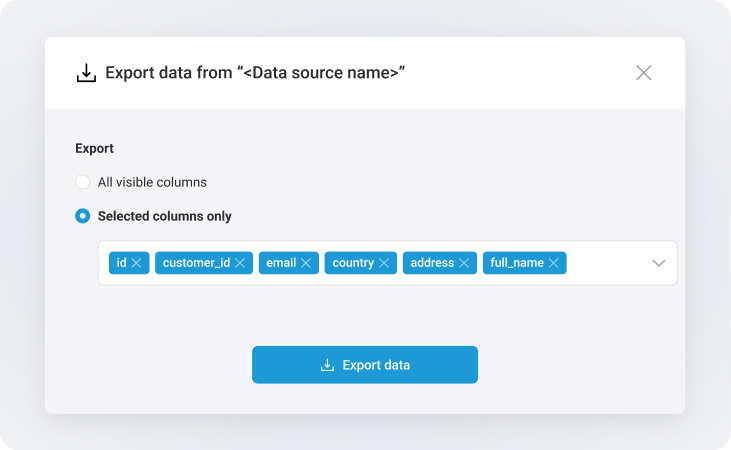
Export to CSV
Take your data anywhere. Prepare it in Databox, then export it for analysis in other tools.
Report performance to stakeholders
Easily share data with your team, board, or clients in the format you prefer.
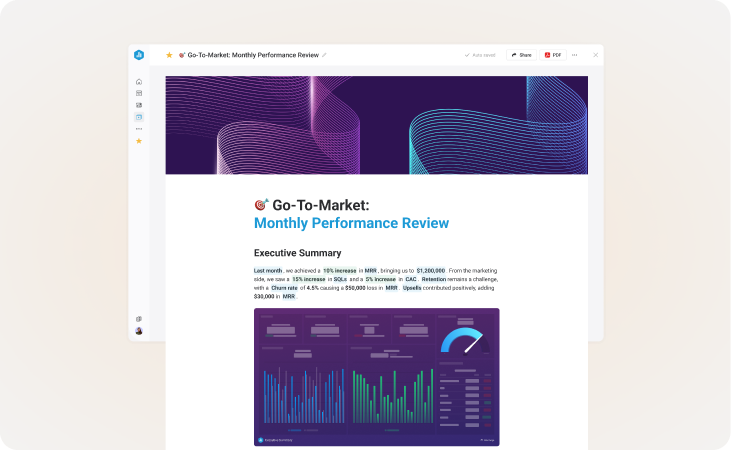
Send automated reports
Create a long-form write-up or presentation, complete with your dashboards, metrics, and AI performance summaries.
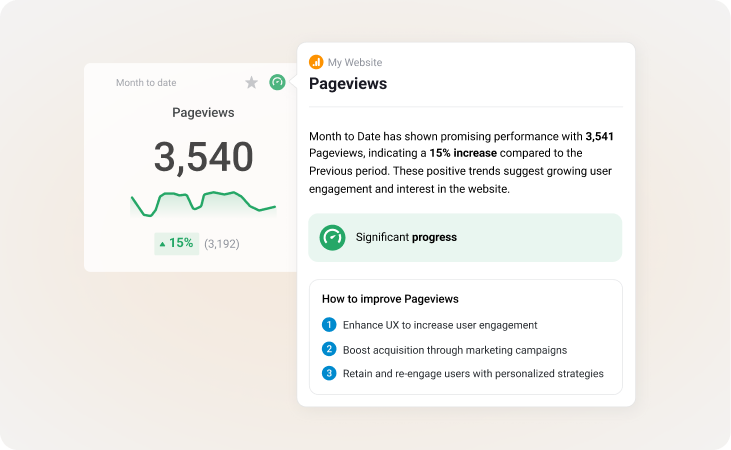
Get AI performance summaries
Save time with AI summaries and recommendations that explain performance trends and suggest what to do next.
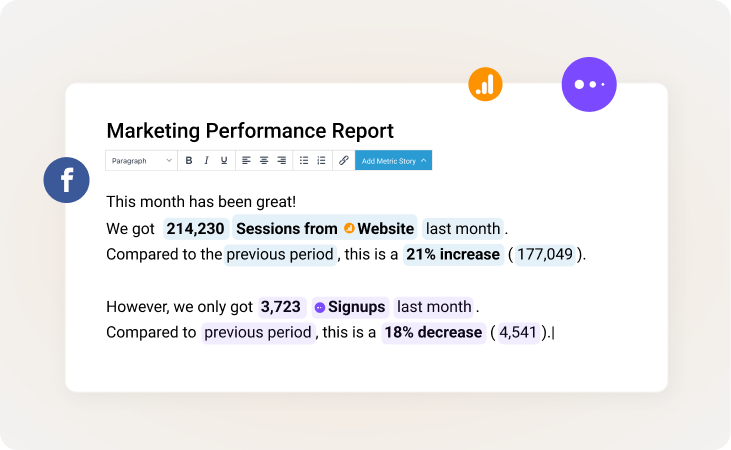
Add Data Stories
Add dynamic elements like metrics, time periods, and percentage of change to the text of your reports to tell a story with your data.
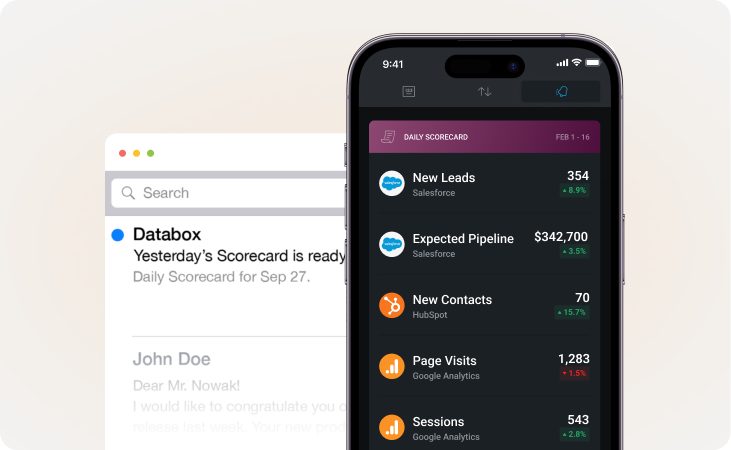
Get performance updates
Send stakeholders automated notifications about key metrics via Slack or email, or get alerted when numbers spike or dip.
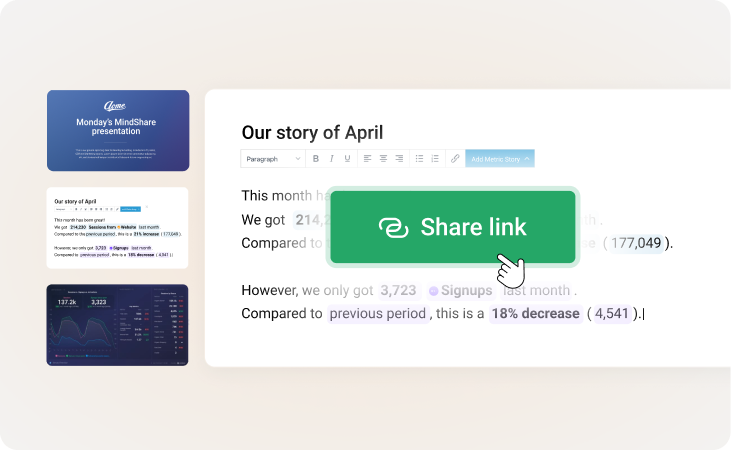
Share dashboards with anyone
Embed dashboards anywhere, or share them with stakeholders who aren’t in Databox.
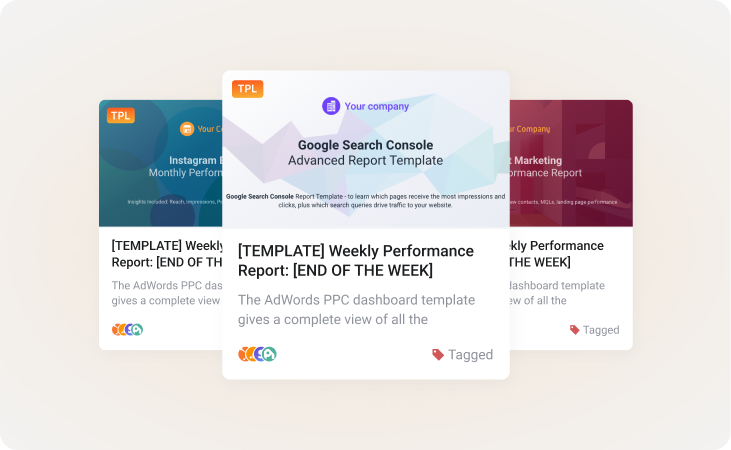
Use or create templates
Start with one of our pre-built templates and customize it for your needs, or create your own from scratch to reuse across clients.
Plan for future growth
Use your data to make better decisions and set better targets.
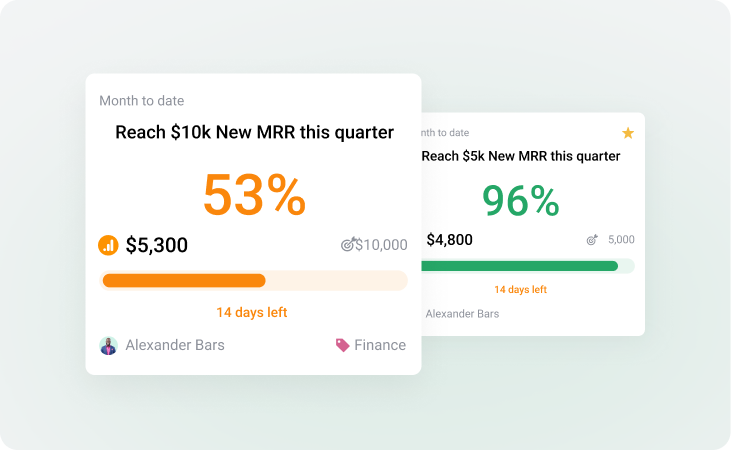
Set & track goals
Set targets for your team or company, break them down into bite-sized steps, and monitor your progress.
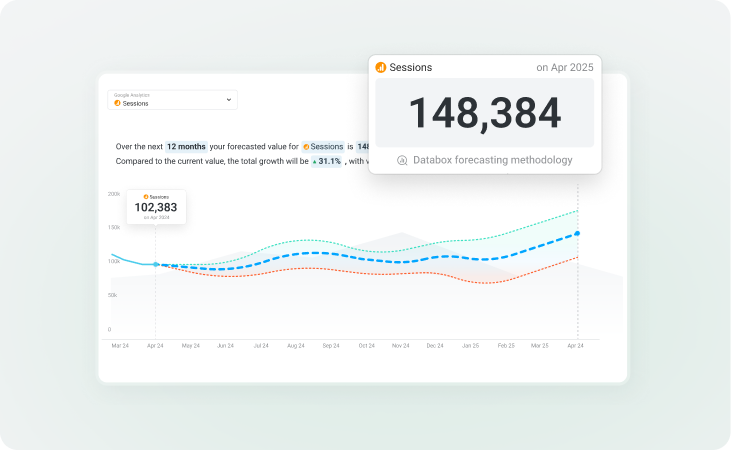
Forecast future performance
Quickly see how a metric is expected to perform in the future, including best and worst-case scenarios.



compliant
 SOC 2
SOC 2certified