Every organisation measures success differently. Custom Reports provide the flexibility to analyse user behaviour, content performance, and Ecommerce activity on your terms.
Create reports, apply filters, and structure the output around your actual reporting needs rather than working backwards from predefined dashboards.
Need more granularity? Increase the number of dimensions per report, adjust row limits, and tune performance for large datasets.
How Custom Reports work
Build reports that reflect your own goals. Choose from hundreds of metrics and dimensions - covering everything from page behaviour and form completions to checkout steps and content consumption.
Compare behaviours across different visitor segments and identify patterns that may otherwise remain hidden in broader reports.
Put recurring reports on autopilot
Automate report delivery and spend less time compiling updates. Schedule custom reports for automatic delivery via email or SMS, or extend delivery options to Microsoft Teams or Slack with integration plugins. The right people see the numbers they need, on a cadence that suits them.
Export and share data your way
Export directly from the Matomo interface, pull data via the HTTP API, or query the underlying MySQL tables for advanced workflows. Use your custom report data in Looker Studio, BI platforms, data warehouses or wherever your organisation's reporting already lives.
Add reports as dashboard widgets to share focused views with specific teams, clients, or stakeholders with controlled access.
Understand what happens before a conversion
Pair Event Tracking with Custom Reports to see which interactions (clicks, downloads, video plays, form completions) precede conversions. Identify where users drop off and treat those exit points as optimisation opportunities rather than lost causes.
Built into the Matomo experience
Custom Reports extends what's already in Matomo, giving you more ways to explore and interpret your data.
Apply Segments to analyse specific audiences, use Row Evolution to track changes over time, Visitor Logs to investigate individual journeys, and pivot reports to compare data across multiple dimensions. Build custom dashboards to bring related reports together in one view.
Try Custom Reports Today
No cap on reports. Create as many custom reports as you need for marketing, product, sales, finance, or executive audiences. There is no limit on the number of reports you can create and share.
Start your 30-day free trial today. Full access to Custom Reports. No credit card required.
Custom Reports features
- Create compelling custom reports tailored to your needs without any developer knowledge in just seconds.
- Choose from over 200 dimensions and metrics.
- Supports several visualisations including evolution over time graphs, data tables, bar graph, pie chart, cloud chart, and others.
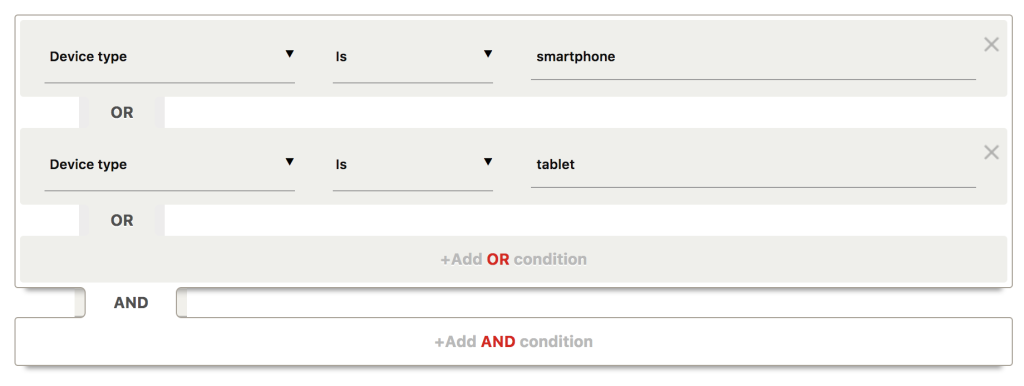
- Define a report filter which is applied on the raw data to show the data only for a subset of your visitors and users.
- Put your custom report on any existing reporting page or on its own reporting page.
- Superusers can make reports available for all websites.
Integrates with Matomo Analytics
Export and API features
- Get automatic email and sms reports for your custom reports, or send them to your colleagues or customers.
- Embed the custom report widgets directly in your app, dashboard, or even TV screen!
- HTTP API to manage your custom reports.
- HTTP API to fetch and export all Custom Reports.
- Get access to all the raw data via MySQL for 100% data ownership.
Demo
-
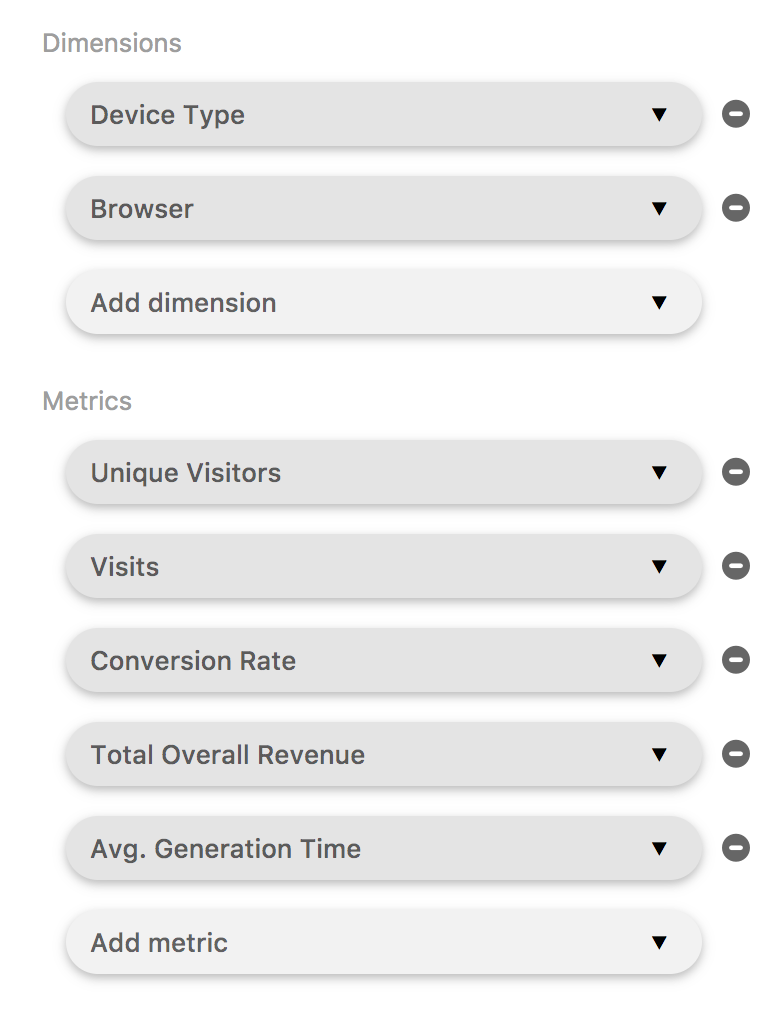
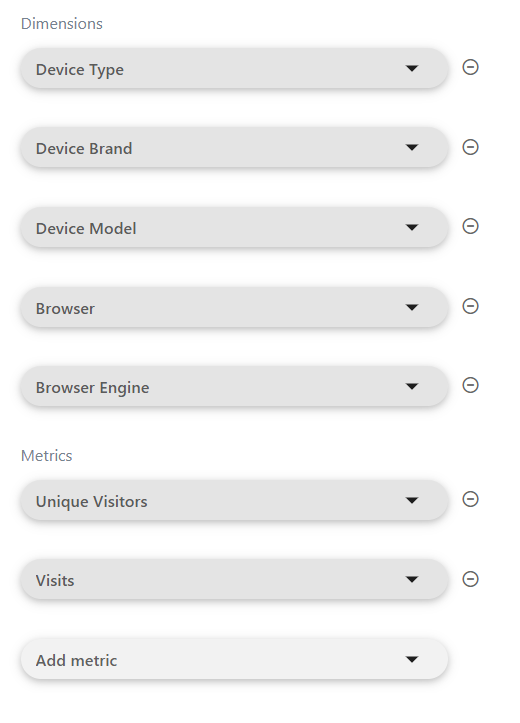
Report Content Definition
-
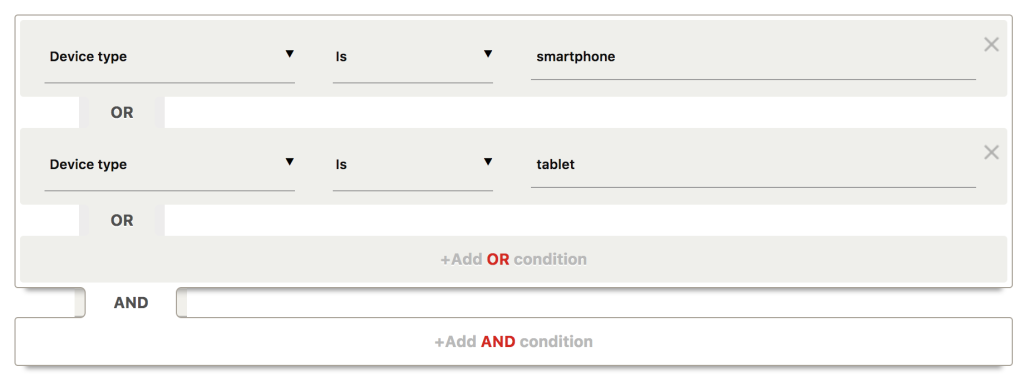
Report Filter Definition
-
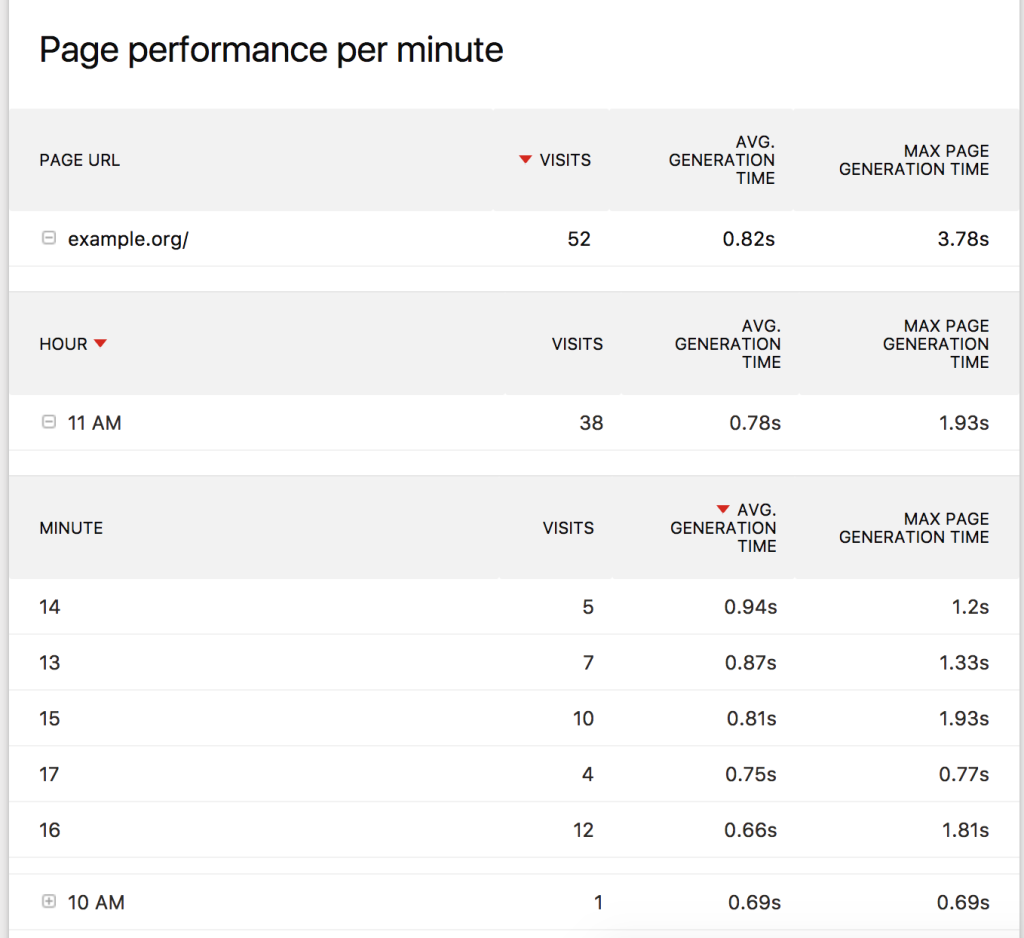
Example Report By Minute
-
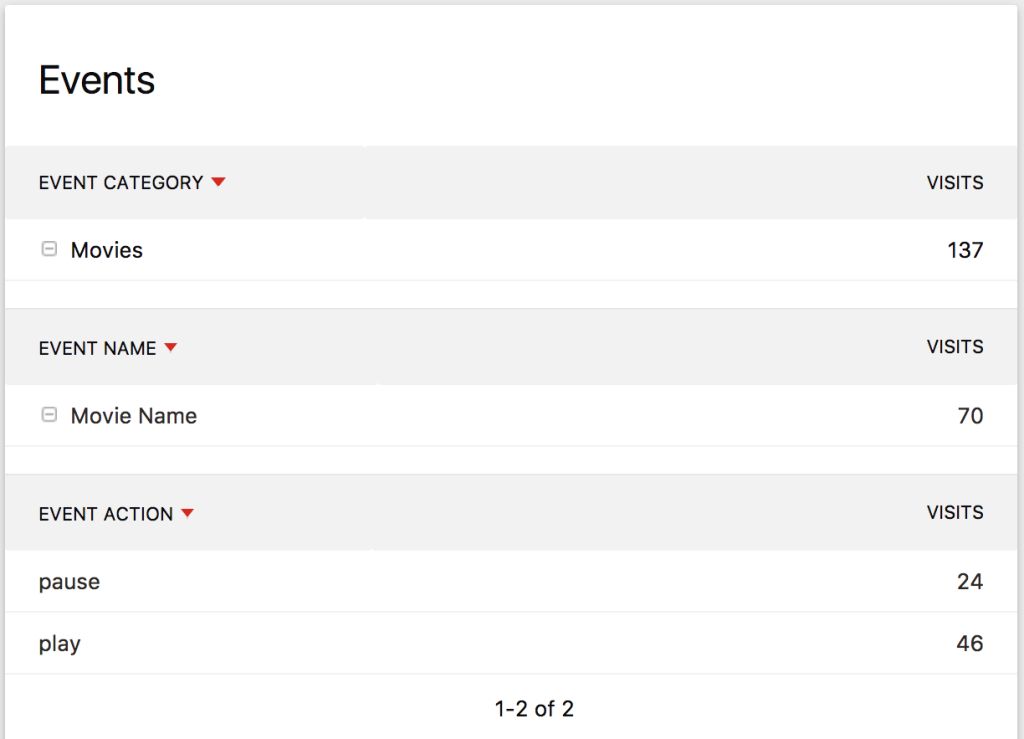
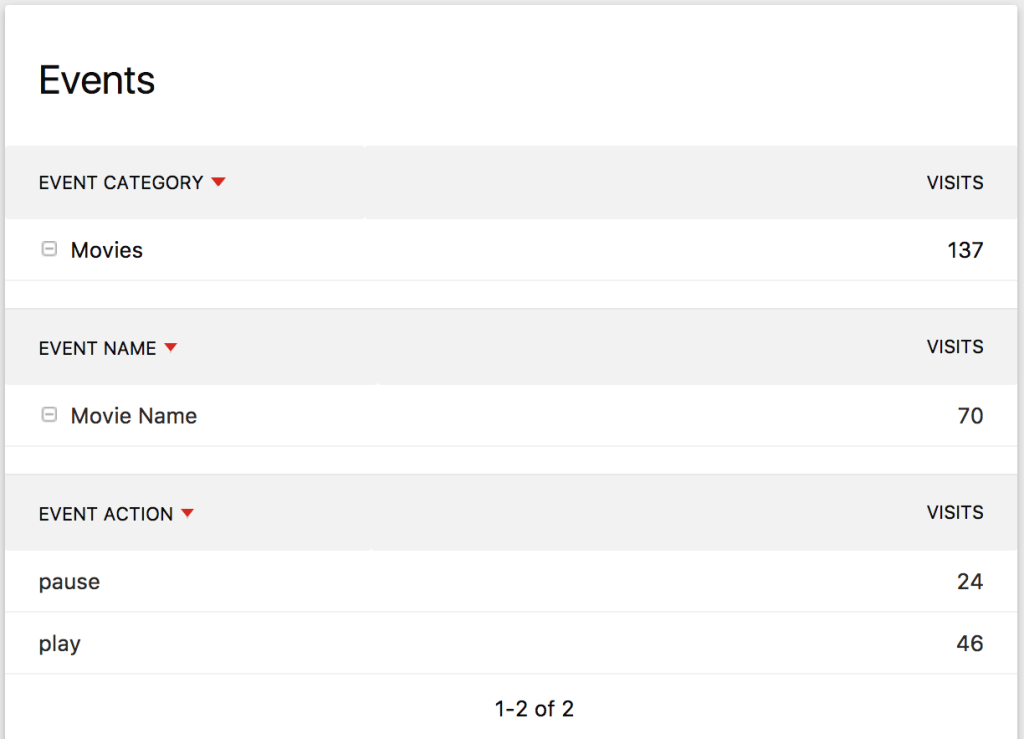
Example Report Events
-
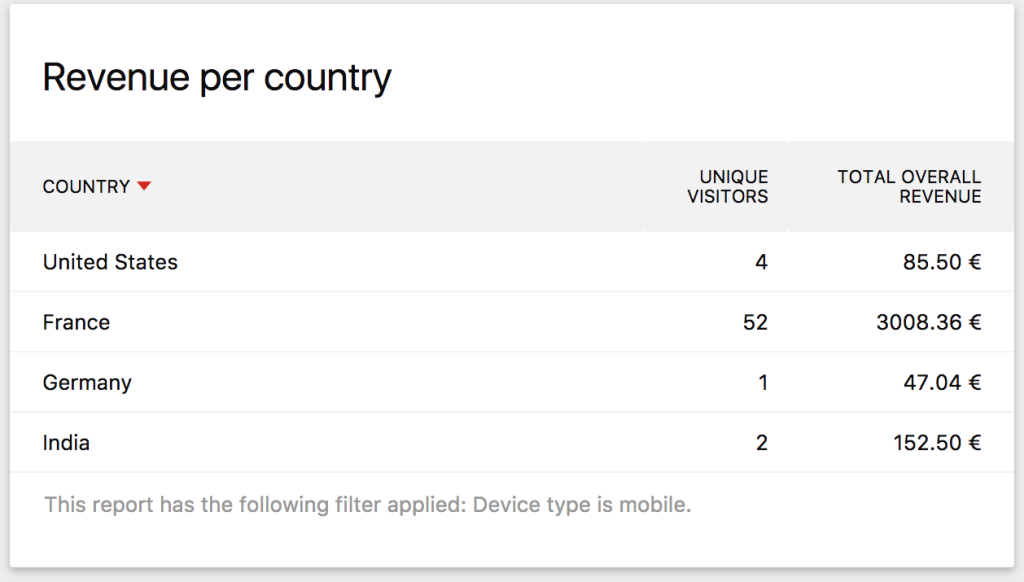
Example Report Revenue Per Country
-
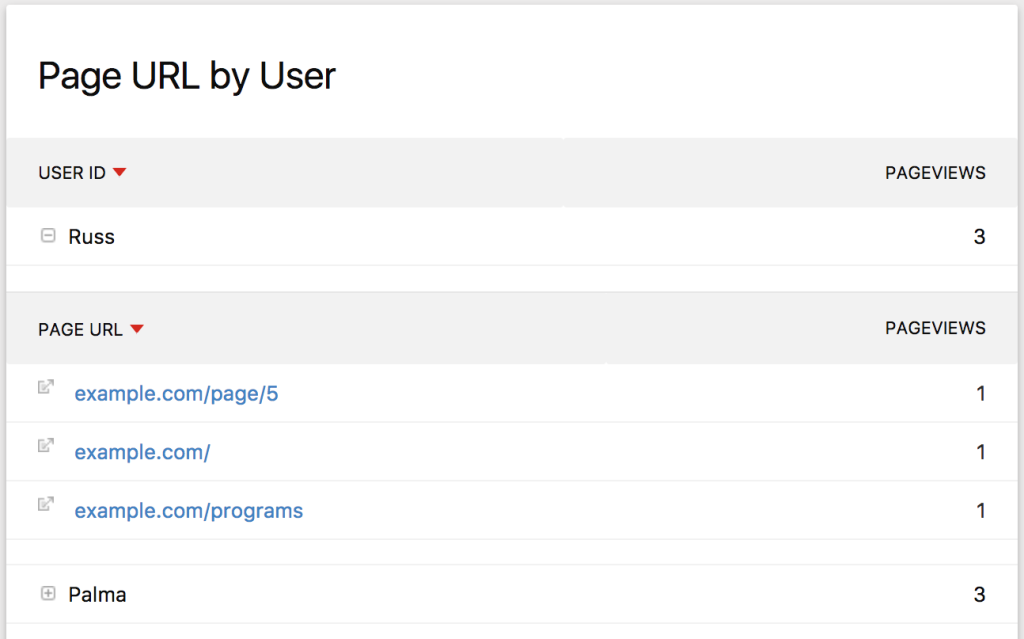
Example Report By User