





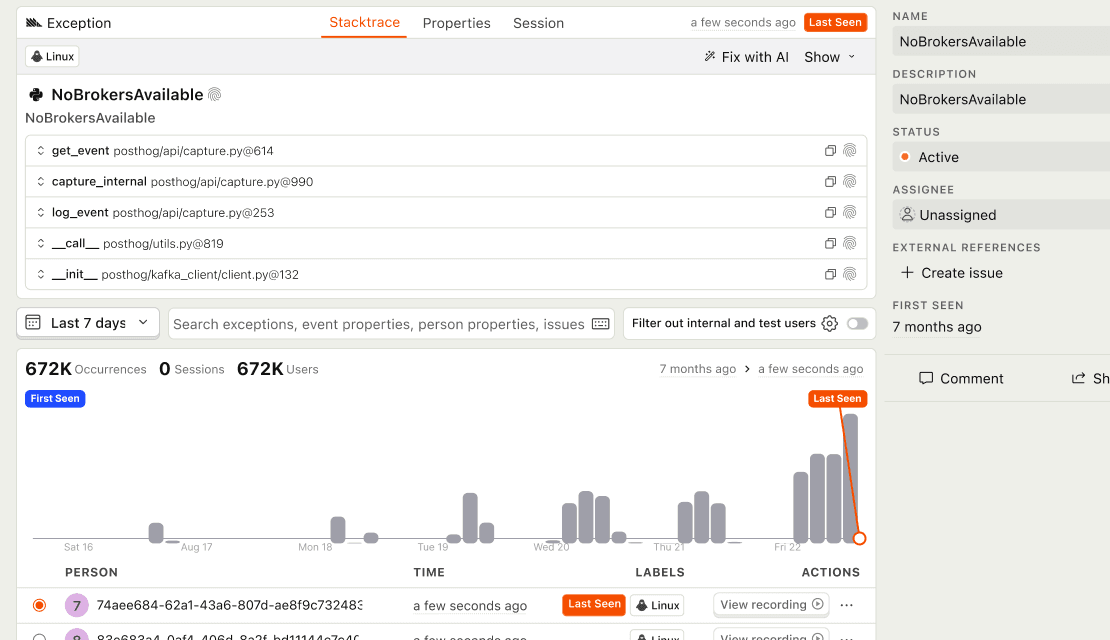

Track errors and resolve issues
Error tracking is one of the tools that makes your product self-driving: every exception is tied to the user who hit it, so agents have the context to ship the fix. Built to natively work with product analytics, session replay, and feature flags.
Install with AI in a single prompt
Paste into your terminal or code editor and make AI do the work.
What does it do?

Error Tracking captures exceptions from across your stack and turns them into issues you can prioritize, assign, and resolve. Because PostHog already knows what's happening in your product, every issue comes with the affected user's session replay, events, and properties attached – so you can see what went wrong instead of trying to reproduce it.
Who is it for?
Error Tracking is used across teams depending on your role.
How do I use it?
There are a few ways to explore Error Tracking.
Debug errors from your editor
Triage issues, inspect stack traces, and generate fixes from Cursor, Claude Code, VS Code, or any MCP-compatible agent.
Top features
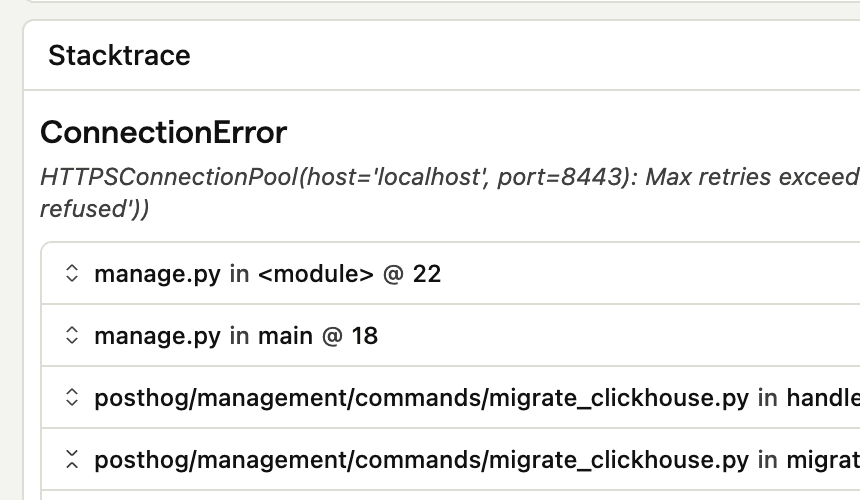
Stack traces
Get code context automatically with PostHog's server-side libraries, or upload source maps for front-end frameworks
AI prompts
Ask PostHog AI to find issues, inspect stack traces, and help ship the fix. Works in PostHog AI (in-app chat), PostHog Desktop (our AI code editor), and in your product editor (using the MCP). Already signed in? Click a prompt to try it.
Findquery-error-tracking-issues-list
Inspectquery-error-tracking-issue-events
Update statuserror-tracking-issues-partial-update
Assignment ruleserror-tracking-assignment-rules-create
Grouping ruleserror-tracking-grouping-rules-update
External issueserror-tracking-external-references-create
Install
SDKs for web, mobile, and backend – then upload source maps so stack traces stay readable.
Web frameworks
Popular



All























Feature comparison
Questions?
Answers
There are a few ways you can get answers to specific questions about Error Tracking.
- Check the docs
We have an entire docs-wizard dedicated to docs gardening.
- Search the community forums
94 discussions about Error Tracking, there's a good chance your answer is already answered!
- Ask PostHog AI
It's an incredibly useful AI chat that understands the product, docs, community questions, our codebase, GitHub issues, and industry knowledge.
- Talk to a human
Dedicated humans are standing by and ready to assist. Best for questions about volume pricing, terms, and sexy legal stuff.
Works with other PostHog tools
Use Error Tracking with these other PostHog apps to maximize shareholder value.
Works with...
Session Replay
Watch exactly how an error occurred for a specific user
Product Analytics
Analyze trends over time and get alerts when things go wrong
Feature Flags
Roll back features that cause errors, or test fixes with slow rollouts
Get started – free
No credit card required. You get the first 100,000 exceptions free every month, then pricing starts at $0.00037/exception and reduces with volume.
